October 2013 USA State Ranking Map – Boy Was It Cold!

October 2013 in the USA was the 37th coldest since 1895 according to the NOAA.

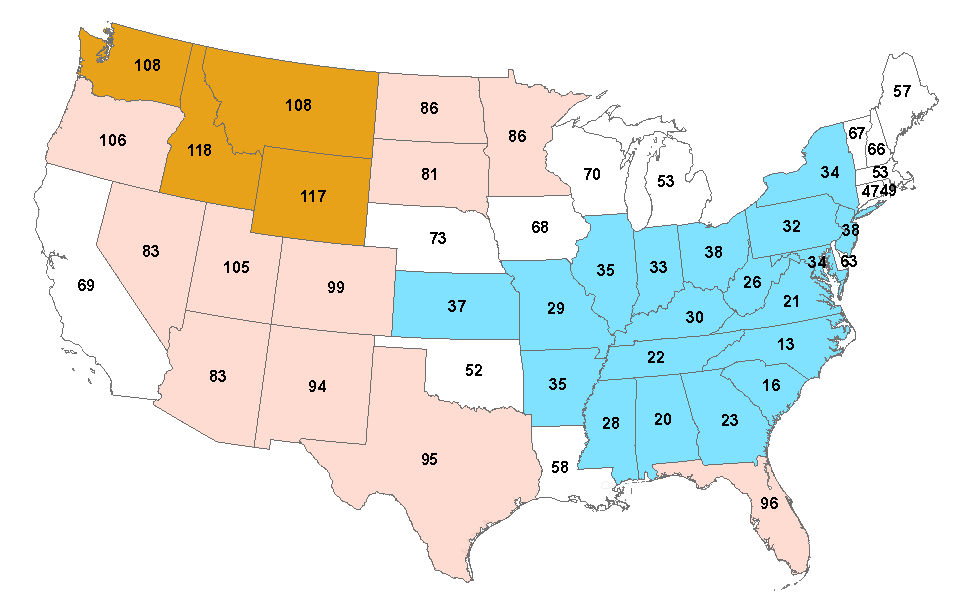
The following map has the ranking by state. If there was a 119 (there was not) it would have been the warmest. 1 would have been the coldest.

As you can see, the whole western USA was well below normal. The center and the south were pretty average. And when the NOAA says average, they mean 50 or 60 Octobers were warmer.

For example, Oregon had the 11th coldest October. Which means 108 Octobers were warmer.

NOAA_October_2013_State_Map

NOAA August 2013 – Only 28 Were Warmer Like 1901,1913,1934,1936,1937,1938,1943,1947 etc

According to the NOAA August 2013 was the 92nd warmest out of 119. That means only 28 were warmer.

These are the 28: 1901,1913,1934,1936,1937,1938,1943,1947,1955,1958,1959,1969,1970,1983,1984,1988,1995,1998,2000,2001,2003,2005,2006,2007,2010,2011,2012

It was cool in the east though. The numbers below are the rank out of 119.

So North Carolina (for example) was 13th warmest out of 119. Which means 107 Augusts in NC were warmer.

NOAA_AUG_2013_Map

5th Wettest July in USA History – NOAA 2013

With all the claims about 2012 being the worst drought in USA history (total joke), I thought I would mention that July 2013 was the 5th wettest July ever according to the NOAA.

Only 1950, 1958, 1992 and 1915 were wetter. July 2013 was .71 inches above the 1901 – 2000 average. July 1930 was the driest.

The 1895 to 2013 trend for precipitation in July is 0. Flat. No trend at all. Perfectly average.

Year To Date precipitation for 2013 is 23rd wettest. 1.54″ above the long term average.

NOAA_July_2013_USA_Precipitation

NOAA 30th warmest July in USA History (even with all the massaging)

Even with all the manipulation of NOAA data to cool the past and warm the present, there were 29 July’s warmer than July 2013 in the USA according to the NOAA.

These July’s were warmer than July 2013.

1901,1917,1921,1930,1931,1933,1934,1935,1936,1937,1939,1954,1955,1964,1966,1977,1980,1988,1998,1999,2001,2002,2003,2005,2006,2007,2010,2011,2012

1936 was the 2nd warmest. 1934 was the 4th warmest. And 1901 was the 6th warmest. According to the NOAA. I suspect 1936 was really the warmest, but NOAA data says otherwise today.

The USA population (along with UHI) has risen from 128 million in 1936 to 319 million.

NOAA 2013 – Brutally Cold Spring

What a brutal Spring. in the USA according to the NOAA.

Look at all those single digit rankings. Rank: (1 = Coldest and 119 = Warmest)

3rd coldest Spring out of 119 in Minnesota.

4th coldest in North and South Dakota. 5th coldest in Arkansas.

This should not be possible if AGW was real.

State Spring_2013 Spring Rank Coldest Spring Coldest Spring F
Minnesota 35.9 3 1950 34.43
North Dakota 33.83 4 1899 31.33
South Carolina 59.3 4 1960 58.87
Arkansas 57.33 5 1960 56.47
Alabama 60.1 6 1960 59.07
Georgia 60.67 6 1960 59.77
Mississippi 60.53 6 1960 59.97
Iowa 43.87 7 1960 42.83
Louisiana 63.7 7 1931 61.9
Missouri 51.17 7 1960 49.77
North Carolina 55.93 7 1960 54.9
Tennessee 54.9 8 1960 52.93
South Dakota 40.23 9 1950 37.6
Wisconsin 38.8 9 1950 37.3
Oklahoma 56.27 11 1924 54.3
Kansas 50.5 12 1924 48.3
Florida 68.1 13 1931 66.4
Kentucky 52.8 14 1960 50.53
Nebraska 44.9 16 1917 42.97
Illinois 49.17 19 1960 46.6
Virginia 53.03 34 1960 51.03
West Virginia 49.87 34 1960 46.8
Michigan 40.97 39 1950 37.6
Michigan 40.97 39 1940 37.6
Indiana 50.03 40 1960 46.53
Texas 64.2 40 1931 60.13
Colorado 42.73 42 1917 37.23
Montana 40.57 45 1917 35.5
Maryland 51.77 50 1940 48.63
Wyoming 39.67 57 1917 32.37
Ohio 49.5 58 1926 45.07
Pennsylvania 47.47 62 1984 43.57
New Jersey 50.3 63 1940 46.27
Connecticut 47.1 71 1967 42.13
New York 43.83 75 1926 38.57
Delaware 53.33 76 1940 48.63
Utah 47.8 76 1917 39.47
Massachusetts 46.17 77 1967 40.97
Washington 48.07 82 1955 41.5
Oregon 47.4 83 1917 42
Idaho 43.97 85 1917 36.17
Rhode Island 47.5 85 1917 40.97
New Mexico 53.47 92 1917 47.53
Maine 40.83 93 1926 33.7
Vermont 42.67 94 1926 34.03
Nevada 49.93 97 1917 41.17
New Hampshire 43.43 98 1926 35.4
Arizona 60.87 108 1917 52.4
California 60.13 113 1917 52.37

Coldest April Ever in North Dakota – NOAA USA April 2013 (updated ranking table)

After looking at the national ranking (23rd coldest) it is time to look at the State data:

In the last 119 Aprils, it was the coldest April ever in North Dakota. 2nd coldest ever in South Dakota. 3rd coldest ever in Minnesota, 4th coldest ever in Nebraska, 7th coldest ever in Oklahoma, 8th coldest ever in Wisconsin.

North Dakota was 18.5F colder than the warmest April (which occurred in 1915).

26 out of 48 states had an April ranked below 60. Which means they were ranked in the bottom half of the 119 Aprils measured by the NOAA.

Only one state (California) had an April in the top 20.

NOAA_April_2013_Map

State Apr 2013 Avg F Apr Rank (1=Coldest) Coldest Apr Coldest Apr F
North Dakota 31 1 2013 31
South Dakota 36.7 2 1920 35.6
Minnesota 33.9 3 1950 32.5
Nebraska 42.3 4 1920 38.9
Oklahoma 54.6 5 1983 53.2
Kansas 48.3 7 1983 46.9
Wisconsin 37.6 8 1950 35.2
Montana 37.7 11 1975 33.7
Wyoming 35.8 12 1920 32.2
Iowa 43.7 13 1907 40.1
Michigan 39.1 16 1907 35
Arkansas 58.4 18 1907 54.1
Missouri 51.8 19 1907 47.6
Texas 63.1 20 1997 59.7
Colorado 40.4 21 1920 34.3
Louisiana 64.5 23 1983 61.4
Illinois 49.8 29 1907 43.2
Mississippi 62.2 35 1983 58.4
Tennessee 56.9 42 1907 50.6
Utah 45.6 44 1975 39.9
Alabama 62.1 48 1901 57.4
Washington 46.7 50 1955 41.5
Idaho 42.5 52 1975 36.5
Indiana 50.7 53 1907 42.2
Kentucky 54.9 53 1907 46.9
Georgia 63.1 57 1901 57.4
New York 43.5 59 1943 36.8
Maine 39.3 60 1926 33.2
South Carolina 62.1 60 1901 55.1
Oregon 46.3 61 1975 40.1
Oregon 46.3 61 1967 40.1
North Carolina 58.5 63 1907 51
Vermont 41.9 66 1926 33.3
Connecticut 47 68 1943 40
New Mexico 52.3 68 1973 45.8
Ohio 50.4 71 1907 41.3
Massachusetts 46.2 75 1943 40.3
Rhode Island 47.1 79 1907 40.9
Nevada 48.5 80 1967 38.6
Pennsylvania 49 80 1943 41.6
Maryland 53.7 82 1907 45.9
New Jersey 51.5 83 1907 44.5
West Virginia 52.9 83 1907 44.4
New Hampshire 43.3 87 1926 34.6
Arizona 59.7 89 1975 50.6
Virginia 56.2 89 1907 47.1
Delaware 54.5 90 1907 46.4
Florida 71.4 97 1987 65.1
Florida 71.4 97 1901 65.1
California 59.9 108 1967 46.5

Coldest April Ever in North Dakota – NOAA USA April 2013

After looking at the national ranking (23rd coldest) it is time to look at the State data:

In the last 119 Aprils, it was the coldest April ever in North Dakota. 2nd coldest ever in South Dakota. 3rd coldest ever in Minnesota, 4th coldest ever in Nebraska, 7th coldest ever in Oklahoma, 8th coldest ever in Wisconsin.

North Dakota was 18.5F colder than the warmest April (which occurred in 1915).

26 out of 48 states had an April ranked below 60. Which means they were ranked in the bottom half of the 119 Aprils measured by the NOAA.

Only one state (California) had an April in the top 20.

NOAA_April_2013_Map

My rankings are below. You may ask yourself why the table rank doesn’t match the above map from the NOAA?

The answer is ties. NOAA (and I) are counting from 119 to 1 for data table. This is Nebraska (where the two months tied at 4th coldest are ranked 5th):

Nebraska_NOAA_April_2013_Rank

I try and keep my table in synch with NOAA’s table. But I will rethink that.

State Apr 2013 Average F. Apr Rank (Coldest = 1) Warmest April Warmest April Temp Difference
North Dakota 31 1 1915 49.5 18.5
South Dakota 36.7 2 1915 52 15.3
Minnesota 33.9 3 1987 50.2 16.3
Nebraska 42.3 5 1946 55 12.7
Oklahoma 54.6 6 1981 65.4 10.8
Kansas 48.3 7 1948 59.8 11.5
Wisconsin 37.6 8 2010 49.8 12.2
Montana 37.7 11 1910 49.1 11.4
Wyoming 35.8 12 1930 46.5 10.7
Iowa 43.7 14 1955 55.2 11.5
Michigan 39.1 16 1955 49.1 10
Missouri 51.8 20 1954 61.2 9.4
Arkansas 58.4 21 1925 66.6 8.2
Colorado 40.4 21 1981 49.3 8.9
Texas 63.1 22 1967 70.8 7.7
Louisiana 64.5 24 1981 71.3 6.8
Illinois 49.8 34 1955 58.2 8.4
Mississippi 62.2 36 1981 68.9 6.7
Utah 45.6 44 1989 52.4 6.8
Tennessee 56.9 45 1954 63.3 6.4
Washington 46.7 50 1926 52.8 6.1
Alabama 62.1 51 1896 67.9 5.8
Idaho 42.5 53 1987 49.5 7
Indiana 50.7 53 2010 57.3 6.6
Kentucky 54.9 54 1954 61.1 6.2
Georgia 63.1 57 1908 67.8 4.7
Maine 39.3 61 1910 44.5 5.2
New York 43.5 61 2010 49.6 6.1
Oregon 46.3 61 1926 52.7 6.4
South Carolina 62.1 61 1896 66.5 4.4
North Carolina 58.5 64 1954 62.5 4
Vermont 41.9 67 1921 47.2 5.3
New Mexico 52.3 69 1946 57.1 4.8
Connecticut 47 70 1921 51.9 4.9
Ohio 50.4 72 1955 55.5 5.1
Massachusetts 46.2 75 2010 50.4 4.2
Rhode Island 47.1 79 1976 51.1 4
Nevada 48.5 81 1992 53.4 4.9
Pennsylvania 49 81 1941 53.3 4.3
Maryland 53.7 84 2010 57.3 3.6
New Jersey 51.5 84 1921 55.6 4.1
West Virginia 52.9 84 1896 56.5 3.6
New Hampshire 43.3 88 1945 46.8 3.5
Delaware 54.5 90 1994 57.9 3.4
Virginia 56.2 91 1994 58.6 2.4
Arizona 59.7 92 2002 63 3.3
Florida 71.4 97 1947 74 2.6
California 59.9 108 1989 62.1 2.2

NOAA April 2013 – 23rd Coldest April Since 1895

According to the NOAA, April 2013 was the 23rd coldest April since 1895.

The following Aprils were warmer: 1895, 1896, 1897, 1898, 1899, 1900, 1902, 1903, 1905, 1906, 1908, 1910, 1911, 1912, 1913, 1914, 1915, 1916, 1919, 1921, 1922, 1923, 1924, 1925, 1926, 1927, 1929, 1930, 1931, 1932, 1933, 1934, 1936, 1937, 1938, 1939, 1940, 1941, 1942, 1943, 1945, 1946, 1947, 1948, 1949, 1951, 1952, 1954, 1955, 1957, 1958, 1959, 1960, 1962, 1963, 1964, 1965, 1966, 1967, 1968, 1969, 1971, 1972, 1974, 1976, 1977, 1978, 1979, 1980, 1981, 1985, 1986, 1987, 1988, 1989, 1990, 1991, 1992, 1993, 1994, 1996, 1998, 1999, 2000, 2001, 2002, 2003, 2004, 2005, 2006, 2007, 2008, 2009, 2010, 2011, 2012

April’s have been cooling at -.21F per Decade since 1998


NOAA_April_2013

The January-April period has been cooling at -.74F/decade since 1998

NOAA_January-April_2013

USA NOAA March 2013 State Temperatures – Florida and South Carolina 5th coldest out of 119 – 114 Were Warmer.

Florida and South Carolina was coldest state by ranking. 5th coldest out of 119 for March 2013. 114 were warmer.

Kentucky, Mississippi, North Carolina, Tennessee, Georgia and Alabama were amazingly cold at 6th/7th coldest out of 119.

In fact the list of really cold states was very long. Twelve states had an average temperature below freezing!

31 of the lower 48 states were ranked less than 60 out of 119, which is pretty cold.

The warmest state in terms of ranking was California at 111, still colder than 8 March’s.

The biggest difference between March 2013 and the warmest March was North Dakota, 23F colder than 2012.

No state broke a warm record. No sign of “global warming” in March 2013 in the USA.

State Mar_2013 Current Rank Warmest Year Warmest Temp Difference From Warmest
Florida 59 5 1997 70.6 11.6
South Carolina 48.2 5 1945 63.1 14.9
Kentucky 38.9 6 1945 55.6 16.7
Mississippi 50.2 6 1907 65.1 14.9
North Carolina 44.1 6 2012 58.7 14.6
Tennessee 42.6 6 1921 58.6 16
Georgia 50.3 7 1921 64.6 14.3
Alabama 49.9 8 2012 64.3 14.4
Virginia 40.3 10 1921 55 14.7
Illinois 34 11 1946 51.6 17.6
Arkansas 46.2 12 1907 61.2 15
West Virginia 36.3 13 1921 51.6 15.3
Iowa 28.7 14 1910 47.7 19
Missouri 38.2 14 1910 55 16.8
Indiana 35 15 1946 52.1 17.1
Louisiana 55.2 16 1921 67.6 12.4
North Dakota 17.3 16 2012 40.3 23
Wisconsin 23.8 17 1910 40.7 16.9
Minnesota 20.7 22 1910 40.6 19.9
Ohio 35 23 1946 49.5 14.5
Maryland 39 25 2012 52.3 13.3
Kansas 40 34 1910 54.7 14.7
Pennsylvania 34.3 35 1945 47.2 12.9
South Dakota 28.3 35 1910 46.3 18
Nebraska 34 37 1910 50 16
Oklahoma 47.3 38 2007 58.3 11
Delaware 41.2 40 1945 52.6 11.4
Michigan 27.9 42 1945 41.2 13.3
New Jersey 38.8 47 1945 49.5 10.7
Texas 57 53 1904 63.7 6.7
New York 30.6 57 1946 42 11.4
Massachusetts 34.7 60 2012 43.8 9.1
Montana 31.1 60 1910 41.4 10.3
Connecticut 36 63 1946 44 8
Colorado 34.6 66 2012 42 7.4
Rhode Island 37.6 67 1946 44 6.4
Wyoming 31.7 77 1986 39.8 8.1
Oregon 41.7 79 1986 46.2 4.5
Vermont 30.3 83 1946 38.9 8.6
Idaho 36.3 85 1992 42.8 6.5
Washington 42 87 1934 46.2 4.2
New Hampshire 31.8 88 1946 39.4 7.6
New Mexico 46.5 95 2004 49.7 3.2
Utah 41 95 1986 45.6 4.6
Maine 30.7 99 1903 34.5 3.8
Arizona 55.1 110 1895 57.1 2
Nevada 44.6 110 2004 47.8 3.2
California 55.2 111 2004 58.5 3.3