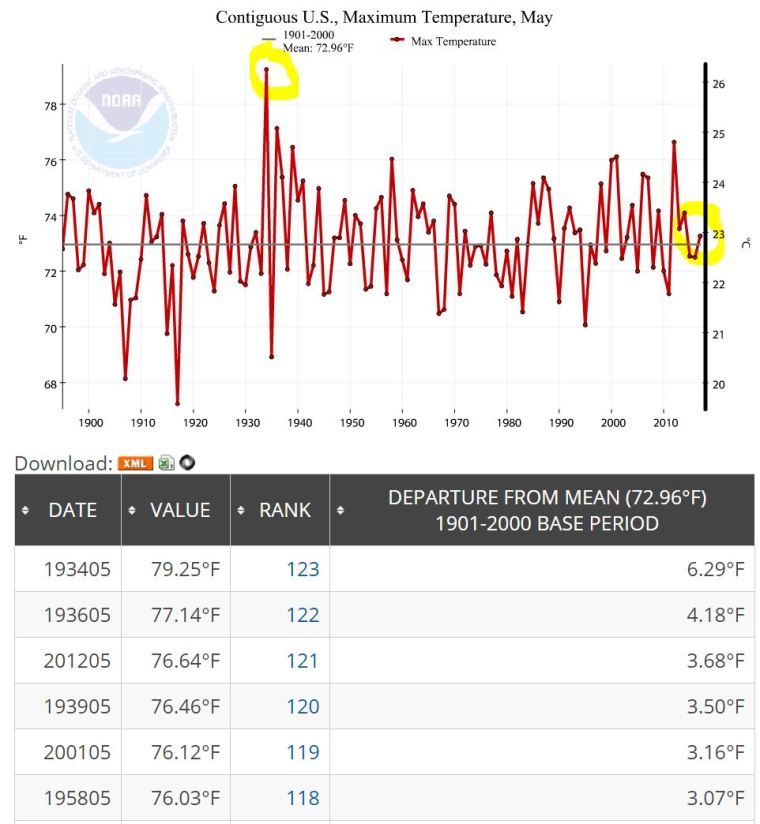
According to the NOAA May 2017 Tmax was ranked 70th out of 123 May’s (123 = warmest , 1 = coldest) .
It was only .31F above the 1901-2000 average.
The top 2 were 1934 and 1936. 1934 was 6.29F above the mean.
According to the NOAA May 2017 Tmax was ranked 70th out of 123 May’s (123 = warmest , 1 = coldest) .
It was only .31F above the 1901-2000 average.
The top 2 were 1934 and 1936. 1934 was 6.29F above the mean.
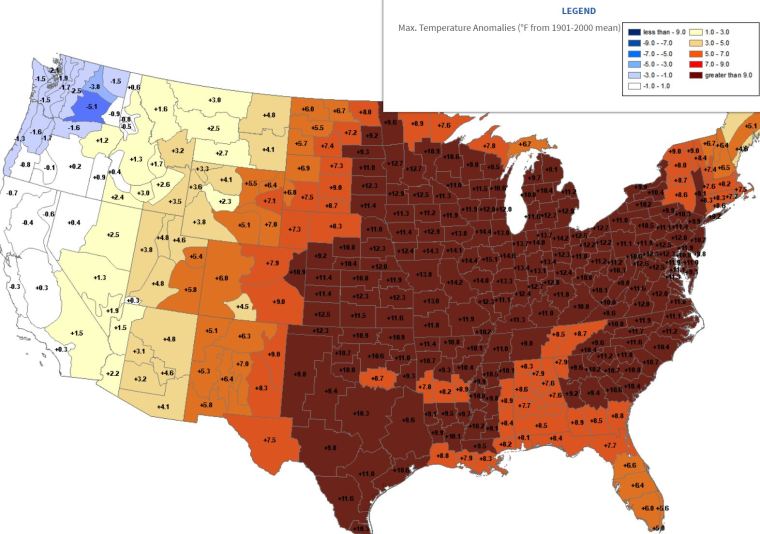
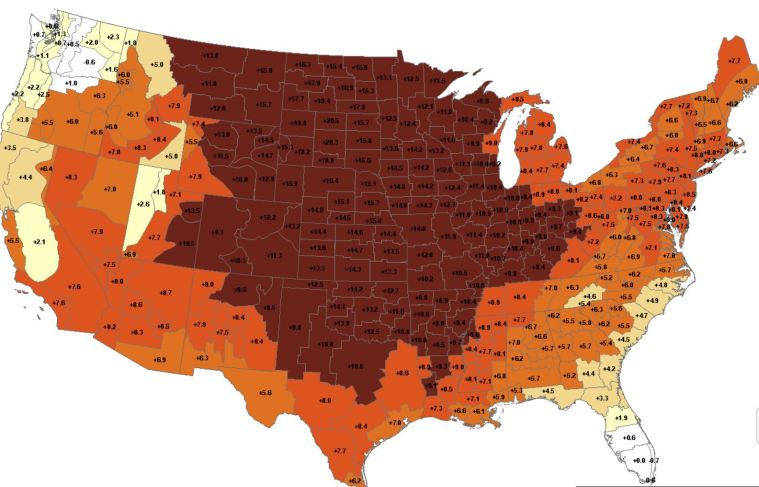
February 2017 was 2nd warmest Tmax. 1954 is still the record holder.

2017 Map of Tmax anomalies
1954 Map of Tmax anomalies
A follow up to my post The Crops Won’t Survive The Summer Heat
No lack of rain. Where is that predicted drought?
Corn and Soybean Belt – Annual Precipitation

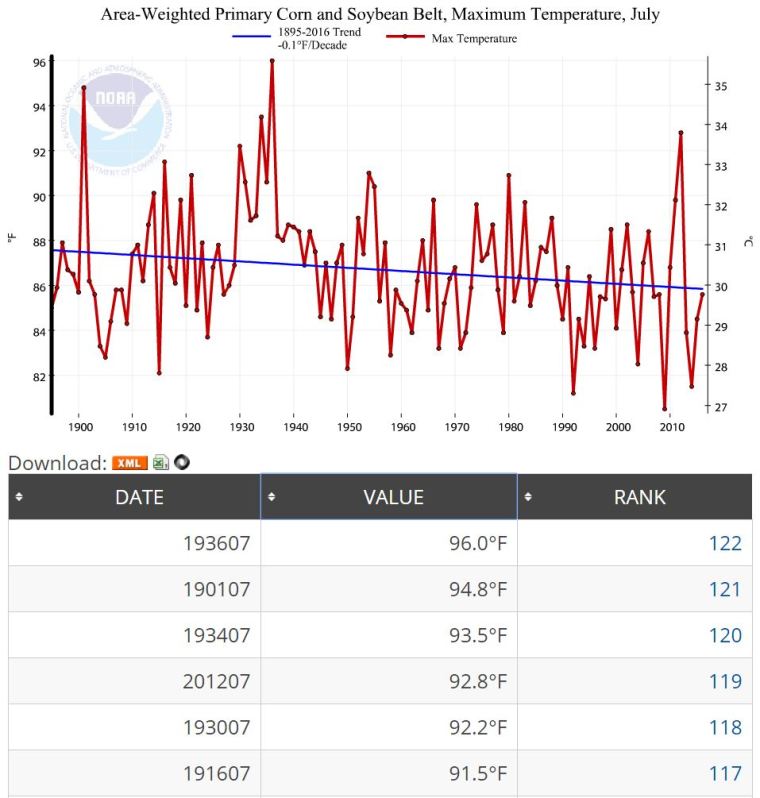
Corn and Soybean Belt – July Maximum Temperature (Updated with Trend)
1936 was hottest. 2009 was coldest. 1936 was 15.5F hotter than 2009.
According to the NOAA, October 2016 Tmax in the USA was 117th warmest out of 122. 122 wast warmest.
1963 was warmest. 1947, 1950, 1953 and 1938 were also warmer than 2016.
(I publish Tmax instead of Tavg because I believe much of the US warming is UHI making the evenings warmer which shows up in the Tmin)

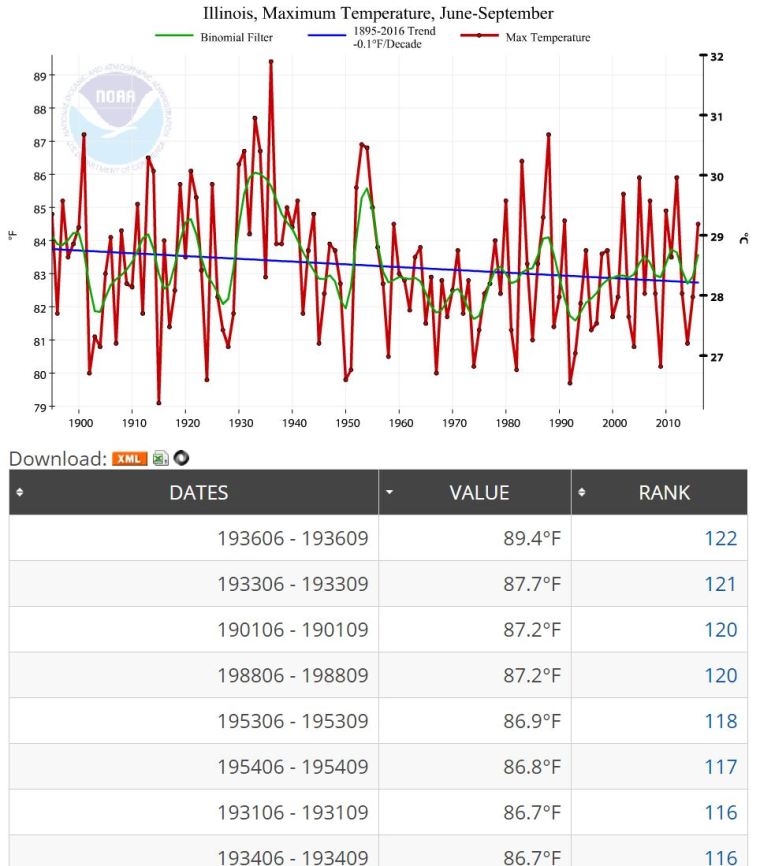
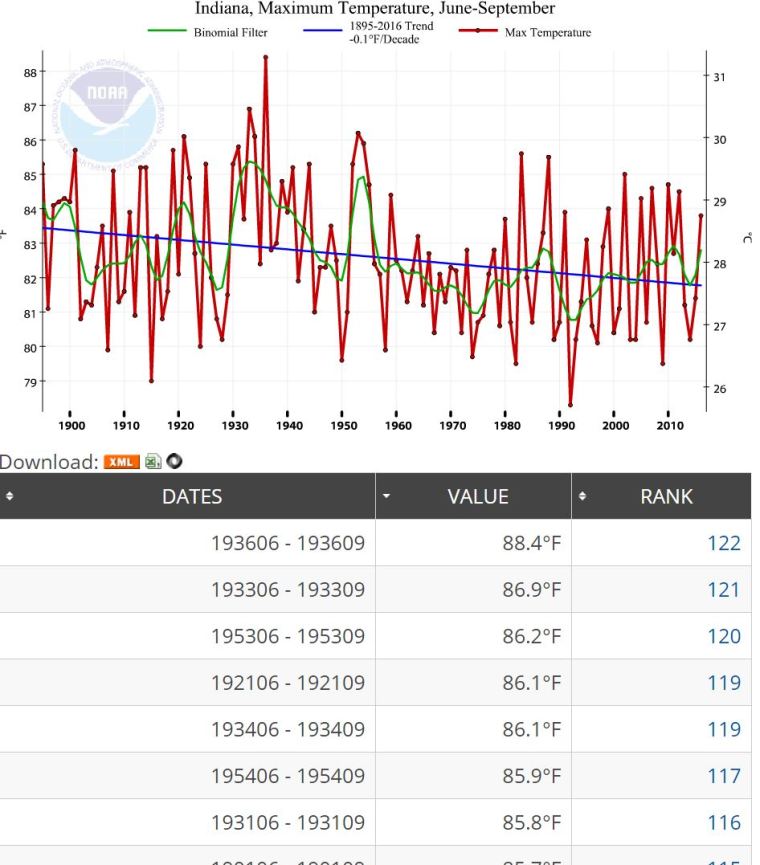
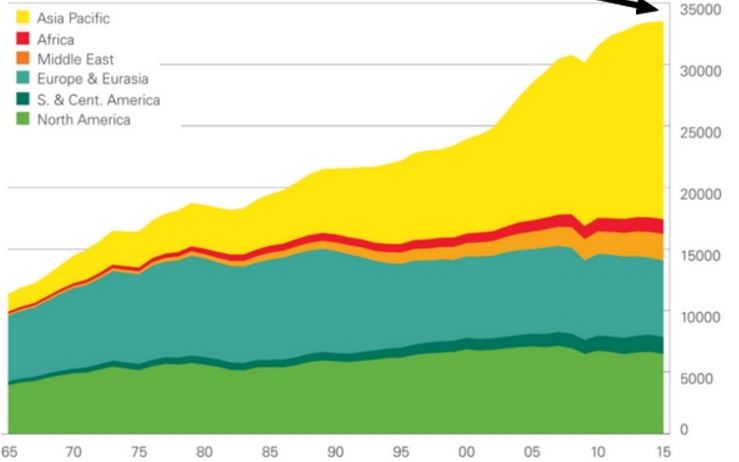
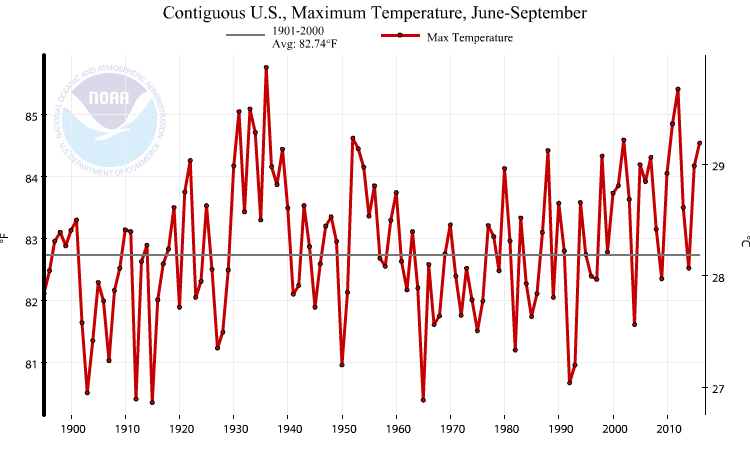
I did a post comparing CO2 to Jun-Sep Maximum temperatures using NOAA data here.
I picked maximum because the AGW cult predicts killer heat waves in the summer.
Today I randomly looked at Iowa. Wow. Why has CO2 foresaken Iowa?
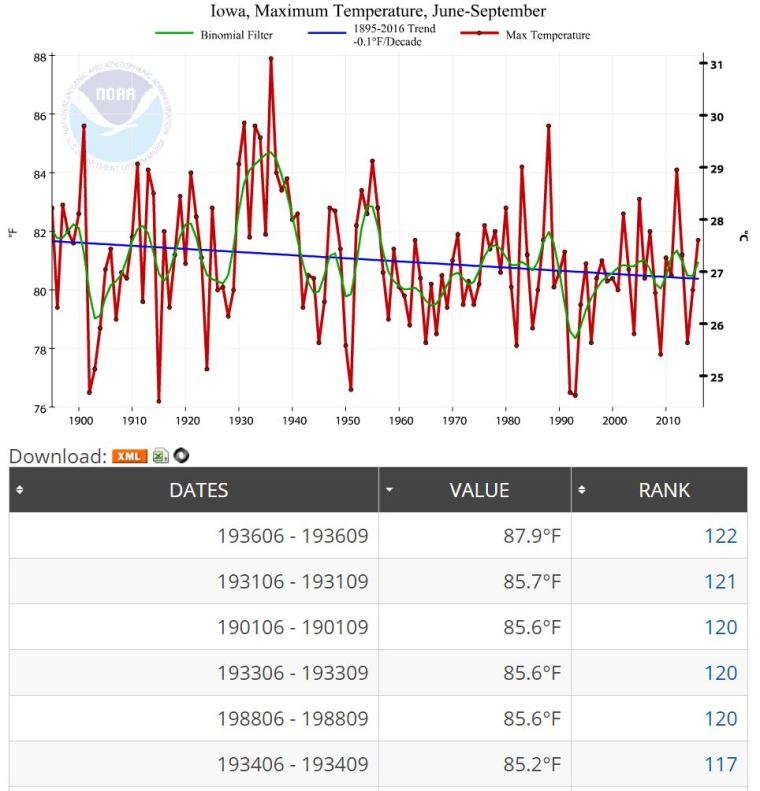
Despite a tripling of manmade CO2 since 1965, “summer” max temps in USA still are lower than 1936.
h/t NoTricksZone
According to the NOAA, September 2016 Tmax in the USA was only 100th warmest out of 122.
1998 was warmest. But 1922 was 2nd and 1953 3rd.
I think CO2 has forsaken September.
1 was warmest with 1936 and 1937 a very close 2nd and 3rd.
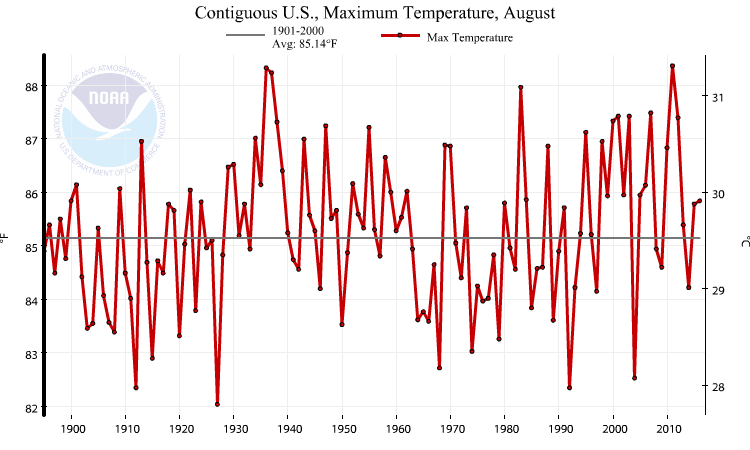
According to the NOAA, August 2016 Tmax in the USA was only 85th warmest out of 122.
2011 was warmest with 1936 and 1937 a very close 2nd and 3rd.