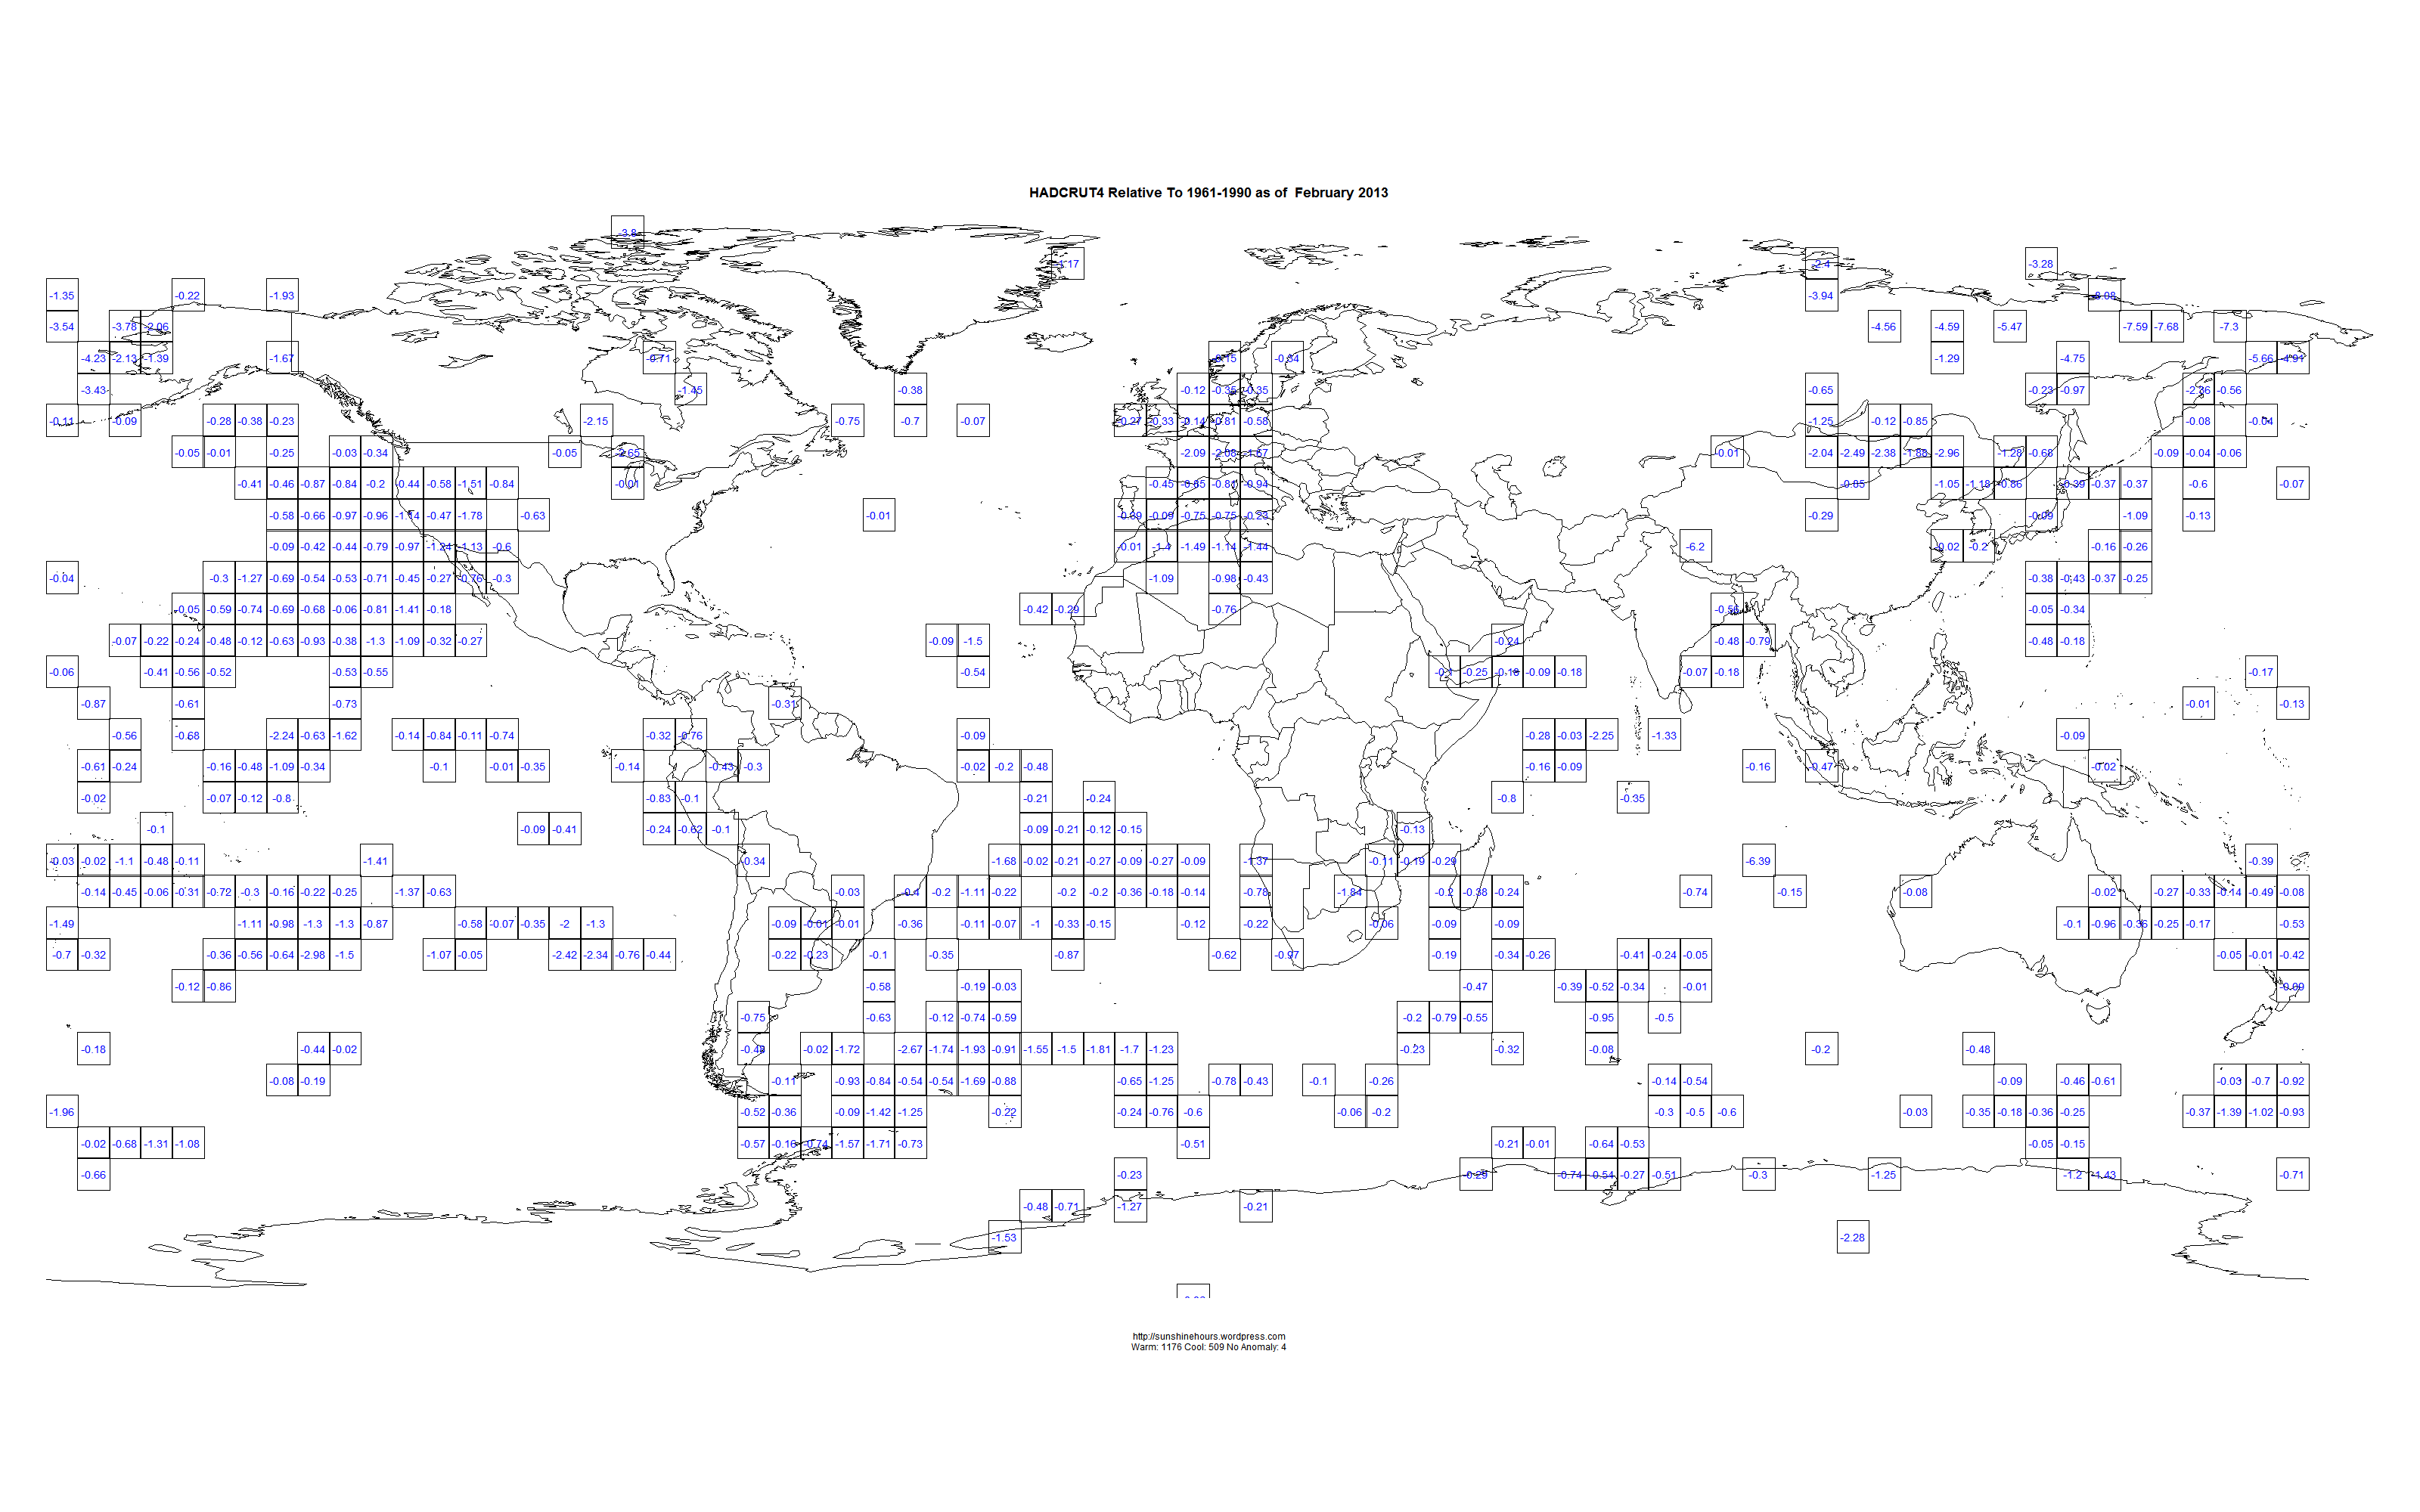
Using HADCRUT4 Gridded data for Feb 2013 , I thought it would be useful to map the 5×5 grid squares colder than 1961-1990.
For some strange reason HADCRUT4 uses the archaic 1961-1990 period as the baseline, rather than the accepted 1981-2010.
Please click on the maps to make them bigger. And make sure you get them to go full size. I made them pretty big (3200 x 2000 pixels).
The number in the boxes is the temperature difference between the 1961-90 average and Feb 2013.
Notice that most of Western Europe was colder than 1961-1990!!!!!!!
Why only the cold squares? Because the HADCRUT4 page colr choices tends to minimize the cold areas. And because I can.