GWPF is Having a Contest To Guess 2019’s Temperature

GWPF is having a contest to guess 2019’s Temperature.

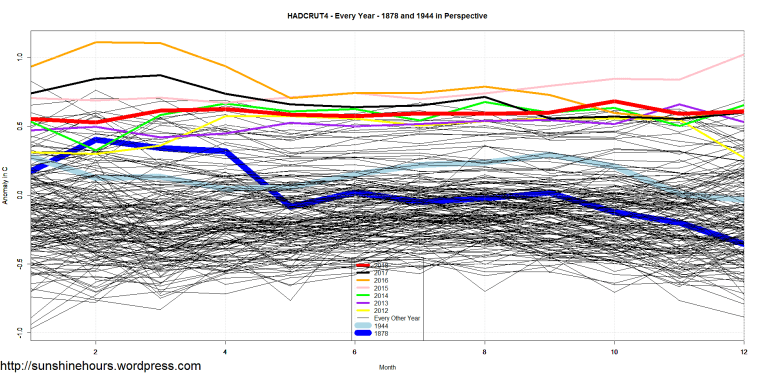
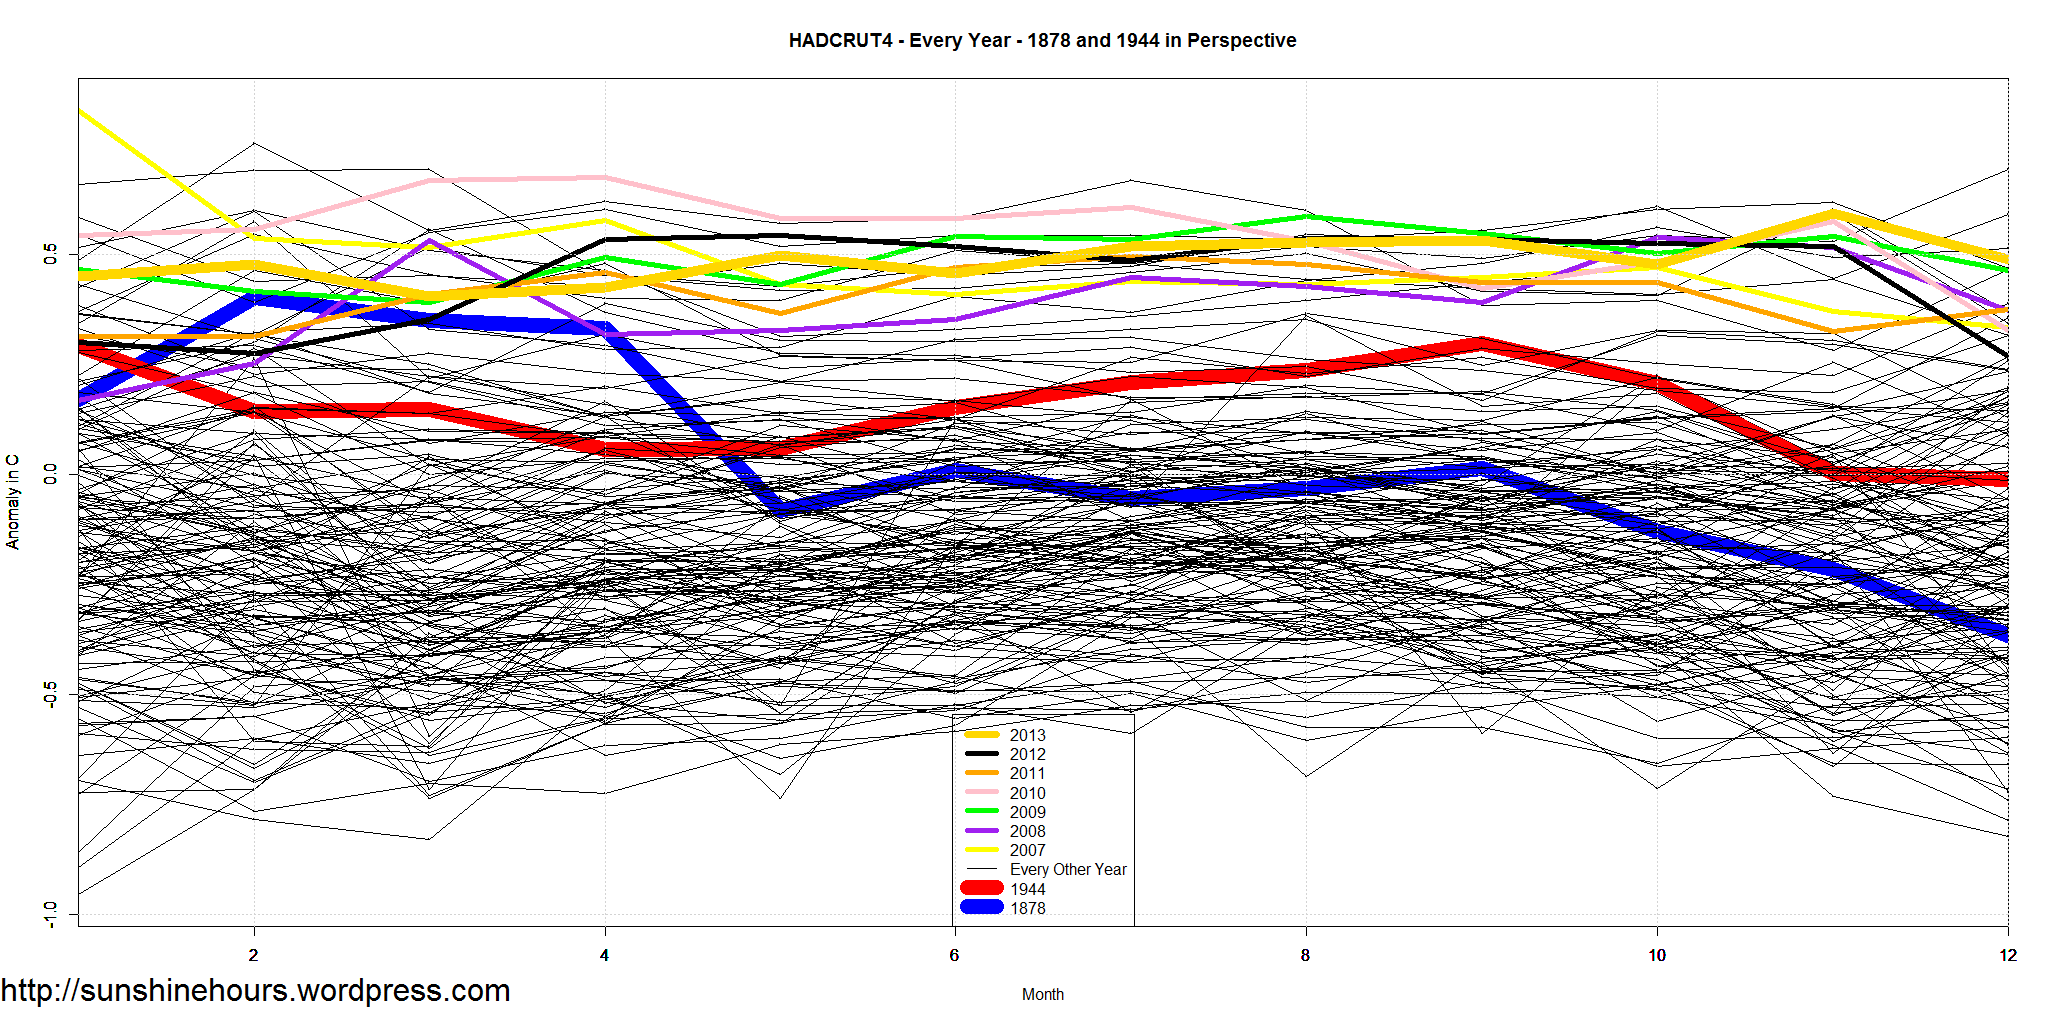
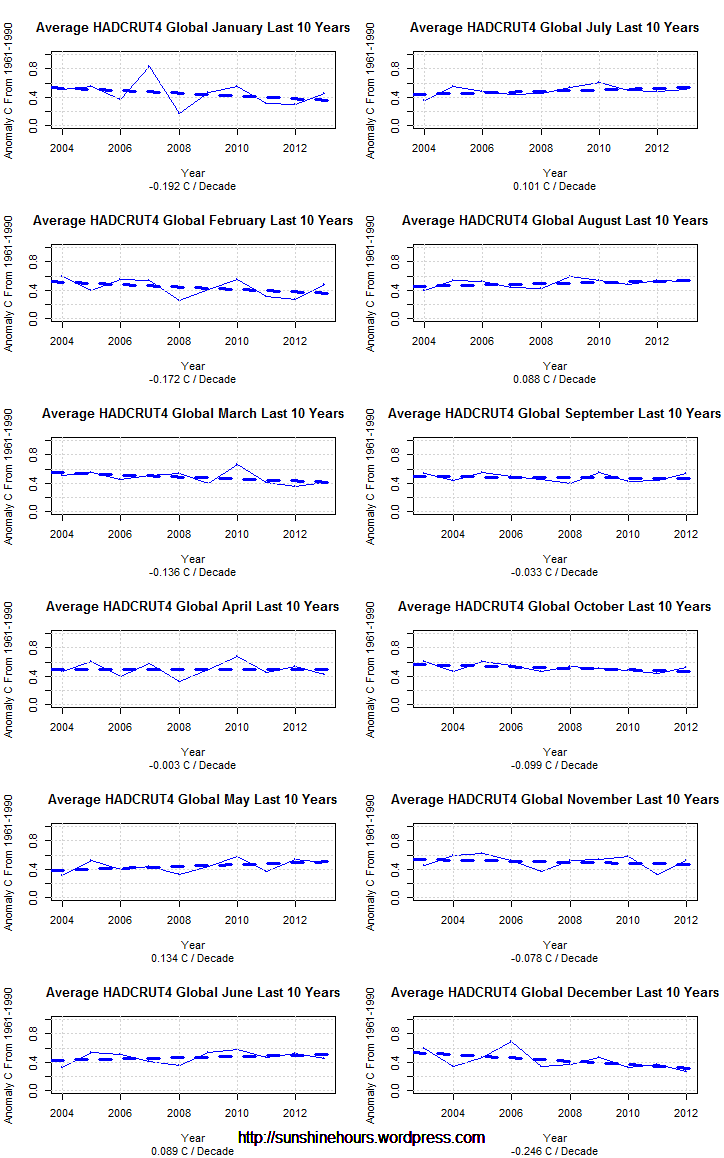
My chart of HADCRUT temperatures is below. Note how close Feb 2018 came to Feb 1878! .403 to .528

With GWPF readers having trounced the Met Office at predicting temperatures for 2018, it will very interesting to see if you can do just as well for 2019.

So we hereby announce the 2019 HadCRUT temperature prediction competition. Once again, the opportunity is there to win some magnificent prizes: more whisky, and your choice of a book from the growing range of GWPF titles.

Of course the real prize on offer is to do better than the boys in Exeter. The Met Office are again being very aggressive on the warming front. They are predicting a 0.19°C warming next year (!), plus or minus 0.12°C. So their predicted range is 0.67-0.91°C.

So will carbon dioxide sweep all before it as they think? Will temperatures creep back further, shoot back up again, or will they keep sliding away? Will El Nino kick in, or will La Nina dominate?  Your guess is probably as good as mine, but – if experience is anything to go by – probably better than the Met Office’s.

To enter, simply fill in the form below. Please make sure to enter just a single number representing the HadCRUT4 global average for 2019, in anomaly format, to two decimal places. The current value is 0.60. In the event of a draw, the judges will pull a name out of a hat.

HADCRUT4 February 2014 – Global Warming?

HadCRUT4 is a gridded dataset of global historical surface temperature anomalies relative to a 1961-1990 reference period.


HADCRUT4 Feb 1878 0.403C

HADCRUT4 Feb 2014 0.299C


http://www.cru.uea.ac.uk/cru/data/temperature/HadCRUT4-gl.dat


Global Warming?


What Would 2C of Warming By 2036 Look Like?

Michael Mann: “our planet would cross the dangerous warming threshold of two degrees C in 2036, only 22 years from now. ” (h/t Jeff Id)

Using HADCRUT4 and WoodForTrees I graphed the data from 1850 t0 2014, and then added in 2C of warming by 2036.

What a joke.

Update: The biggest rise over 22 years was March 1976 to February 1998 = 1.193C. The 4th biggest was March 1856 to February 1878 = 0.913C.

What_Would_It_Take_2Cpng

Northern Hemisphere Winter Doom By Latitude Band

Winter temperatures in the Northern Hemisphere are dropping as much as 2.5C / decade over the last 7 years.

Yesterday my post was a look at the northern hemisphere by month over the last 7 years.

Today I am looking at the same time frame, but I am using the gridded HADCRUT4 data for Dec/Jan/Feb only. You will have to click on the image to get the full effect.

There are 7 latitude bands with yellow highlighting. The trend in those is from -.44C/decade to -2.49C/decade. And note the green 0 line. 0 is the 1961-1990 average, Anywhere the graph or trend crosses the green line it is colder than the 1961-1990 average. It was pretty cold in the 60s and 70s.

I wish I didn’t live in the 50th parallel.

Highlighted Dec Jan Feb HADCRUT4 By Latitude Band - Last 7 Years as of 2013-7


HADCRUT4 Northern Hemisphere Winter Doom

Do you live in the Northern Hemisphere.? Did anyone tell you that in the midst of record CO2 levels HADCRUT4 shows massively dropping winter temperatures?

At the bottom of this post is a graph of HADCRUT4 Northern Hemisphere only temperatures for each month for the last 7 years.

Did you know December was cooling at -.9C per decade? By 2100 December could be 8C colder?

Did you know January was cooling at -.73C per decade?

Did you know March was cooling at -.56C per decade?

Did you know February was cooling at -.19C per decade?

Did you know November was cooling at -.2C per decade?

Did you know October was cooling at -.17C per decade?

Did you know April was cooling at -.17C per decade?

I’m glad I have a wood stove.

Average HADCRUT4 Northern  Last 7 Years


HADCRUT4 10 Years By Month = AMO

Over the last 10 years HADCRUT4 has had a slightly negative trend. But the months each have their own trend.

September to April have been cooling, while May – August have been warning, All 12 months with trends are below.

I wonder why CO2 has forsaken the winter months?

The interesting thing is this matches the AMO as you can see in the post I did in January. (I would do a new post but the US shutdown has shutdown the page I got the AMO data from).

When the AMO finishes going negative this will be very bad news for the CO2/Warmist Cult.. And even worse news for the world’s agriculture.

Right now, Dec/Jan/Feb are cooling at -0.17C/decade to -0.25C/decade. Brr.  Germany is already off to the coldest start of winter in 200 years.

Average HADCRUT4 Global  Last 10 Years

1.5C of Warming in 27 years – Mar 1917 to Jan 1944 – Northern Hemisphere

1.5C of Warming in 27 years – Mar 1917 to Jan 1944 – Northern Hemisphere (data here)

Jan 1944 Northern Hemisphere Anomaly = 0.656

Jan 2013 Northern Hemisphere Anomaly = 0.545

It was .111C warmer in Jan 1944 than Jan 2013 in the Northern Hemisphere.

Why does the AGW cult ignore this?

HADCRUT4 Northern - 1917 Jan To 1944 Dec


HADCRUT4 – The Greatest 30 Year Temperature Rises

In a previous post I noted the largest one month rise for HADCRUT4 was in 1862/1863. AGW cult members are always talking about climate being 30 years.

So lets look at the greatest temperature rise in HADCRUT4 where the period is anywhere from 1 month to 360 months (30 years).

The winner at 1.296C was Jan 1864 to Feb 1878. Here are the top 25.

Months FromMonth FromYear ToMonth ToYear Difference C.
169 Jan 1864 Feb 1878 1.296
205 Jan 1861 Feb 1878 1.262
170 Jan 1864 Mar 1878 1.244
171 Jan 1864 Apr 1878 1.225
182 Dec 1862 Feb 1878 1.225
206 Jan 1861 Mar 1878 1.21
263 Mar 1976 Feb 1998 1.193
207 Jan 1861 Apr 1878 1.191
341 Mar 1917 Aug 1945 1.191
183 Dec 1862 Mar 1878 1.173
288 Feb 1974 Feb 1998 1.166
61 Jan 1864 Feb 1869 1.158
184 Dec 1862 Apr 1878 1.154
342 Feb 1917 Aug 1945 1.145
206 Dec 1860 Feb 1878 1.143
201 May 1861 Feb 1878 1.139
313 Jan 1972 Feb 1998 1.138
183 Nov 1862 Feb 1878 1.134
312 Mar 1976 Mar 2002 1.132
335 Mar 1850 Feb 1878 1.131
289 Jan 1974 Feb 1998 1.13
311 Mar 1976 Feb 2002 1.13
121 Jan 1868 Feb 1878 1.129
330 Mar 1917 Sep 1944 1.127
86 Dec 1870 Feb 1878 1.125