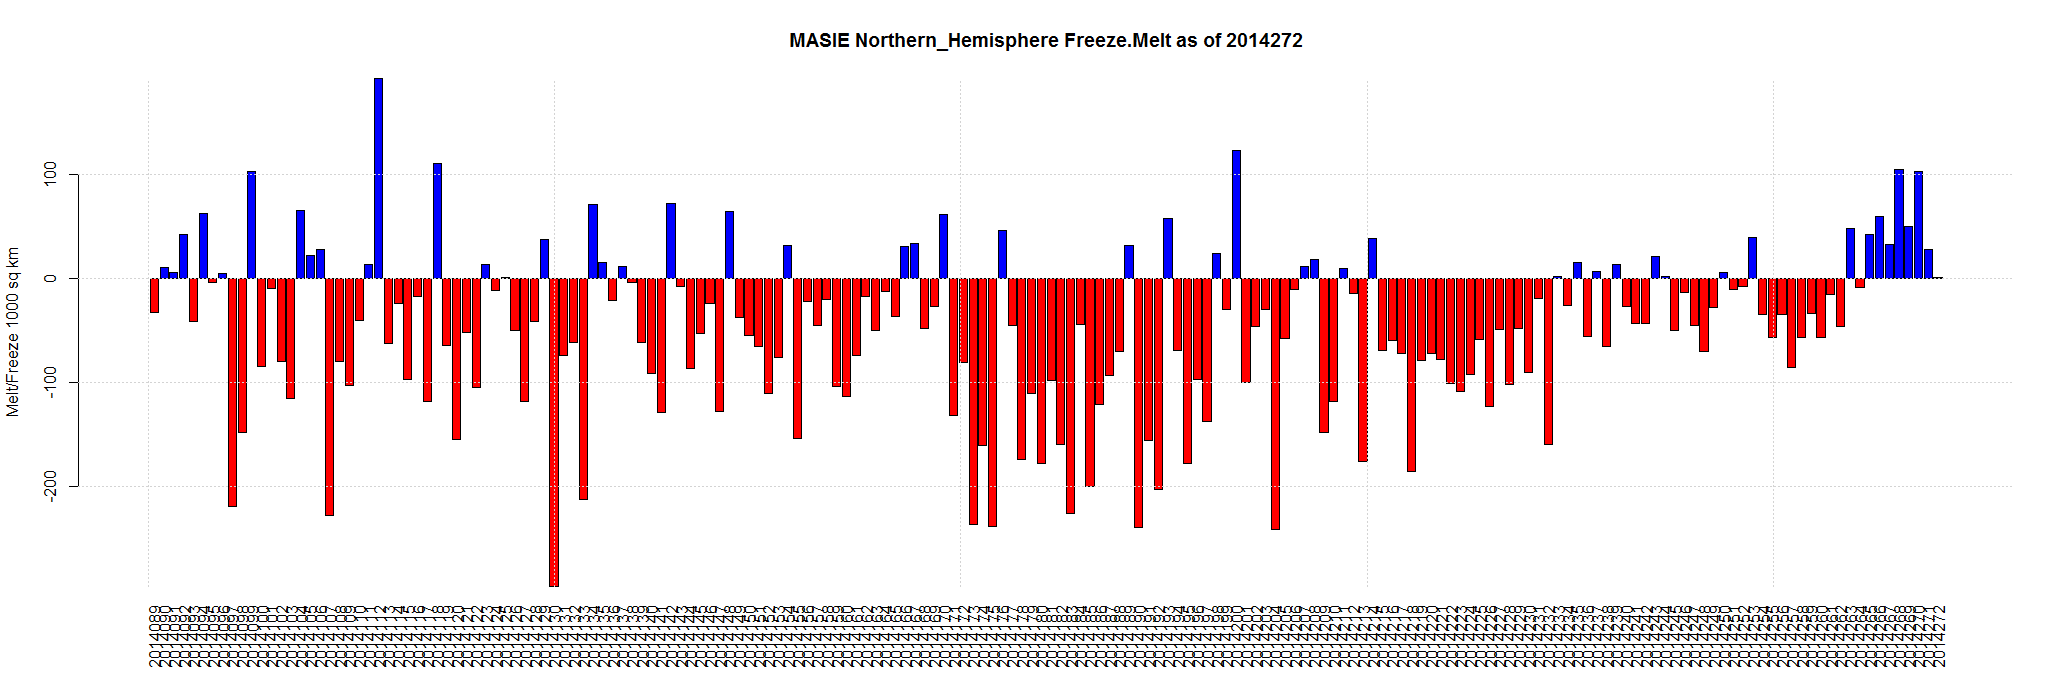
Sept 30 2014 MASIE Update – Half The Arctic Melting / Half Freezing
Data here. Click for bigger.
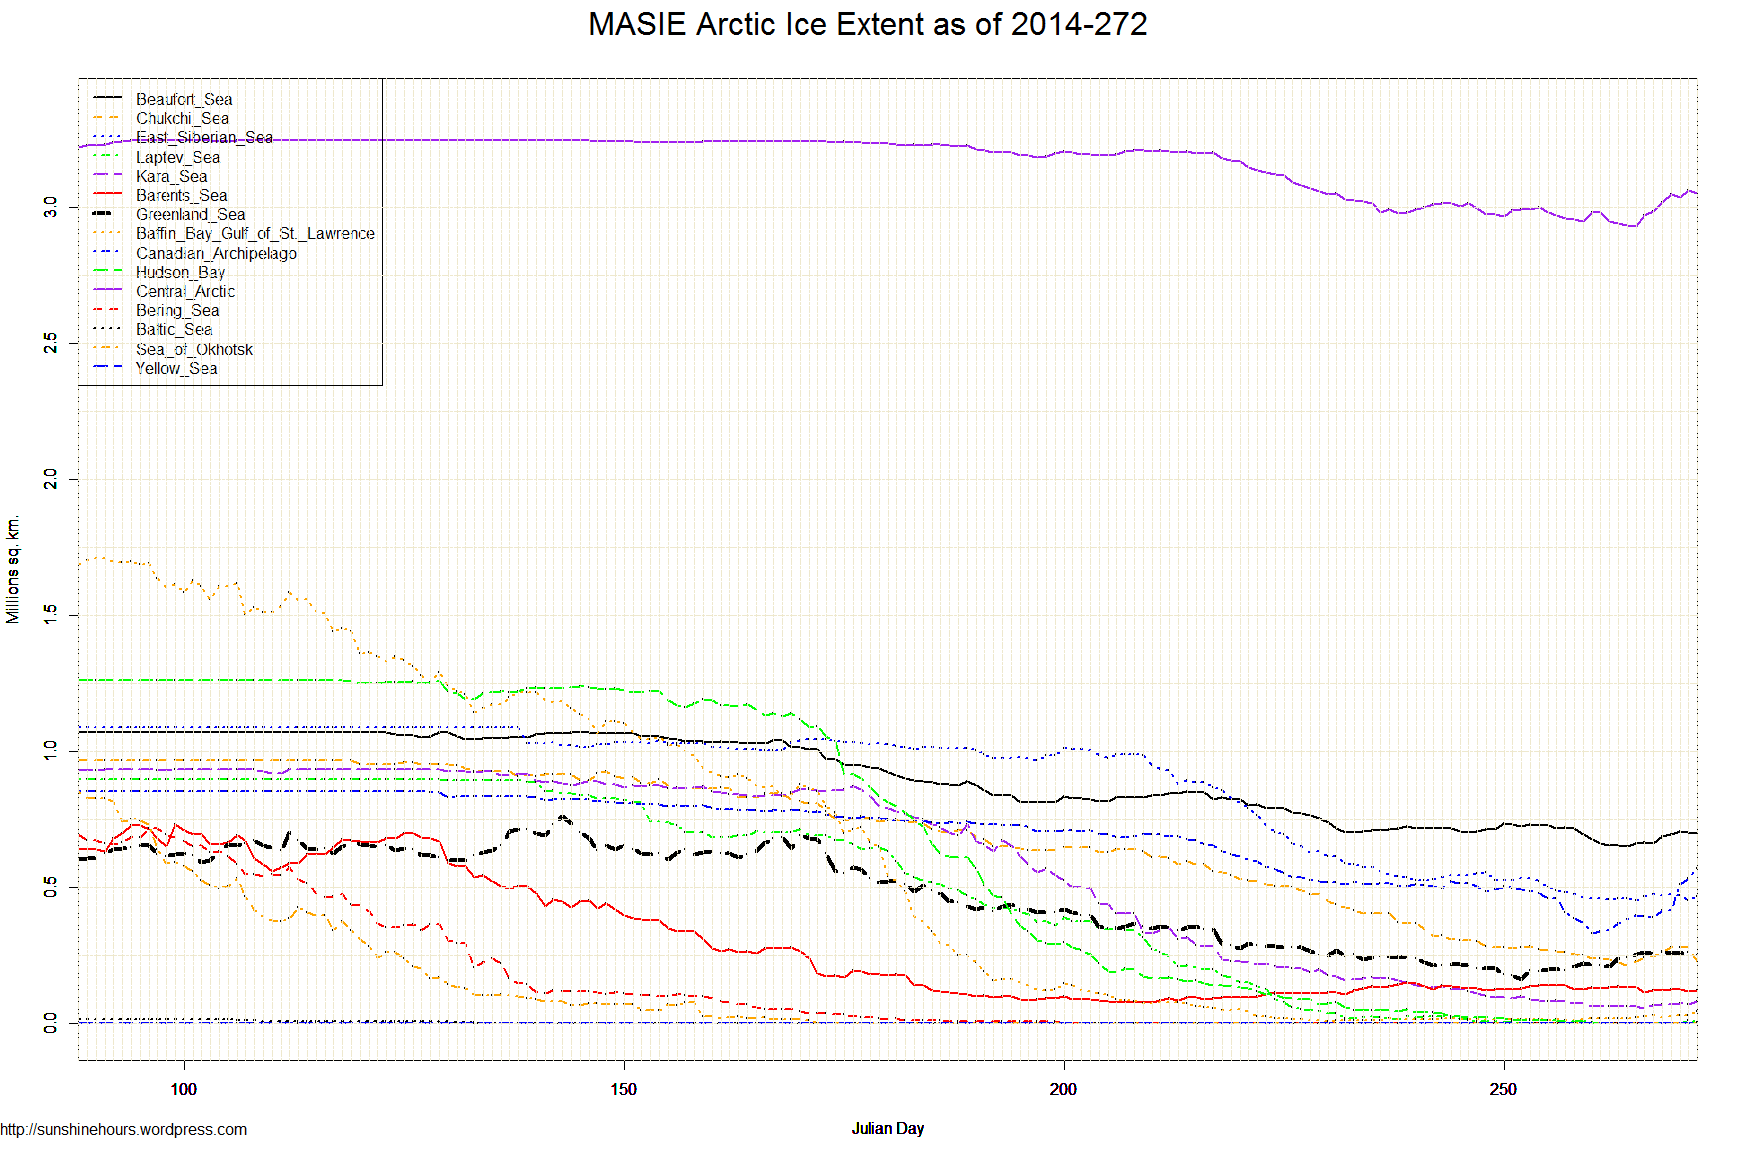
| Region | 185 days ago | End | Last 184 | Last 28 | Last 14 | Last 7 | Last 3 | Last 1 |
| Chukchi Sea | 966,006 | 229,553 | -736,453 | -81,228 | -24,494 | -725 | -49,068 | -51,968 |
| Greenland Sea | 603,416 | 249,302 | -354,113 | 32,603 | 39,438 | -4,411 | -8,022 | -12,015 |
| Central Arctic | 3,221,921 | 3,050,840 | -171,081 | 35,911 | 94,579 | 121,031 | 3,615 | -10,209 |
| Laptev Sea | 897,845 | 4,129 | -893,716 | -19,840 | 3,206 | 3,043 | 2,780 | -7,920 |
| Beaufort Sea | 1,070,445 | 698,366 | -372,079 | -21,054 | -17,426 | 34,380 | 3,574 | -3,348 |
| Bering Sea | 697,324 | 0 | -697,324 | 0 | 0 | 0 | 0 | 0 |
| Baltic Sea | 15,337 | 0 | -15,337 | 0 | 0 | 0 | 0 | 0 |
| Sea of Okhotsk | 853,240 | 0 | -853,240 | 0 | 0 | 0 | 0 | 0 |
| Yellow Sea | 0 | 0 | 0 | 0 | 0 | 0 | 0 | 0 |
| Hudson Bay | 1,260,903 | 4,482 | -1,256,421 | -22,955 | -2,882 | 3,620 | 3,034 | 3,034 |
| Barents Sea | 645,917 | 122,967 | -522,951 | -14,366 | -4,403 | -9,957 | -2,113 | 6,046 |
| Kara Sea | 933,859 | 82,145 | -851,715 | -44,493 | 8,482 | 17,746 | 9,698 | 10,249 |
| East Siberian Sea | 1,087,137 | 469,019 | -618,118 | -75,917 | -4,452 | 16,622 | -5,552 | 14,851 |
| Baffin Bay Gulf of St. Lawrence | 1,688,530 | 46,280 | -1,642,250 | 28,060 | 35,350 | 24,972 | 20,745 | 15,478 |
| Canadian Archipelago | 853,214 | 568,765 | -284,450 | 45,823 | 182,380 | 172,706 | 152,284 | 36,532 |
| Northern Hemisphere (Total) | 14,805,115 | 5,526,989 | -9,278,126 | -137,455 | 309,778 | 379,026 | 130,975 | 730 |
| NH (Average Loss per Day) | -50,152 | -4,909 | 22,127 | 54,147 | 43,658 | 730 |