Nanaimo ‘Extreme’ Weather

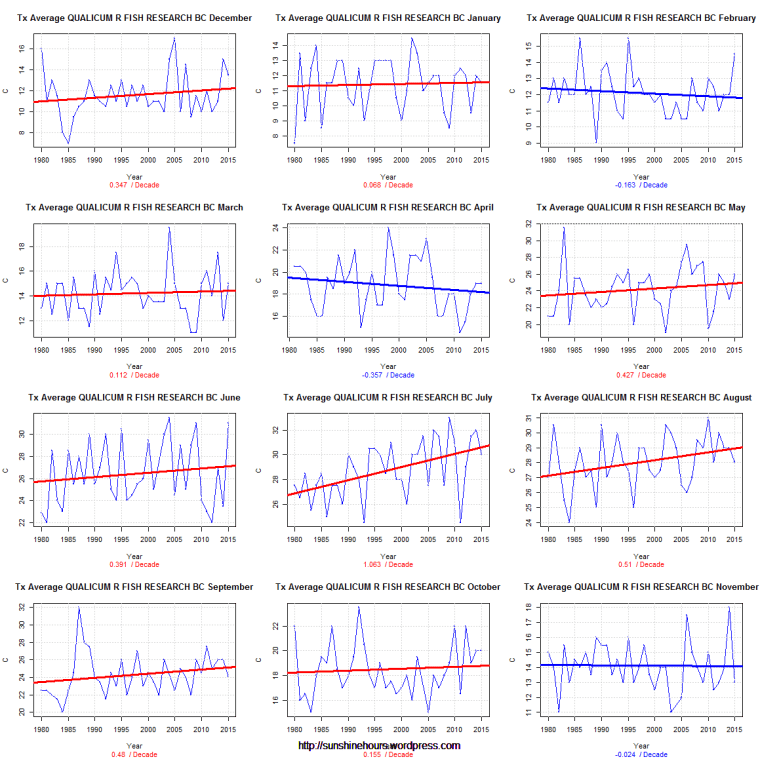
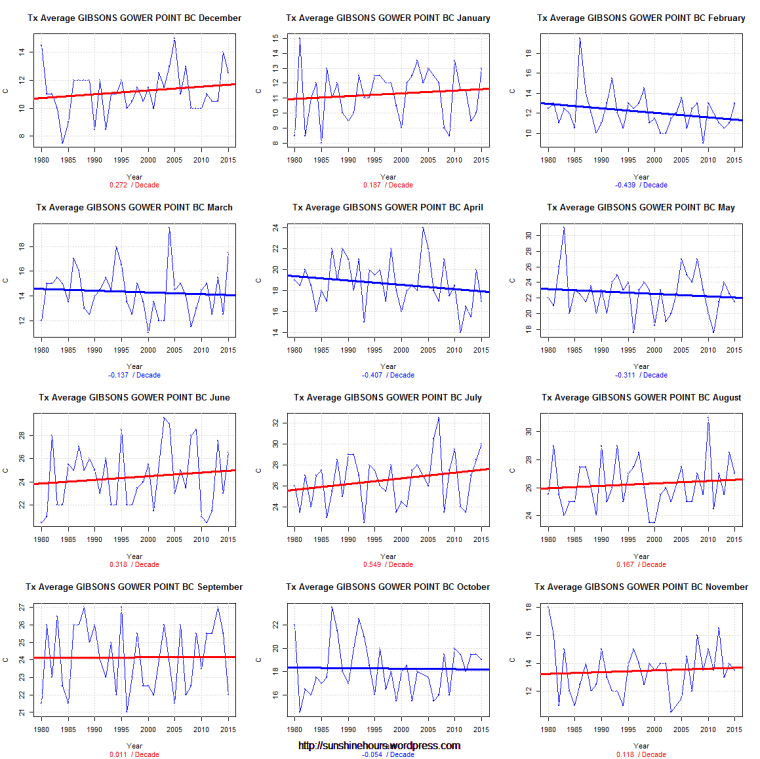
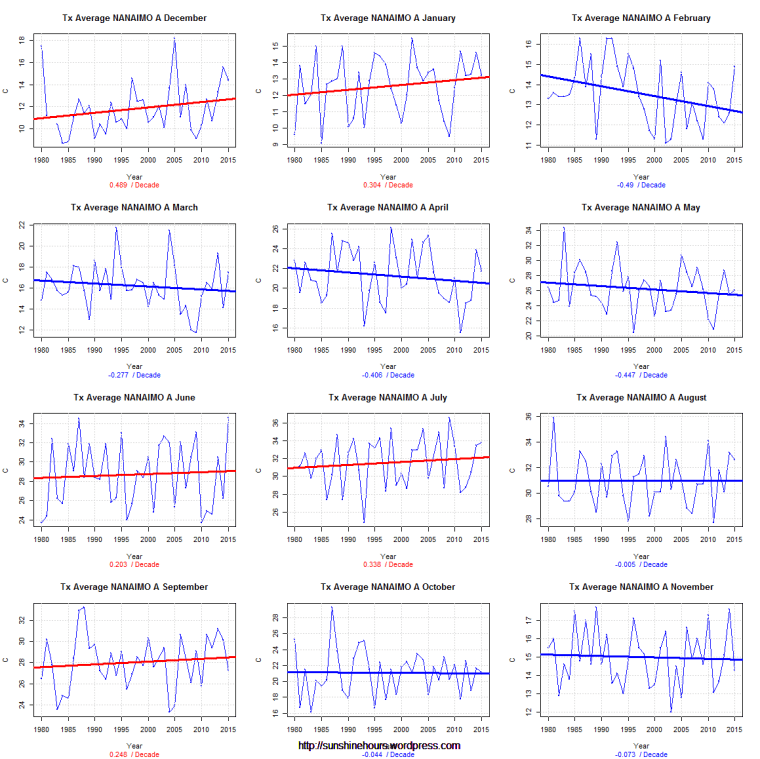
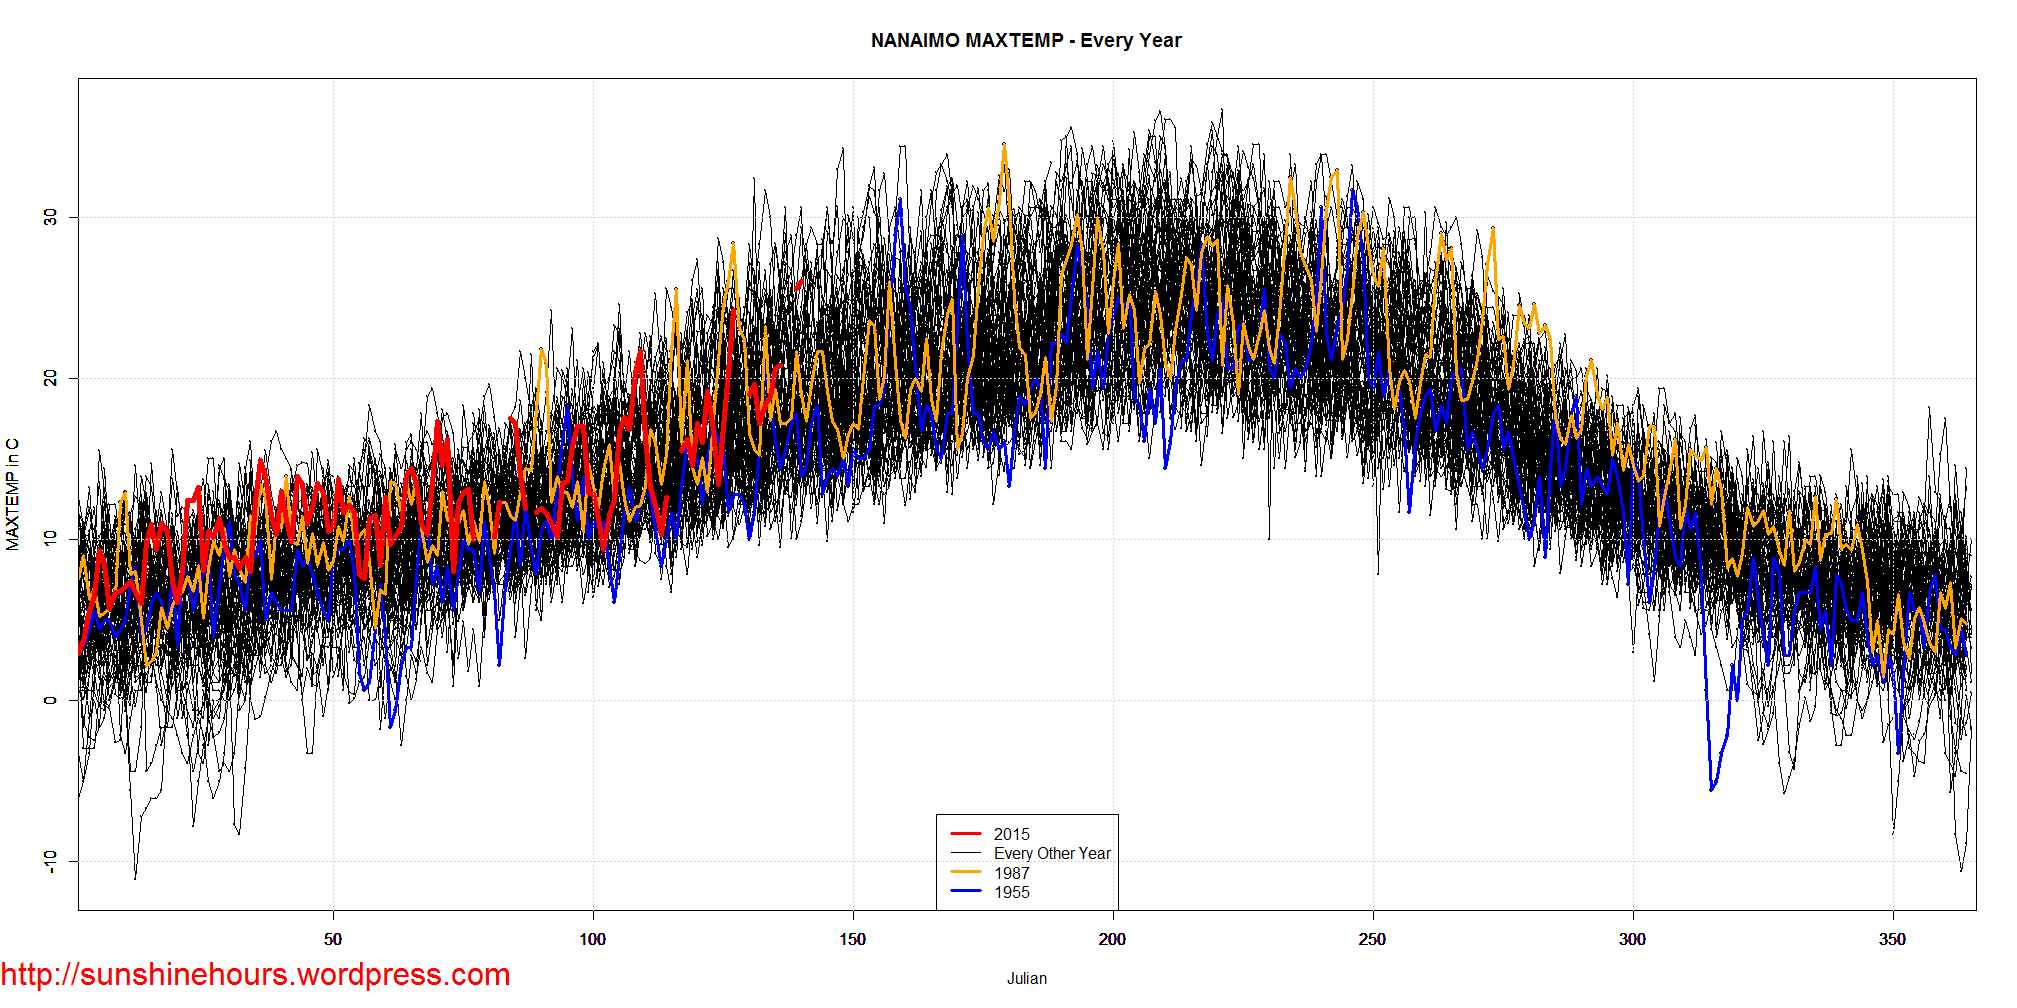
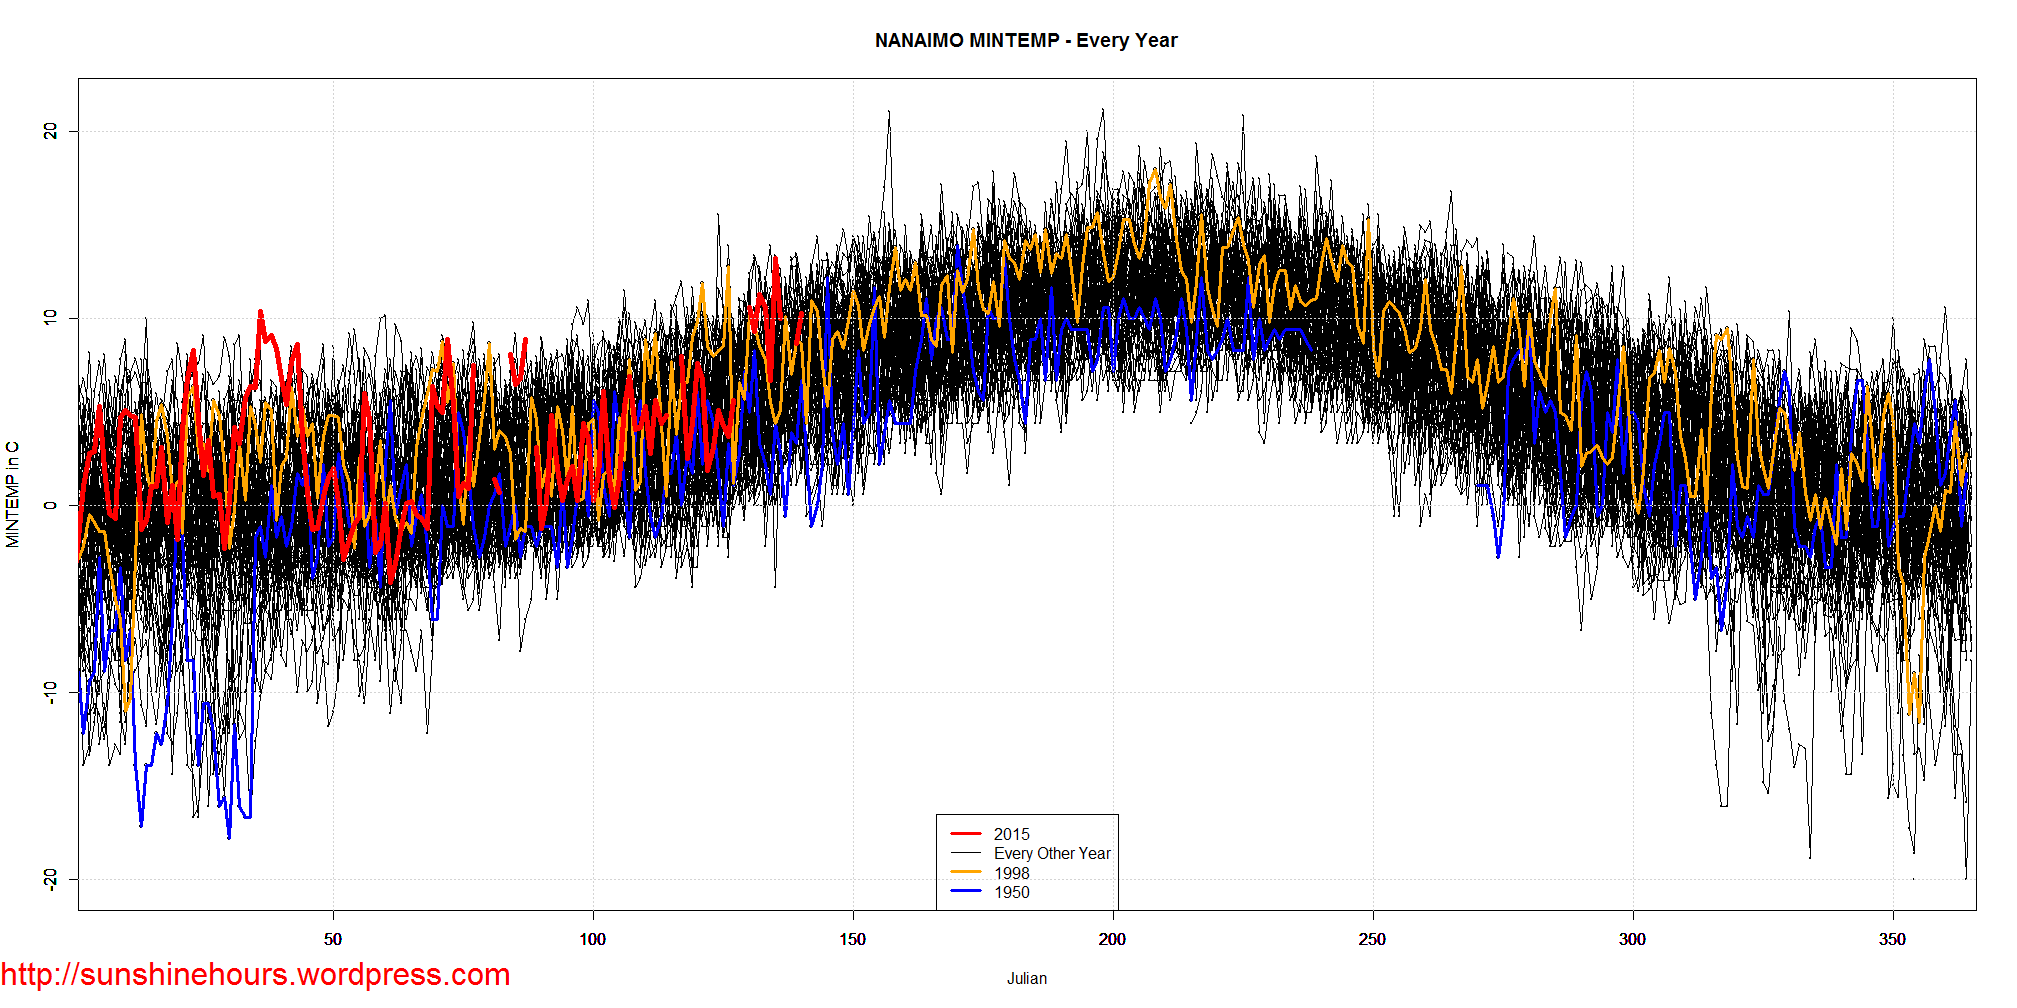
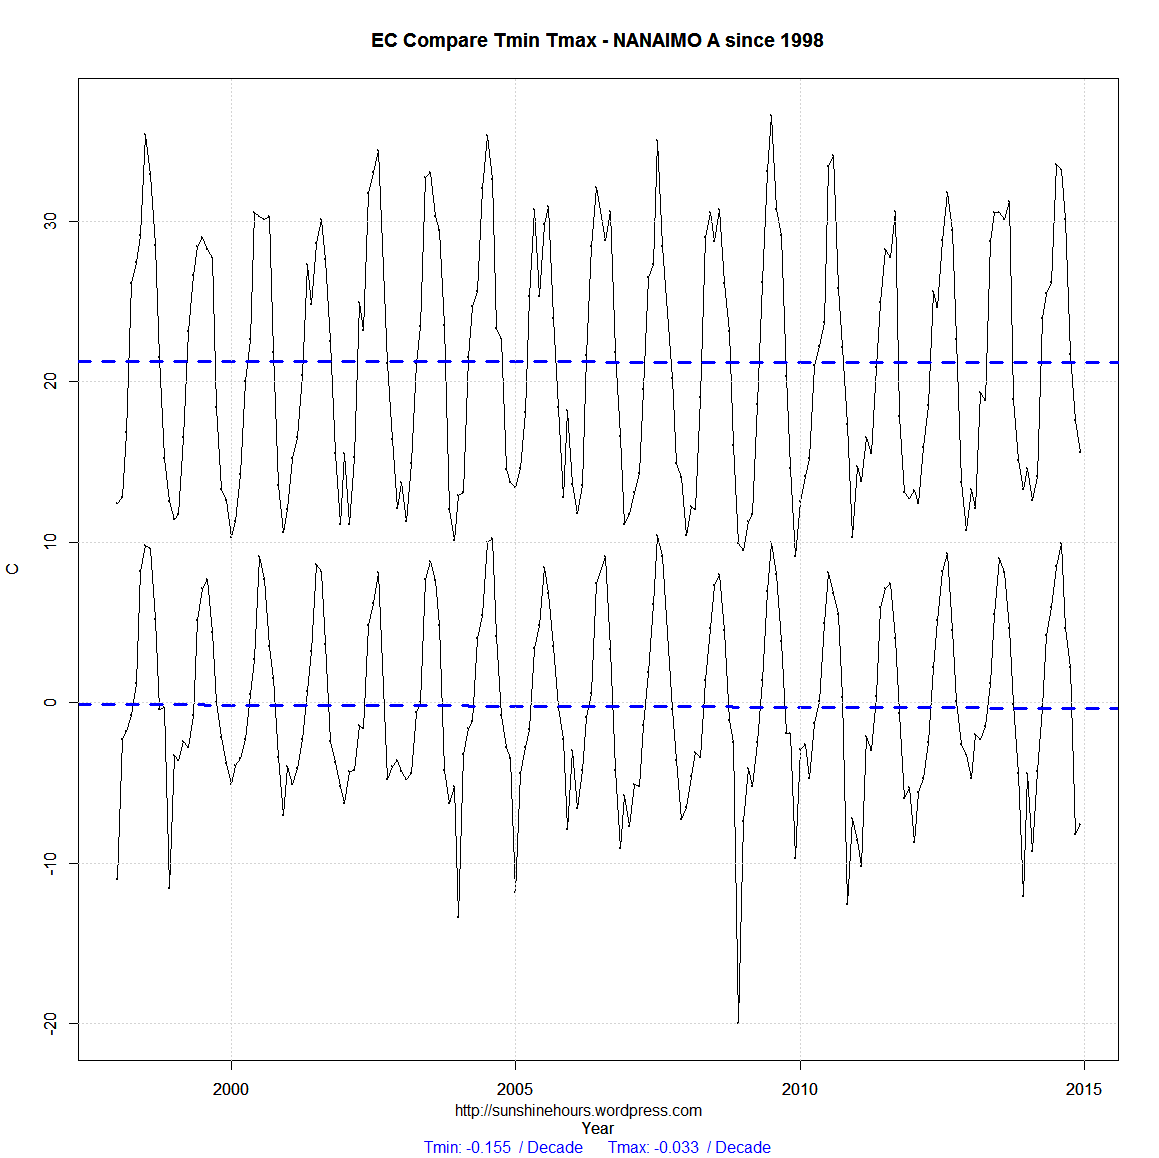
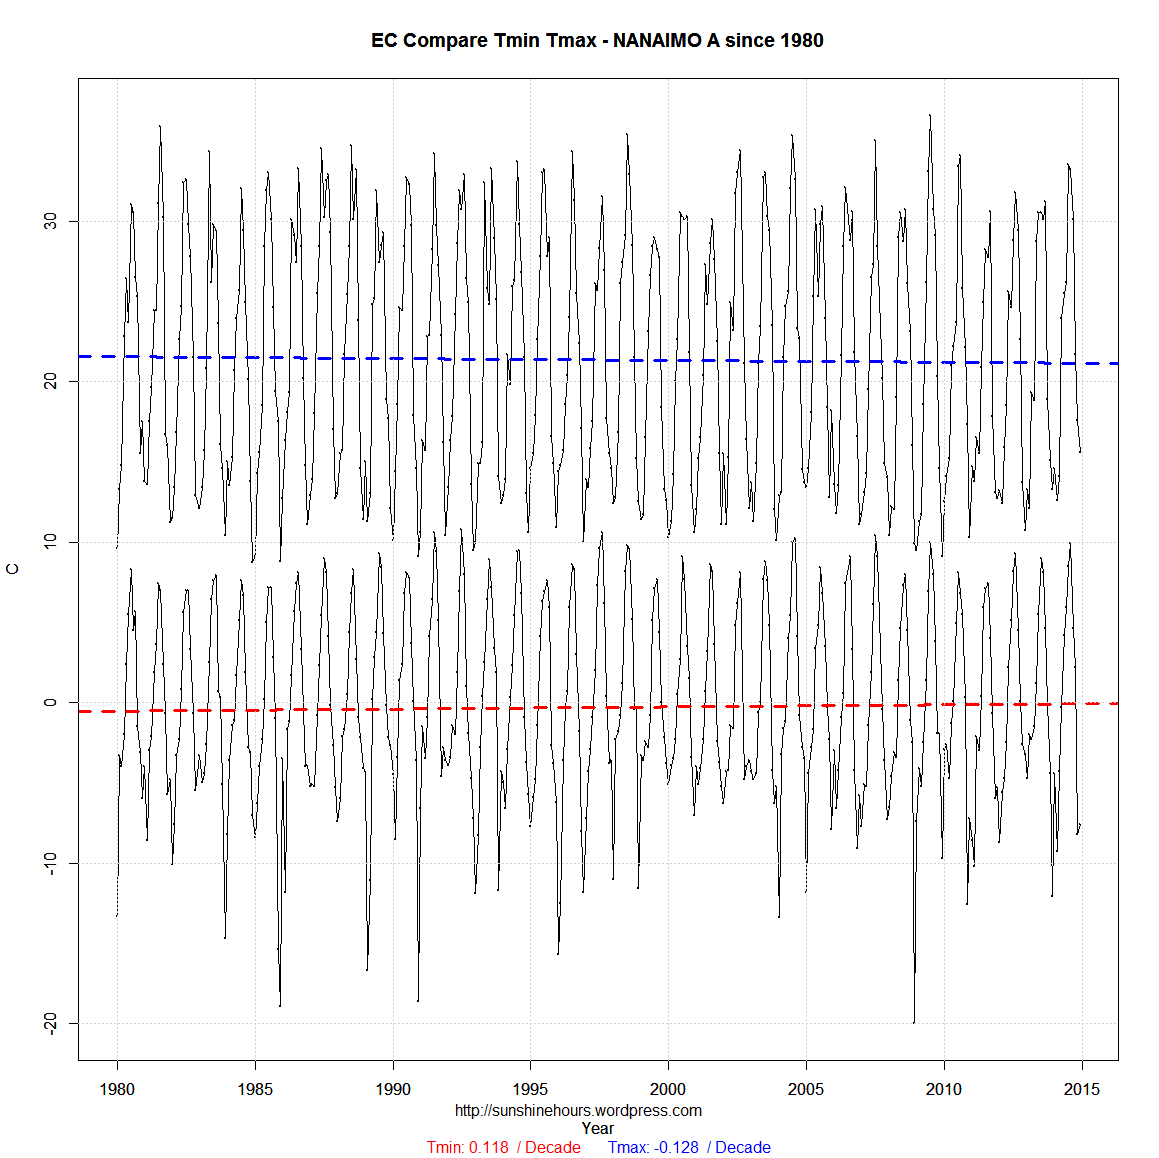
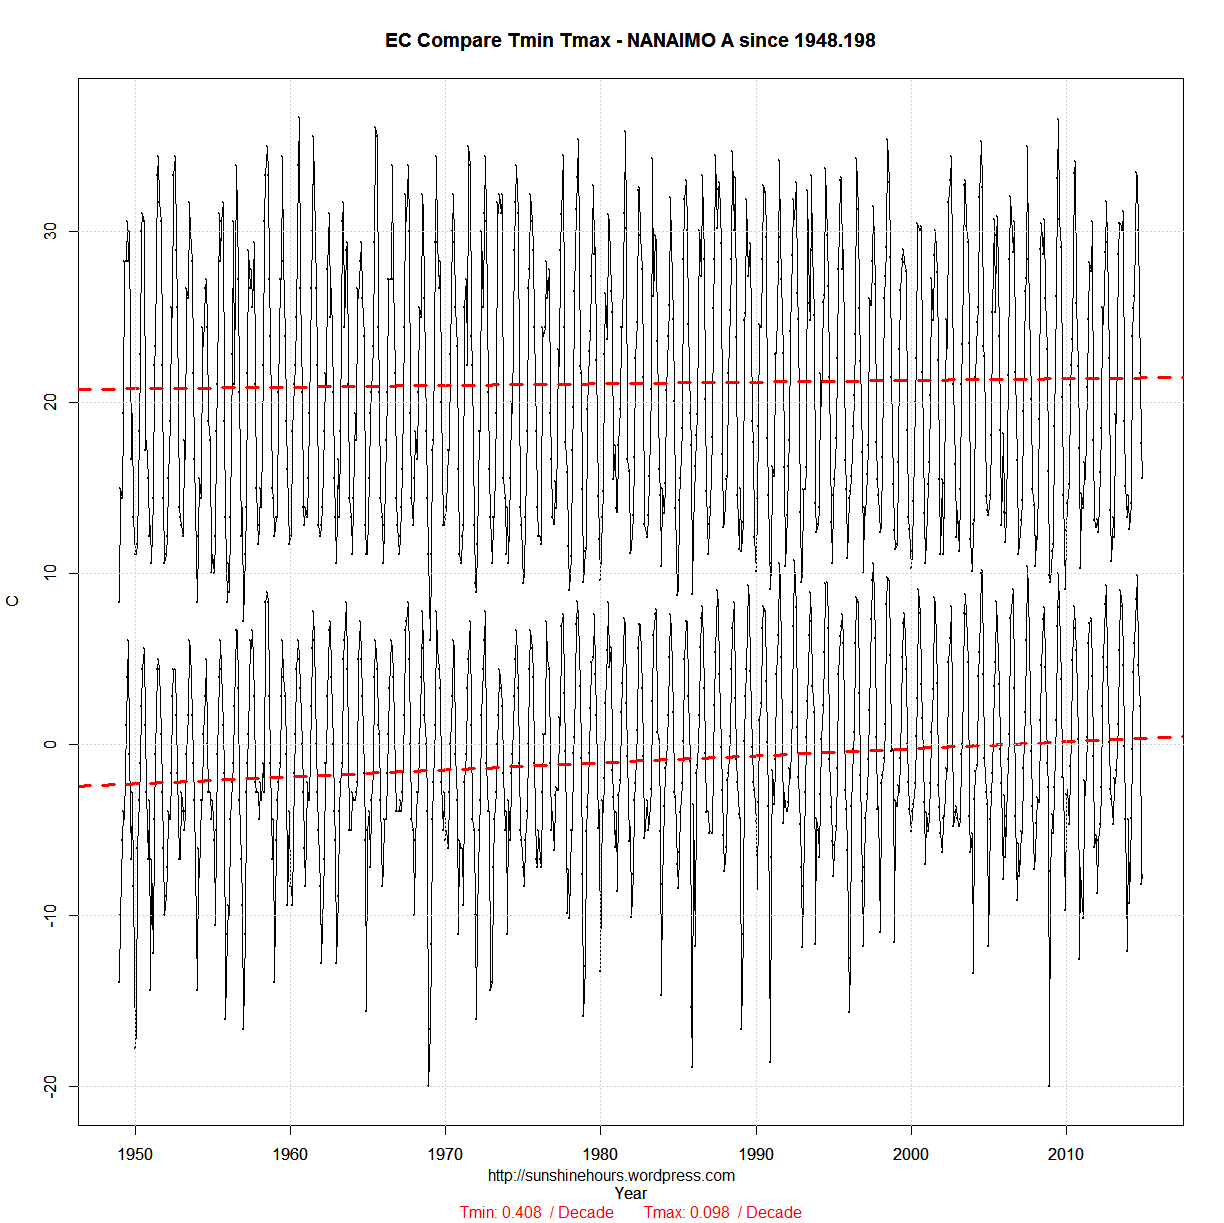
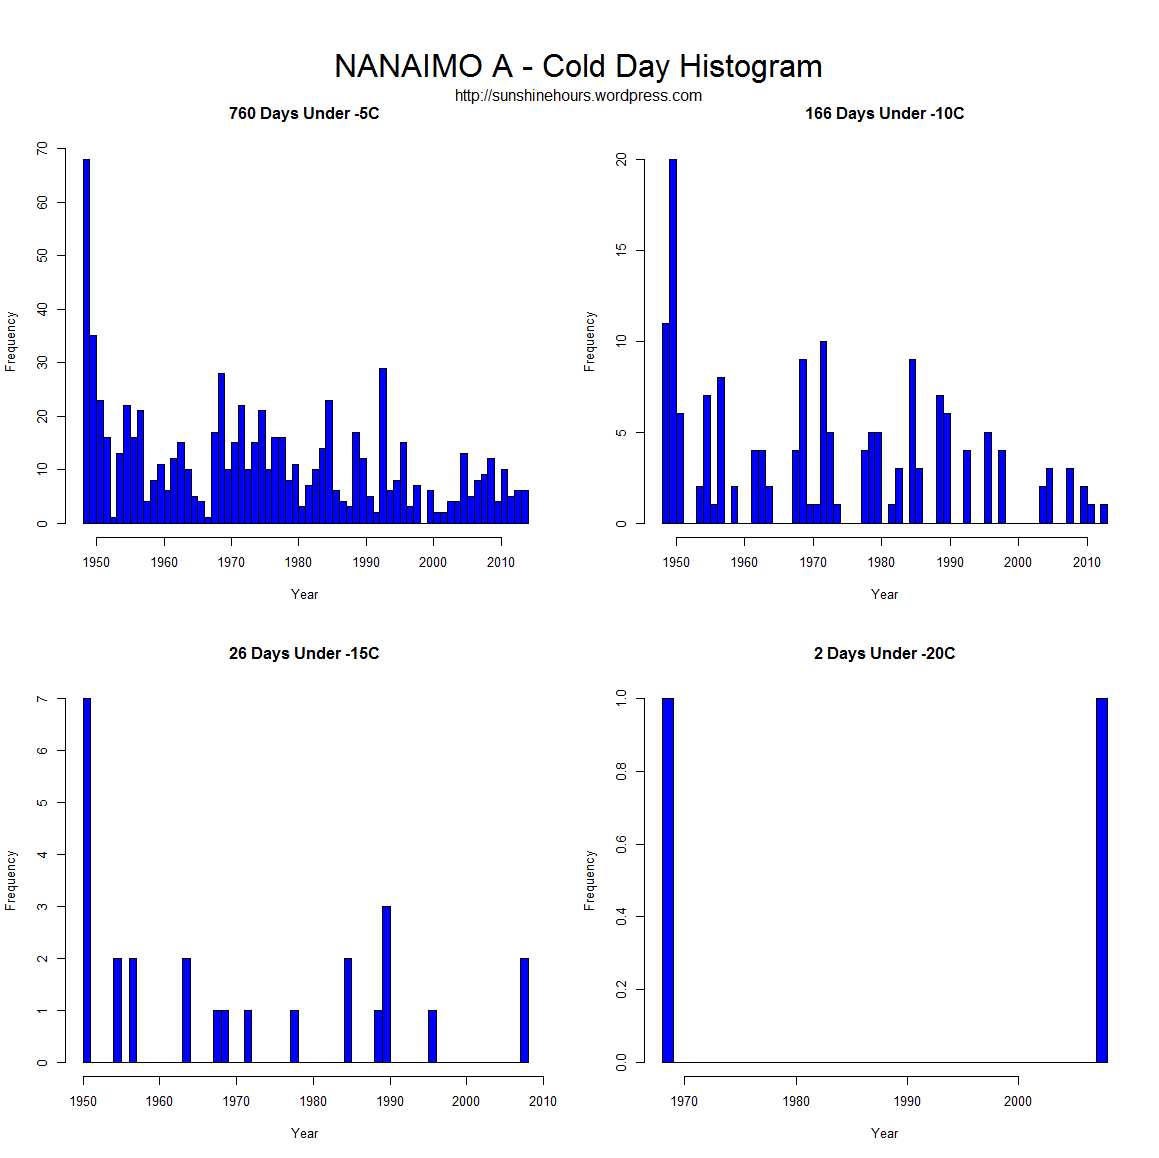
I thought I would look at the year in which daily records for Nanaimo BC (near where I live).

The data starts in 1947 and goes to 2016. You can get data here.

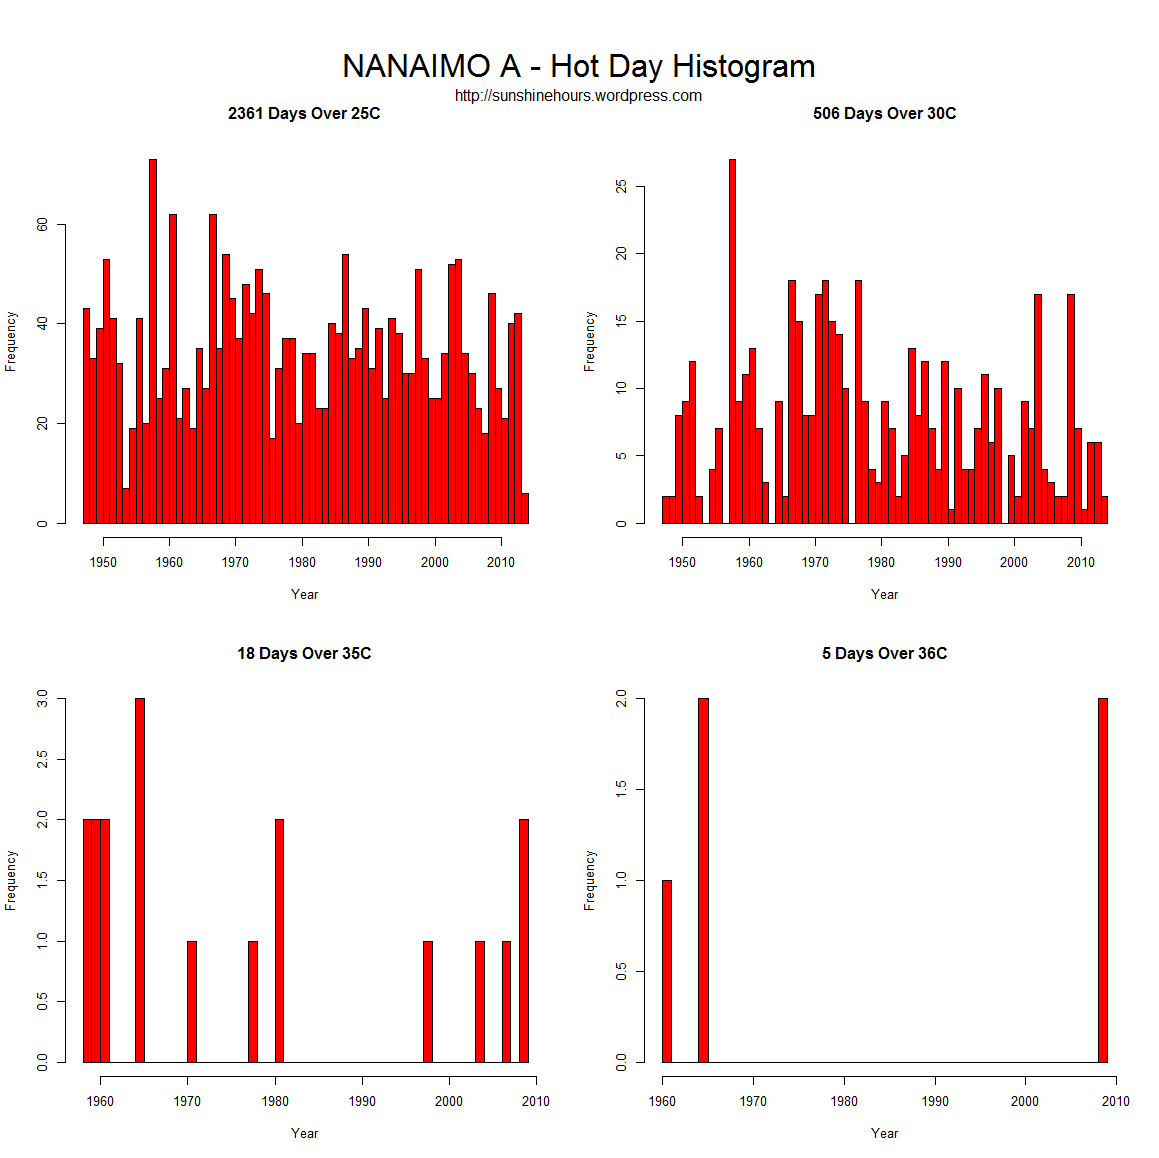
There must be a fingerprint of Extremeness somewhere … right?

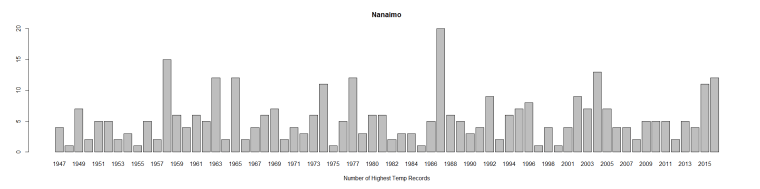
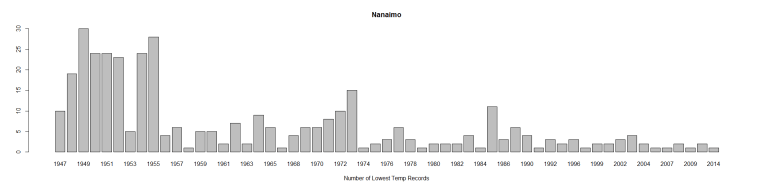
I guess not. The early 40s/50s set a  lot of cold records. The high records are all over the place.

10 MORE Random Canadian Tmax from 1980

A few days I published 10 more randomly chosen graphs of TMAX using Environment Canada’s monthly summaries.

I was fiddling with the graphing code to add the overall rate of temp change and color the title – red for warming and blue for cooling.

I took a closer look at 3 stations (2 are airports).

Tmax temperatures falling at -.414C /dec, -.224/dec and -.246/dec

April Tmax in Brandon have fallen 7C in 35 years.

Tx - SWIFT CURRENT CDA SK . 1980 to 2015 . -0.414 C per decade

Tx - FORT MCMURRAY A AB . 1980 to 2015 . -0.224 C per decade

Tx - BRANDON A MB . 1980 to 2015 . -0.246 C per decade


10 MORE Random Canadian Tmax from 1980

A few days I published 10 randomly chosen graphs of TMAX using Environment Canada’s monthly summaries.

I picked 1980 to 2015 partly to create a round number and partly because that is sort of when AGW became noticeable.

I picked TMAX because I think TMIN’s are rising because of UHI.

The red lines indicate a warming trend. The blue a cooling trend.

Anyone see evidence of CO2 making it warm?

Here are 10 more.

Tx - BONILLA ISLAND BC - 1980 to 2015

Tx - CASTLEGAR A BC - 1980 to 2015

Tx - BRANDON A MB - 1980 to 2015

Tx - GOLDEN A BC - 1980 to 2015

Tx - KANANASKIS POCATERRA AB - 1980 to 2015

Tx - MICA DAM BC - 1980 to 2015

Tx - SWIFT CURRENT CDA SK - 1980 to 2015

Tx - FORT MCMURRAY A AB - 1980 to 2015

Tx - VANCOUVER HARBOUR CS BC - 1980 to 2015

Tx - BONILLA ISLAND BC

10 Random Canadian Tmax from 1980

Every once in a while I visit the data for the Canada. Earlier today I looked at the station nearest me (NANAIMO A).

But since I have the code … I thought why not look at 10 random stations that have data in 1980 and 2015.

Today I am looking at TMAX monthly data (using Environment Canada monthly summaries) for 10 random stations from 1980.

Each line of graphs is a season  – Dec/Jan/Feb …. etc.


Tx Average BEAUCEVILLE QC


Tx Average NEW GLASGOW ON


Tx Average TERRACE A BC


Tx Average WHITECOURT A AB


Tx Average AROOSTOOK NB


Tx Average BARWICK ON


Tx Average MIDLAND WATER POLLUTION CONTROL PLANT ON


Tx Average QUALICUM R FISH RESEARCH BC


Tx Average UCLUELET KENNEDY CAMP BC


Tx Average GIBSONS GOWER POINT BC


Nanaimo Tmax from 1980

Every once in a while I visit the data for the weather station closest to my hometown on the west coast of Canada.

Today I am looking at TMAX monthly data (using Environment Canada monthly summaries) for NANAIMO A from 1980.

Each line of graphs is a season  – Dec/Jan/Feb …. etc.

5 months are warming. 4 are cooling. 3 are cooling ever so slightly.

If there is a CO2 signal in there I am missing it.

Tx Average NANAIMO A


Nanaimo BC Temperature Range

I live near Nanaimo BC (data from 1947 at “NANAIMO A”). I was curious what the temperature range for any given day would be.

By temperature range I mean find the warmest it has ever been for a particular day and then subtract the coldest it has ever been.

December 1st , February 4th, November 14th and May 16 have the biggest range = 32.8C.

November 18th has the lowest range = 16.9C. (I find it interesting it has never been colder than -4.4C on November 18 when it has been -16.1C on November 14th.

(Remember this when someone says humans and animals will notice a 1C change in the next 100 years).

Top 10 and bottom 10 below.

Biggest Difference:

Month Day Min Max Difference
12 1 -18.9 13.9 32.8
2 4 -16.7 16.1 32.8
11 14 -16.1 16.7 32.8
5 16 -4.4 28.4 32.8
6 17 0.6 33.3 32.7
5 29 1.7 34.3 32.6
5 12 0 32.4 32.4
5 28 0.6 33 32.4
5 14 -0.6 31.7 32.3
12 24 -13.9 18.2 32.1

Lowest Difference:

Month Day Min Max Diffference
11 18 -4.1 12.8 16.9
3 15 -3.3 14.5 17.8
12 5 -7.1 12.1 19.2
11 10 -4.4 14.9 19.3
12 11 -6.1 13.5 19.6
12 3 -5.9 14 19.9
12 12 -6.3 13.9 20.2
2 23 -5.6 14.6 20.2
3 14 -3.9 16.6 20.5
3 17 -5 15.7 20.7

Nanaimo Tmax from 1947 to 2015

Every once in a while I visit the data for the weather station closest to my hometown on the west coast of Canada.

Today I am looking at daily TMAX data  from Nanaimo Airport (1947 – 2015).

1987 was the warmest year (1958 was 2nd warmest FYI) . 1955 was the coldest They are shown as the orange and blue lines.

Here I have graphed all the available data in the style I usually use for Sea Ice data.

2015 is in red. There are gaps because Environment Canada doesn’t seem to care.

Notice that temps can fluctuate by 20C for the same day in different years.

Ponder this … why can we humans (and crops and animals)  adapt to 20C swings but we can’t adapt to a 1C change over 100 years?

Click graph for larger.

NANAIMO_MAXTEMP_Antarctic_Style

Update: I added Tmin
NANAIMO_MINTEMP_Antarctic_Style

Nanaimo Tmax from 1913 to 2014 Using Two Overlapping Stations

Every once in a while I visit the data for the weather station closest to my hometown on the west coast of Canada.

Today I am looking at daily data (using KNMI) from Departure Bay (1913 – 1992) and Nanaimo Airport (1947 – 2014).

I’ve summarized the data by monthly mean.

The data does overlap. The first graph is just Tmax. The second graph is Tmax anomaly from the overlap period of 1948 to 1992

Nanaimo TMax - Data From KNMI - Departure Bay and Airport

Nanaimo TMax - Data From KNMI - Departure Bay and Airport - Anomaly From Overlapping 1948-1992


Nanaimo Tmin and Tmax from 1980/1998/2010

Update: From 1948 added at bottom

Every once in a while I visit the data for the weather station closest to my hometown on the west coast of Canada. The data only starts in the late 1940s so there is no extreme’s from the 1930s and 1940s.

The three graphs below have the Tmin and Tmax data from the Environment Canada monthly reports up to the end of 2014.

The three start in 2010, 1998 and 1980. What does the data tell you?

If you start in 2010 … we are going to bake to death.

If you start in 1998 … we are slowly cooling.

If you start in 1980 the Tmin is climbing and the Tmax is dropping. UHI probably.

EC Compare_min_max-NANAIMO A-2010

EC Compare_min_max-NANAIMO A-1998

EC Compare_min_max-NANAIMO A-1980


EC Compare_min_max-NANAIMO A-1948.198

Nanaimo Hot and Cold Day Histograms – So Much For Extreme Weather

You all know that the AGW cult likes to go on and on about “Extreme Weather” because the warming stopped in 1998 and they like to think the world is coming to an end and only they can save us. Just another end of the world cult.

So I thought I would look at the same data for the weather station closest to my hometown on the west coast of Canada. The data only starts in the late 1940s so there is no extreme’s from the 1930s and 1940s.

One thing to remember. The 2361 Days Over 25C number (for example) includes the 506 Days Over 30C etc.

I don’t see any increase in extreme hot days. I don’t see any increase in extreme cold days.

Aside from 2 hot days in July 2009 (matched by the 3 days in the 1960s) and 1 cold day in 2008 matched by a day in 1968 it seems to have been getting less extreme.

HotDay_Histogram_NANAIMO A - Hot Day Histogram

ColdDay_Histogram_NANAIMO A - Cold Day Histogram