UHI and Tmin Nanaimo

Yesterday I posted a WUWT article about Tmin in the UK rising 1.7C thanks to UHI.

I ive near Nanaimo BC and here is the graphs for Tmin and Tmax since 1947.

Tmax has barely changed. Tmin is up 2C or more. UHI.

Data from Weatherstats and Environment Canada

Second Coldest February (avg) Nanaimo

It was the second coldest February in Nanaimo , BC , Canada (data from 1948) in terms of average temperature. The average was 0.05C .

The coldest was 1989 when it averaged-0.03C.

2019

1989

The warmest February was 2015 and it looked like:

Data courtesy weatherstats.ca and Environment and Climate Change Canada

They Promised Me More Heatwaves

The Climate Change believers claim there will be more heatwaves.

“Global climate change is likely to be accompanied by an increase in the frequency and intensity of heat waves … “

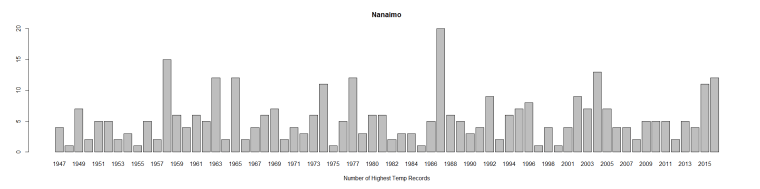
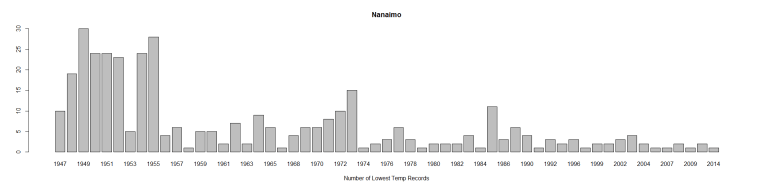
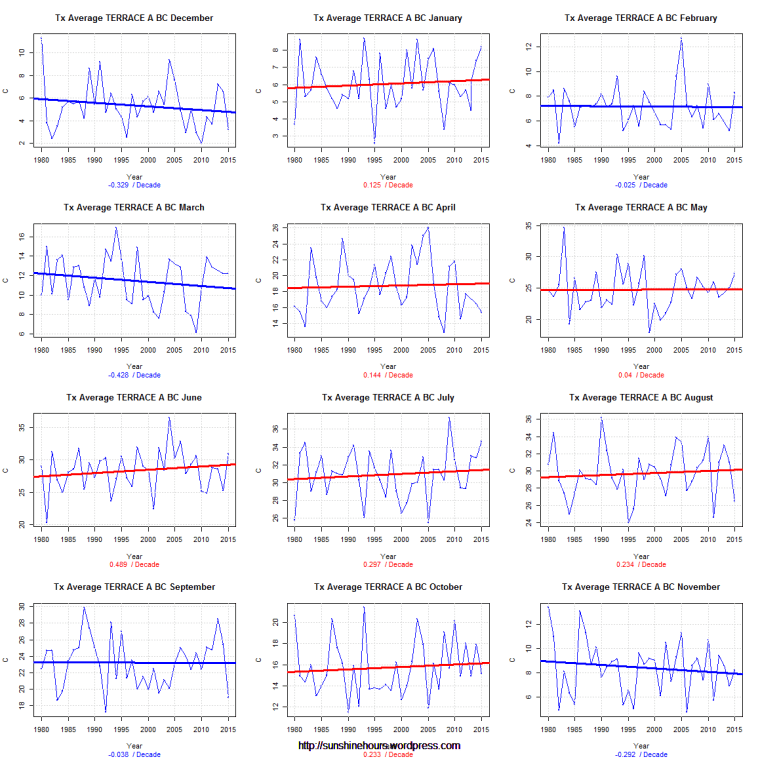
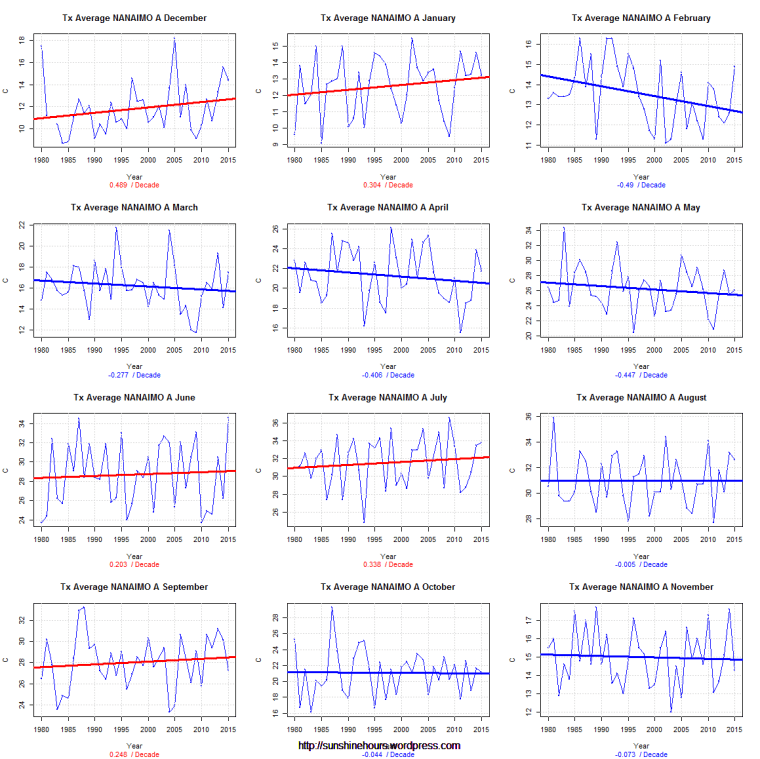
Five years ago (omg) I did a post about how the number of days over 20/25/30C isn’t increasing in my hometown on the westcoast of British Columbia.

This post uses actual days in a heatwave. Lets arbitrarily say a heatwave is consecutive days at or above a certain temperature (I’ll do 25C and 30C).

This is not perfect process because the data from Envornment Canada can be spotty.

I’m only looking at data from 1947 on (which is when a major station move occurred). And I have this caveat: If there is missing data I ignore it.

So, for 25C cutoff, 1977 had 31 days total above 25C and a 22 day stretch above 25C.

Year Days Total Longest Start End
1977 31 22 1977-07-30 1977-08-20
1971 37 20 1971-07-14 1971-08-02
1958 73 17 1958-08-09 1958-08-25
1961 62 17 1961-07-30 1961-08-15
1969 54 15 1969-07-17 1969-07-31
2015 53 15 2015-06-25 2015-07-09
2017 57 15 2017-07-28 2017-08-11
1974 51 14 1974-09-12 1974-09-25
1981 34 14 1981-08-05 1981-08-18
1972 48 13 1972-07-28 1972-08-09
1978 37 13 1978-07-28 1978-08-09
2004 52 13 2004-08-08 2004-08-20
1967 62 12 1967-08-08 1967-08-19
1968 35 12 1968-07-23 1968-08-03
1975 46 12 1975-06-30 1975-07-11
1990 43 12 1990-08-03 1990-08-14
1962 21 11 1962-07-21 1962-07-31
1985 40 11 1985-07-13 1985-07-23
1998 51 11 1998-07-20 1998-07-30
2009 46 11 2009-07-24 2009-08-03

For 30C the longest heatwave is in 1977. No other year comes close.

If you are interested this is the listof temperatures:

30.6,32.4,30.5,33.6,33.2,31.7,30.4,30.8,31.4,33.9,33.8,32.5,30.9,31.1,32.3,34.5,34.5

Year Days Total Longest  Start End
1977 18 17 1977-08-01 1977-08-17
1968 15 8 1968-07-26 1968-08-02
1974 14 8 1974-08-27 1974-09-03
2009 17 8 2009-07-26 2009-08-02
2018 19 8 2018-07-23 2018-07-30
1959 9 7 1959-07-16 1959-07-22
1962 7 7 1962-07-22 1962-07-28
1958 27 6 1958-07-23 1958-07-28
1967 18 6 1967-08-12 1967-08-17
1971 17 6 1971-07-25 1971-07-30
1981 9 6 1981-08-06 1981-08-11
2004 16 6 2004-06-17 2004-06-22
2014 17 6 2014-07-11 2014-07-16
1969 8 5 1969-06-15 1969-06-19
1972 18 5 1972-07-17 1972-07-21
1996 11 5 1996-07-23 1996-07-27
2010 7 5 2010-08-13 2010-08-17
2015 19 5 2015-07-01 2015-07-05
1950 8 4 1950-07-21 1950-07-24
1952 12 4 1952-07-08 1952-07-11

Note that 1958 clobbers the other years when it comes to days total. But they were broken up.

1977 also happens to have occurred as the Great Pacific Climate Shift started.

Where are the heatwaves they promised me?

10 MORE Random Canadian Tmax from 1980

A few days I published 10 more randomly chosen graphs of TMAX using Environment Canada’s monthly summaries.

I was fiddling with the graphing code to add the overall rate of temp change and color the title – red for warming and blue for cooling.

I took a closer look at 3 stations (2 are airports).

Tmax temperatures falling at -.414C /dec, -.224/dec and -.246/dec

April Tmax in Brandon have fallen 7C in 35 years.

Tx - SWIFT CURRENT CDA SK . 1980 to 2015 . -0.414 C per decade

Tx - FORT MCMURRAY A AB . 1980 to 2015 . -0.224 C per decade

Tx - BRANDON A MB . 1980 to 2015 . -0.246 C per decade


10 MORE Random Canadian Tmax from 1980

A few days I published 10 randomly chosen graphs of TMAX using Environment Canada’s monthly summaries.

I picked 1980 to 2015 partly to create a round number and partly because that is sort of when AGW became noticeable.

I picked TMAX because I think TMIN’s are rising because of UHI.

The red lines indicate a warming trend. The blue a cooling trend.

Anyone see evidence of CO2 making it warm?

Here are 10 more.

Tx - BONILLA ISLAND BC - 1980 to 2015

Tx - CASTLEGAR A BC - 1980 to 2015

Tx - BRANDON A MB - 1980 to 2015

Tx - GOLDEN A BC - 1980 to 2015

Tx - KANANASKIS POCATERRA AB - 1980 to 2015

Tx - MICA DAM BC - 1980 to 2015

Tx - SWIFT CURRENT CDA SK - 1980 to 2015

Tx - FORT MCMURRAY A AB - 1980 to 2015

Tx - VANCOUVER HARBOUR CS BC - 1980 to 2015

Tx - BONILLA ISLAND BC

10 Random Canadian Tmax from 1980

Every once in a while I visit the data for the Canada. Earlier today I looked at the station nearest me (NANAIMO A).

But since I have the code … I thought why not look at 10 random stations that have data in 1980 and 2015.

Today I am looking at TMAX monthly data (using Environment Canada monthly summaries) for 10 random stations from 1980.

Each line of graphs is a season  – Dec/Jan/Feb …. etc.


Tx Average BEAUCEVILLE QC


Tx Average NEW GLASGOW ON


Tx Average TERRACE A BC


Tx Average WHITECOURT A AB


Tx Average AROOSTOOK NB


Tx Average BARWICK ON


Tx Average MIDLAND WATER POLLUTION CONTROL PLANT ON


Tx Average QUALICUM R FISH RESEARCH BC


Tx Average UCLUELET KENNEDY CAMP BC


Tx Average GIBSONS GOWER POINT BC


Nanaimo Tmax from 1980

Every once in a while I visit the data for the weather station closest to my hometown on the west coast of Canada.

Today I am looking at TMAX monthly data (using Environment Canada monthly summaries) for NANAIMO A from 1980.

Each line of graphs is a season  – Dec/Jan/Feb …. etc.

5 months are warming. 4 are cooling. 3 are cooling ever so slightly.

If there is a CO2 signal in there I am missing it.

Tx Average NANAIMO A


Nanaimo BC Temperature Range

I live near Nanaimo BC (data from 1947 at “NANAIMO A”). I was curious what the temperature range for any given day would be.

By temperature range I mean find the warmest it has ever been for a particular day and then subtract the coldest it has ever been.

December 1st , February 4th, November 14th and May 16 have the biggest range = 32.8C.

November 18th has the lowest range = 16.9C. (I find it interesting it has never been colder than -4.4C on November 18 when it has been -16.1C on November 14th.

(Remember this when someone says humans and animals will notice a 1C change in the next 100 years).

Top 10 and bottom 10 below.

Biggest Difference:

Month Day Min Max Difference
12 1 -18.9 13.9 32.8
2 4 -16.7 16.1 32.8
11 14 -16.1 16.7 32.8
5 16 -4.4 28.4 32.8
6 17 0.6 33.3 32.7
5 29 1.7 34.3 32.6
5 12 0 32.4 32.4
5 28 0.6 33 32.4
5 14 -0.6 31.7 32.3
12 24 -13.9 18.2 32.1

Lowest Difference:

Month Day Min Max Diffference
11 18 -4.1 12.8 16.9
3 15 -3.3 14.5 17.8
12 5 -7.1 12.1 19.2
11 10 -4.4 14.9 19.3
12 11 -6.1 13.5 19.6
12 3 -5.9 14 19.9
12 12 -6.3 13.9 20.2
2 23 -5.6 14.6 20.2
3 14 -3.9 16.6 20.5
3 17 -5 15.7 20.7

Nanaimo Tmax from 1947 to 2015

Every once in a while I visit the data for the weather station closest to my hometown on the west coast of Canada.

Today I am looking at daily TMAX data  from Nanaimo Airport (1947 – 2015).

1987 was the warmest year (1958 was 2nd warmest FYI) . 1955 was the coldest They are shown as the orange and blue lines.

Here I have graphed all the available data in the style I usually use for Sea Ice data.

2015 is in red. There are gaps because Environment Canada doesn’t seem to care.

Notice that temps can fluctuate by 20C for the same day in different years.

Ponder this … why can we humans (and crops and animals)  adapt to 20C swings but we can’t adapt to a 1C change over 100 years?

Click graph for larger.

NANAIMO_MAXTEMP_Antarctic_Style

Update: I added Tmin
NANAIMO_MINTEMP_Antarctic_Style