Professional anti-pipeline activists will try to tell you it’s oil tanker traffic. That’s a lie.
According to the National Energy Board’s 674-page report released last week, when it comes to the noise pollution affecting the struggling pod of 74 killer whales, oil tanker traffic is responsible for just one per cent of the pod’s lost foraging time.
The most significant contributors to the noise pollution that negatively impacts the ability of the whales to hunt and feed are other commercial vehicles — mostly passenger ferries, tug boats, deep-sea fishing vehicles and in the summer, whale-watching boats, says the report which gave the green light to the Trans Mountain pipeline expansion.
So much for the moniker eco-tourism. Those of us who pay to get close to these magnificent creatures may actually be killing them with our love.
According to the NEB report, the Department of Fisheries and Oceans said that commercial whale watching in the Canadian and U.S. portions of the Salish Sea increased from a few boats in the 1970s to about 100 boats in 2016.
The NEB refers to a 2017 report in the scientific journal Nature, called Evaluating Anthropogenic Threats to Endangered Killer Whales. It states that “from the perspective of a foraging killer whale that emits high-frequency (18-32 kHz) echolocation clicks to detect and capture salmon, high-frequency noise from small, outboard vessels that follow whales might cause a greater reduction in a killer whale’s foraging success than low-frequency (<1 kHz) background noise from commercial shipping.”
These endangered whales are being chased virtually every moment of daylight from May to September. Is it any wonder they’re losing weight and are having troubles catching their food — something they do by using sound waves? If people want to watch whales, they should go out in sailboats or kayaks.
The NEB refers to another report that says the foraging time for the orca pod as a result of noise is reduced by up to 5.5 hours per day. B.C. Ferries account for 52 to 67 per cent of lost foraging time due to noise and tug boats account for 12 to 27 per cent. And, oil tankers make up just one per cent of that lost foraging time.
Meanwhile, the number of added tanker trips caused by the proposed expansion of Trans Mountain Pipeline is just 29 more ships per month for a total of 35 per month, or about one per day.
So there you have it. Tourism isn’t so green after all. It contributes significant greenhouse gases and makes hunting, for at least this one pod of killer whales, very difficult.
An aerial view of the Trans Mountain marine terminal in Burnaby on May 29, 2018.JONATHAN HAYWARD /THE CANADIAN PRESS
Despite what you have already read about the Trans Mountain pipeline causing “significant” problems for the endangered killer whale pod in question — something that critics are already saying — that is not what experts actually say.
What the NEB report actually says is this: “While the effects from Project-related marine shipping will be a small fraction of the total cumulative effects, and the level of traffic is expected to increase with or without the Project, the increase in marine vessels associated with the Project would further contribute to cumulative effects that are already jeopardizing the recovery of SRKW (southern resident killer whales.)”
One of the arguments used against the twinning of the Transmountain (TMX) pipeline in BC is that it threatens Southern Resident Killer Whales (SRKW) with more ship noise. I have my doubts about ship noise being the problem since Orcas (non-SRKW ) are doing ok elsewhere.
The SRKW are a small pod (79?) and are not doing well at all and may go extinct. But they may have reached an evolutionary dead end because they eat fish unlike other Orcas that eat seals etc. And humans are eating the fish.
“Resident orcas [SRKW ] eat exclusively fish with salmon (primarily Chinook) the majority of their diet. Transient orcas prefer to eat other marine mammals like seals, sea lions, and other whales.”
The TMX expansion will result in about 400 addition ship movements per year through the are the Residents feed. About 1 per day. That 400 is a small number compared to all ship movements in the region, but usually the numbers are only mentioned for tankers.
The National Energy Board released a report with recomendations like:
“Trans Mountain must file with the NEB, at least 3 months prior to commencing operations, a Marine Mammal Protection Program that focuses on mitigating effects from the Project and associated cumulative effects, and on fulfilling Trans Mountain’s commitments as a terminal operator with regard to Project-related marine shipping.”
I think there are something 23,000+ ships movements per year in the SRKW territory.
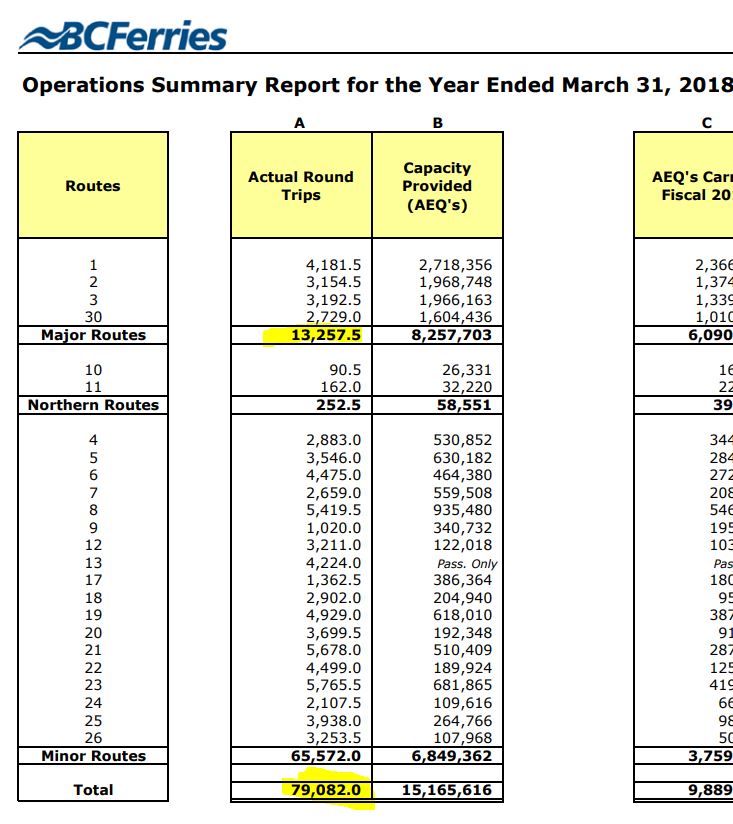
Pretty much the day after the report came out, the current NDP (socialist) government (and their Green allies) announced that they were expanding ferry sailings by 2,700 sailings, many of which are in the SRKW territory.
Amazing.
On top of that, the NEB report had this gem:
“Based on its 2016 analysis, Vancouver Fraser Port Authority forecasts the number of vessel calls to the Port of Vancouver may increase to about 12 ships per day by 2026.”
The big green machine are pulling out the stops. I don’t doubt that a few of them care about the SRKW. But for the most part it is all part of the plan to kill the oilsands in Alberta.
BC consumes about .75 billion cubic feet of natural gas per day (2017). Thats about 8% of Canada’s NG consumption.
750,000,000cf = 219.8GWh per day of electricity according to this site.
That is 80,227GWh per year.
Site C, a very “constroversial” hydro dam in BC, will produce 5,100GWh.
That means BC needs to build 15.73 (lets round to 16) Site C dams just to eliminate natural gas consumption. And that ignores the fact that peak consumption might be a lot more. And I don’t have peak consumption data. It would be alot higher.
As I said, a graph inspired me. It shows the same idea for the UK. And the red is heat demand for UK. I don’t think it includes industrial demand.
The oil and gas portion of an investors conference in Whistler has been scrapped after the resort town’s mayor demanded fossil fuel companies pay for costs associated with climate change.
“I sincerely regret that anyone felt unwelcome here,” he said. “We recognize there are hundreds of thousands of Canadians who work directly and indirectly in the oil and gas sector and they are very proud of the work they do.”
In the letter, Crompton asked CNRL pay a “fair share” of the town’s “costs of climate change,” including part of a $1.4-million wildfire protection budget.
But the apology hasn’t stopped investors from cancelling their trips to Whistler for the 21st annual CIBC Whistler Institutional Investor Conference in January, and Postmedia has learned CIBC has cancelled the oil and gas sector’s part of the conference.
“The Canadian energy industry has been a global leader of responsible energy development,” CIBC said in a statement. “We are committed to our clients in the energy sector as they play a key role in driving the Canadian economy.”
Crompton acknowledged in his apology how the resort community depends on fossil fuels and said Whistler has “a responsibility to respond to the climate change challenge ourselves, and do it locally.”
Interesting video about volcanoes and glaciers “starring” scientists from my alma mater.
I know the video is from the left-wing climate doom peddling CBC and it is quite shameful they use headlines implying climate change could “wake up” volcanoes.
I’ll concede that volcanoes can effect glaciers. But everything else is doom mongering.
A much better version of the story (from 3 months ago) is here.
“Researchers knew that fumaroles likely existed on the mountain — there had been reports of a sulphur-like smell near the mountain for years, not to mention hot springs in the area—but now, with the glaciers retreating, it seems they had emerged from beneath the snow and ice.”
Update/Correction: The author of the blog post noted in one list:
BASIC CHARGE ($0.4065/day) = 148.37
And didn’t carry it the list with the total.
And the delivery charge is 4.296 per GJ = 429.60 (100GJ for the year)
DELIVERY CHARGE = $429.60
BASIC CHARGE ($0.4065/day) = 148.37
STORAGE AND TRANSPORT = $75.80
COST OF THE GAS = $154.90
MUNICIPAL OPERATING FEE = $20.40
CARBON TAX = $173.82
CLEAN ENERGY LEVY = $2.64
GST = $42.73
GAS total corrected to: 1048.26
Not quite as dramatic a difference … but still huge.
End of Correction
Original post below
Great blog article comparing Heating with Natural Gas vs. Electricity in BC
The conclusion: Gas Wins at 1/4 of the price.
You pay more in GST for electricity than the actual cost of the gas.
A typical home in the southern interior will use 100 GJ (or 27,778kWh) of energy to heat for a year. Smaller homes and more efficient furnaces can improve on this number, as can global warming because of warmer winters. Bigger homes or poorly insulated homes will use more.
Assuming that you require 100 GJ of heat for your home for the year, your gas costs will be:
DELIVERY CHARGE = $42.96
STORAGE AND TRANSPORT = $75.80
COST OF THE GAS = $154.90
MUNICIPAL OPERATING FEE = $20.40
CARBON TAX = $173.82
CLEAN ENERGY LEVY = $2.64
GST = $42.73
TOTAL = $899.89
Using traditional baseboard heaters, the same amount of energy would cost you over $4,000/year with BC Hydro.