Sea Ice Extent – Day 34 – Antarctic Sawtooth

DataSouth / North

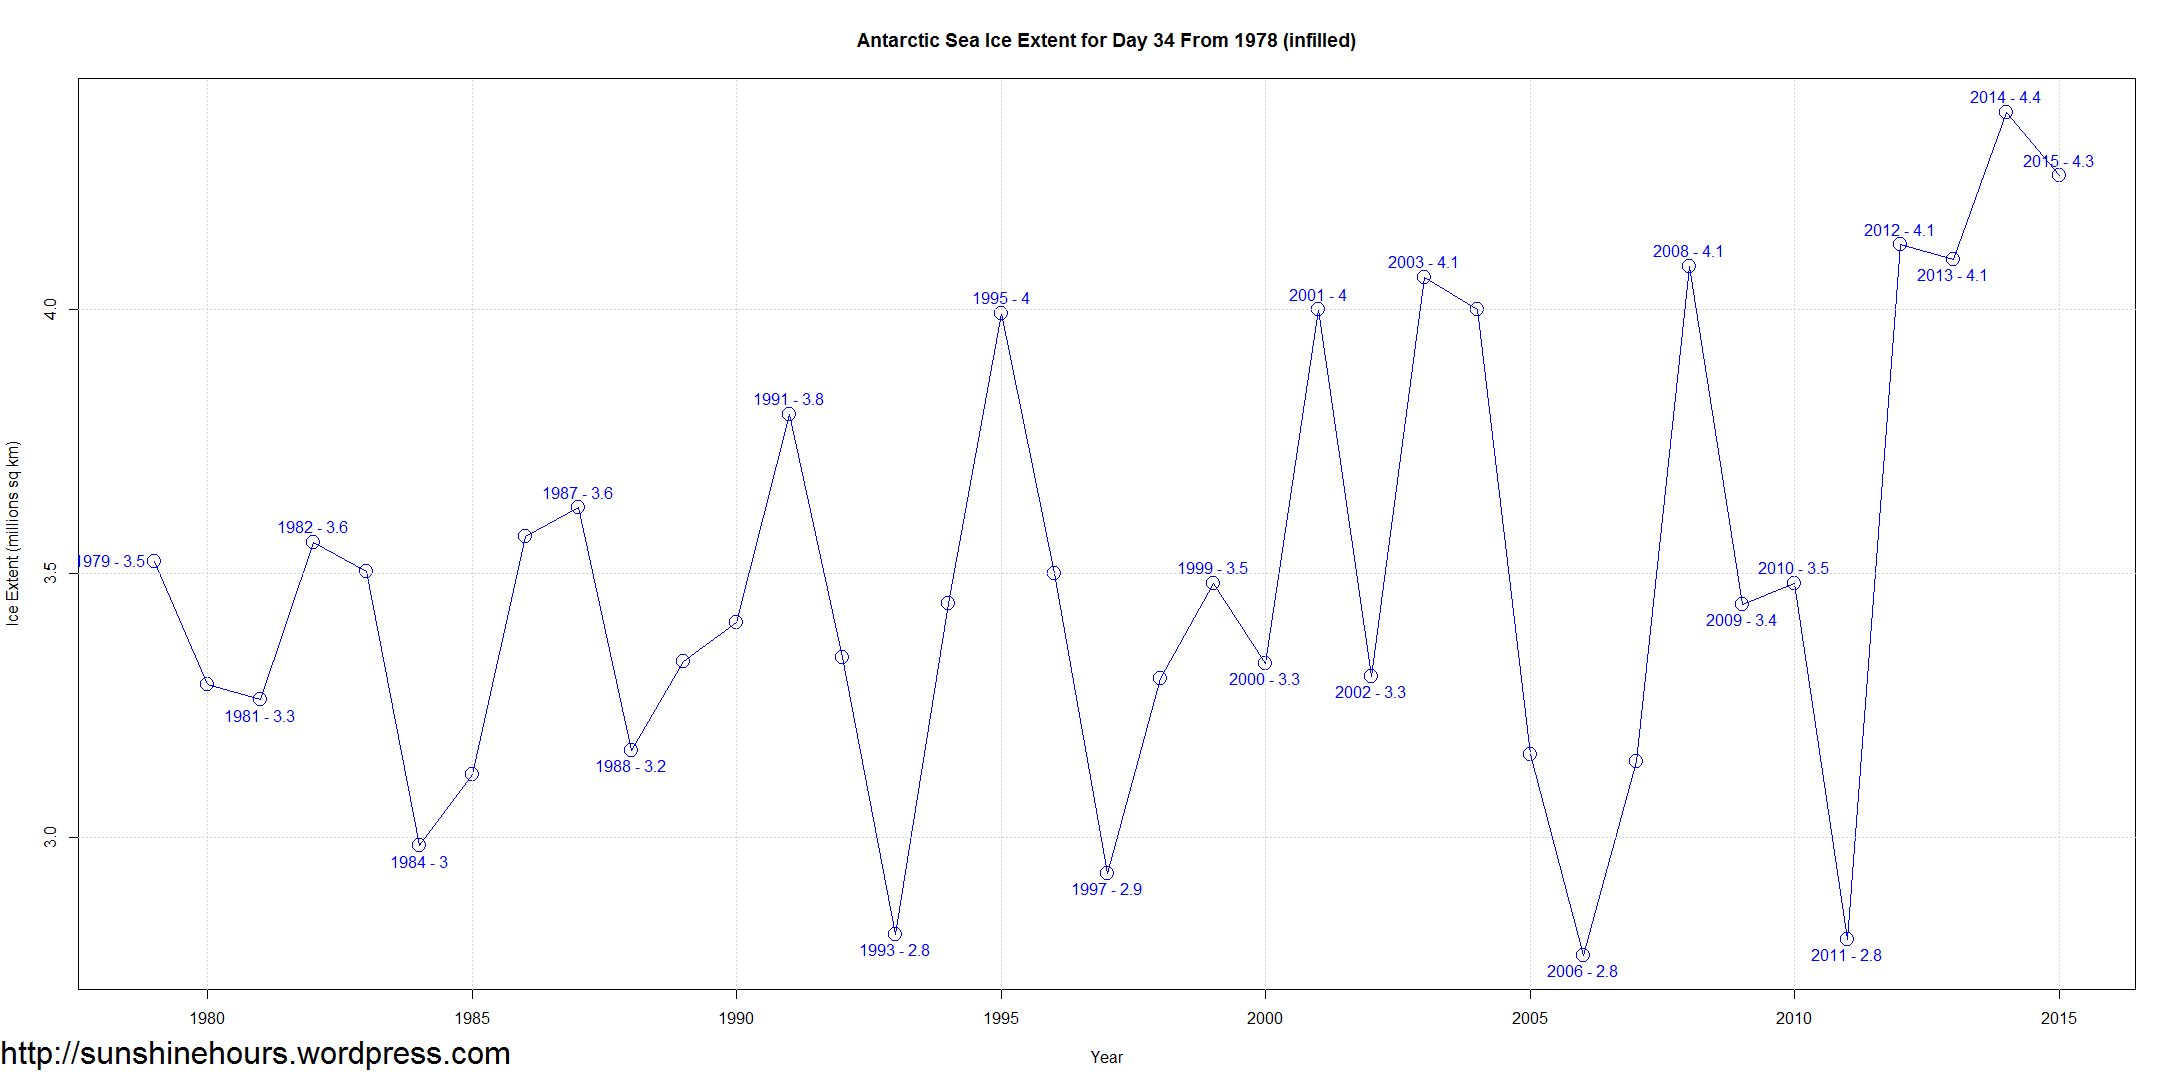
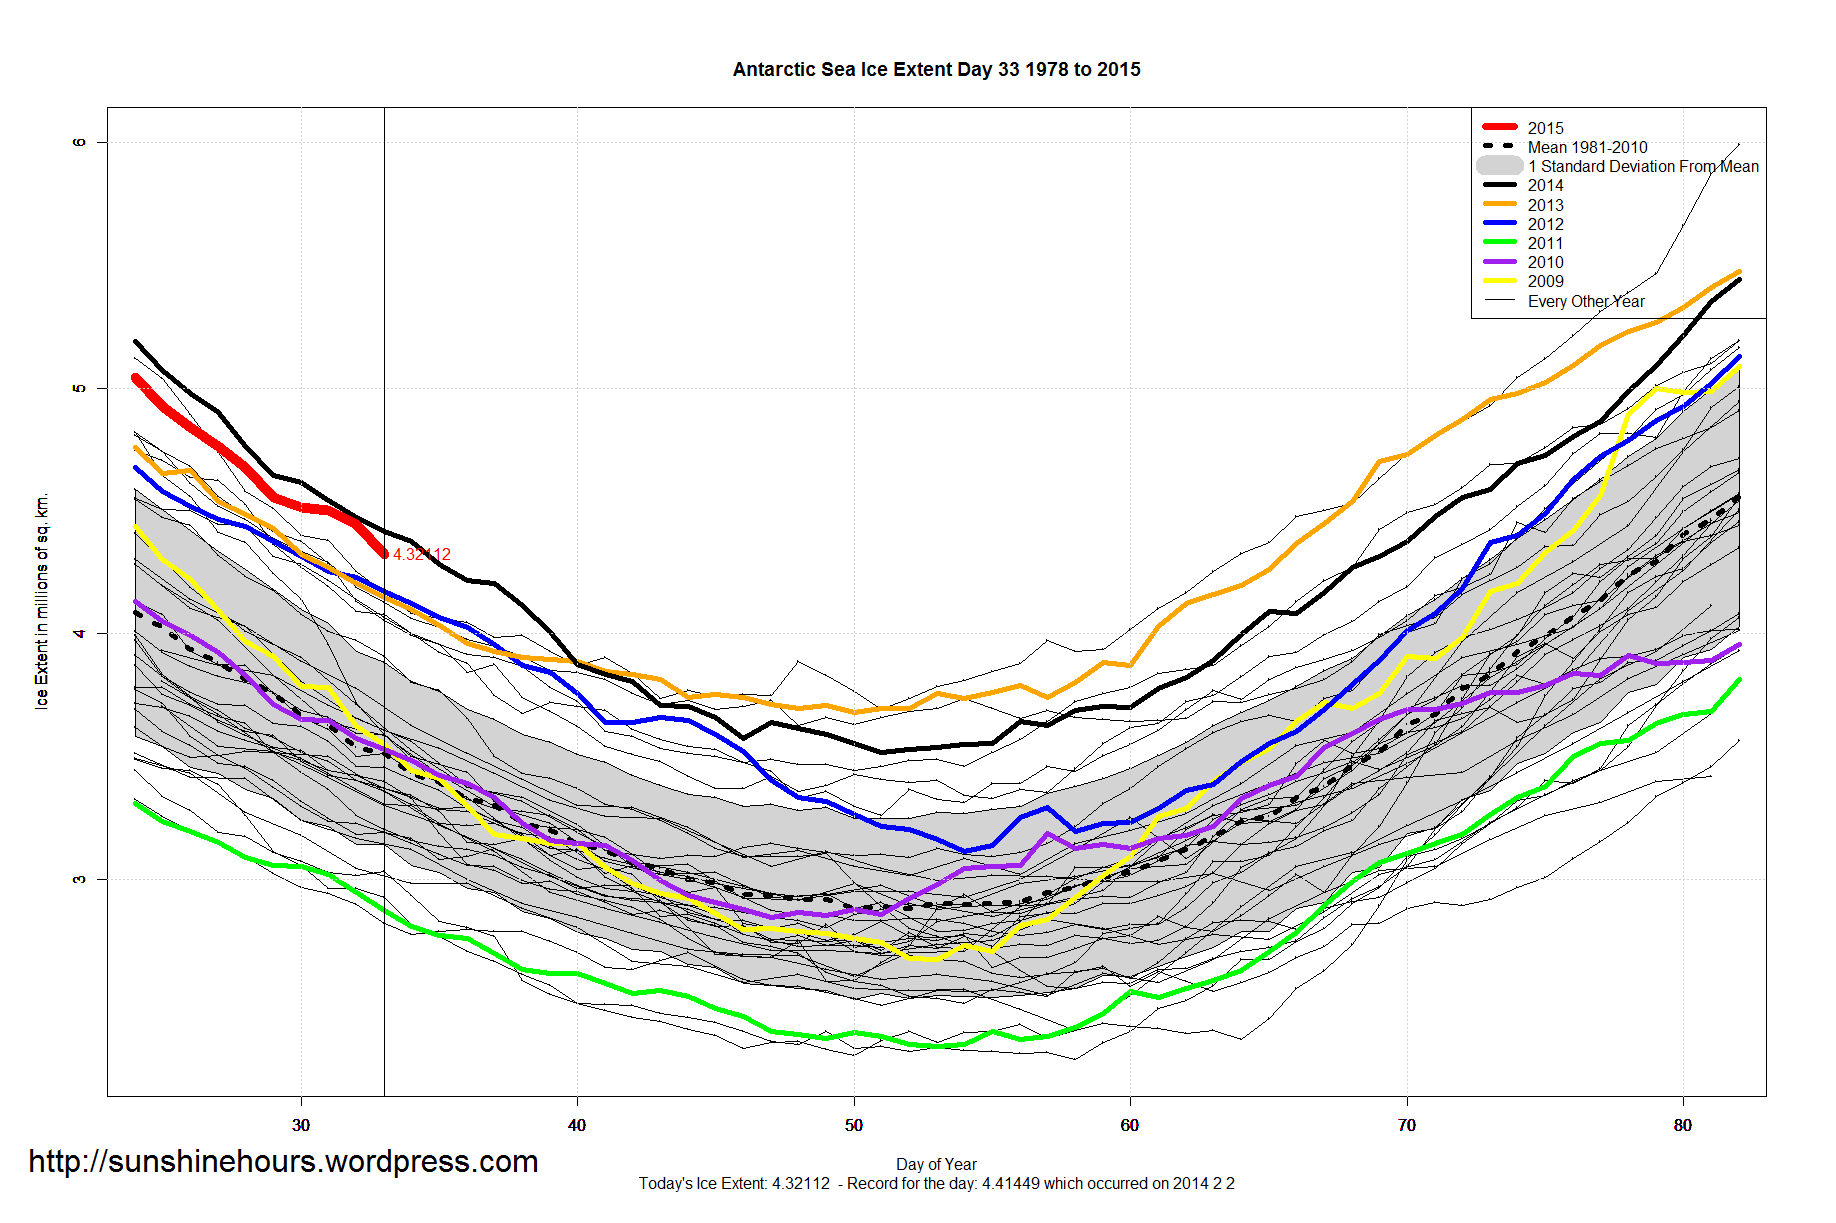
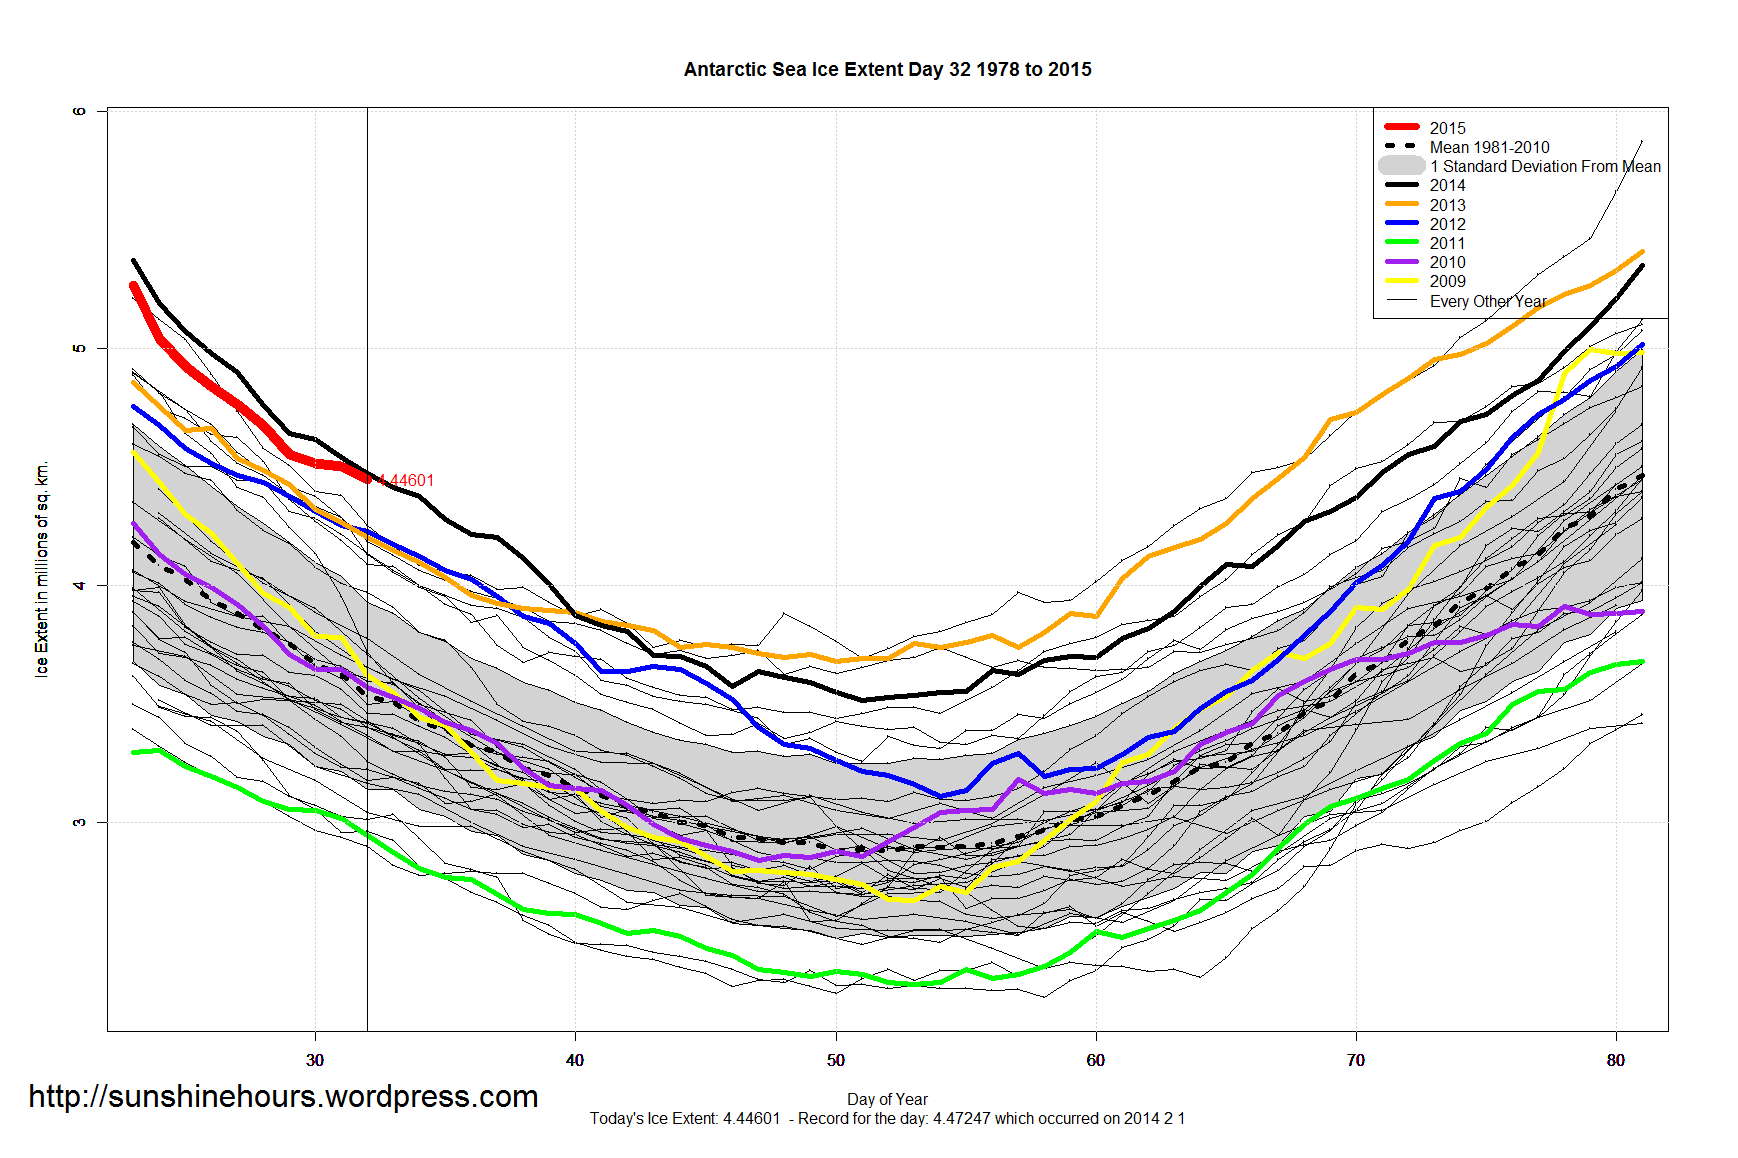
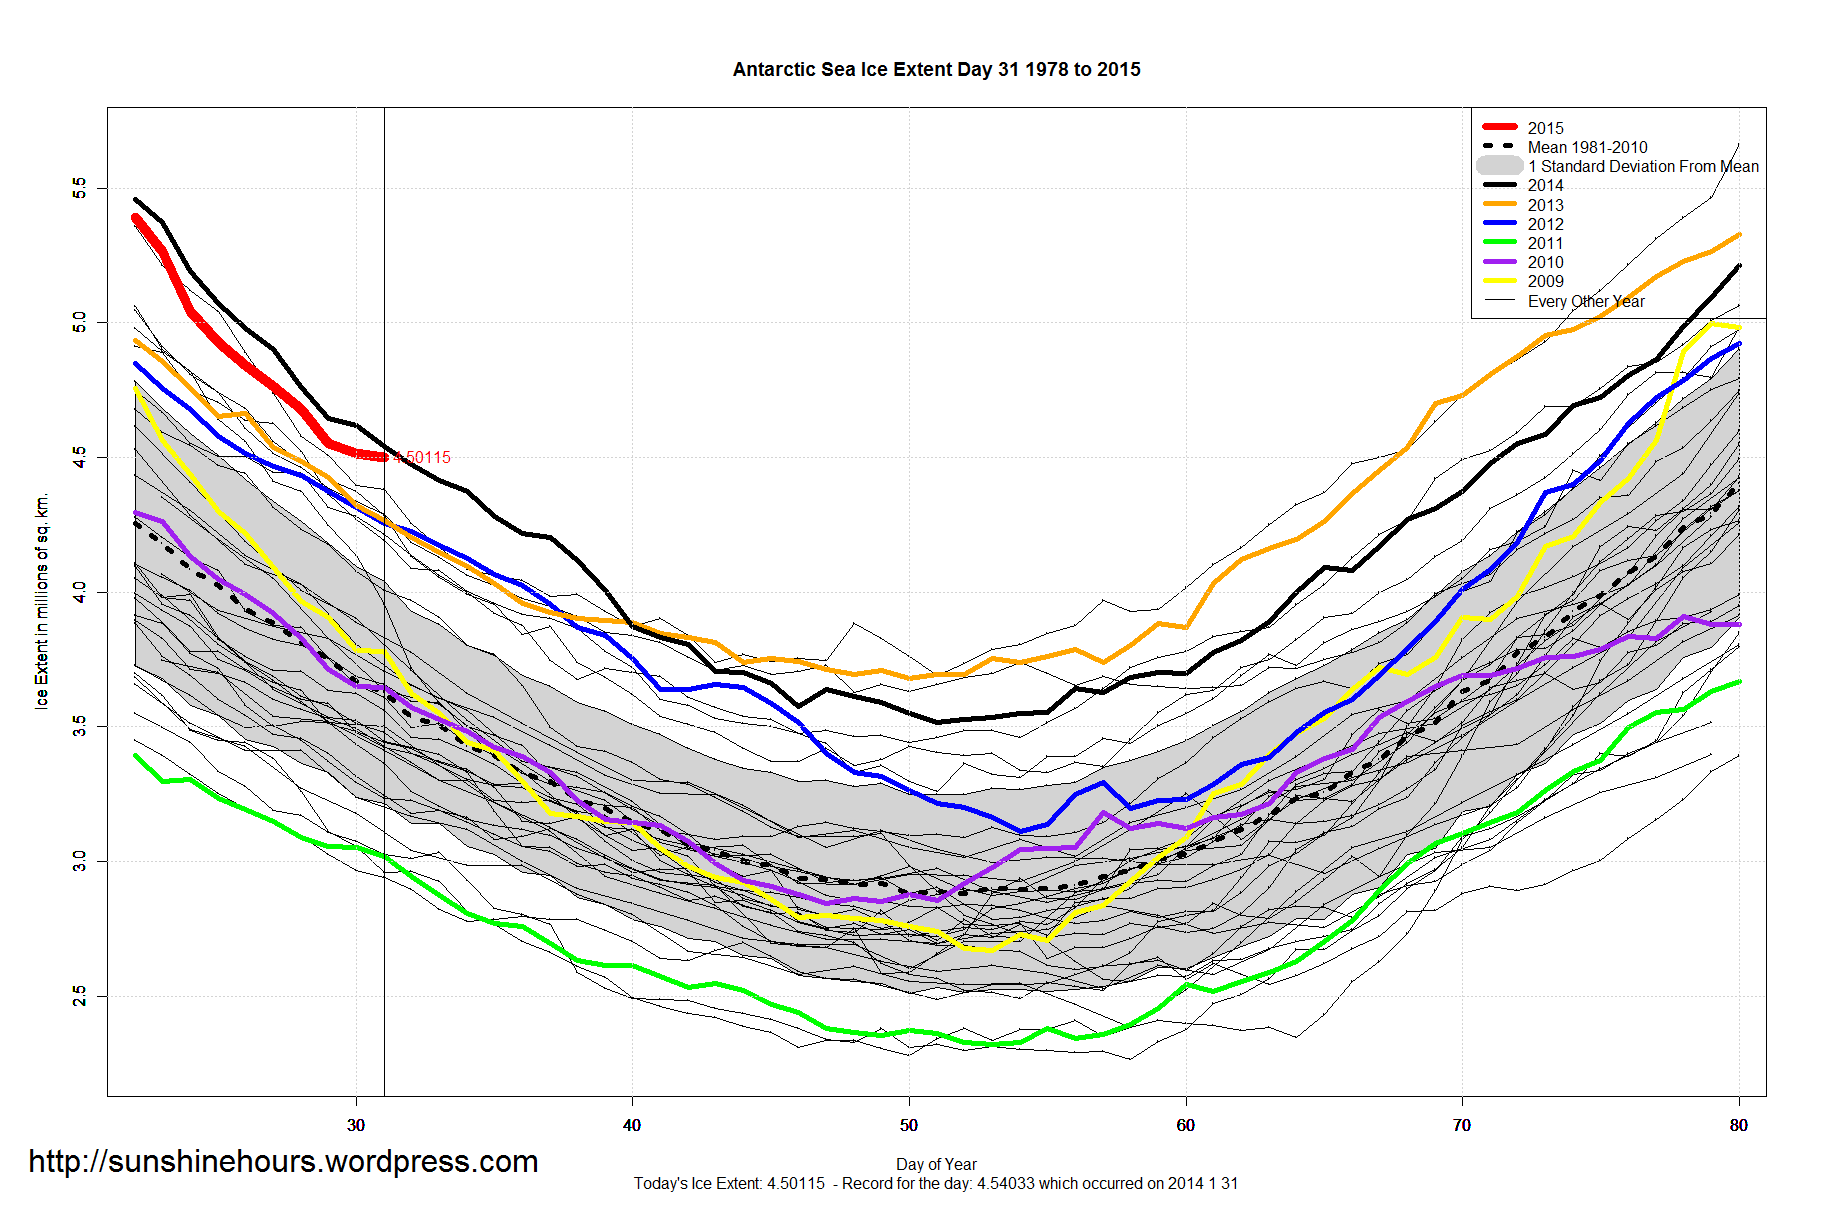
Normally (as you can see from the graph below) at this time of year Antarctic Sea Ice is high one or two years and then drops as much as 1.3 million sq km to a low (even a new) low and then repeats.

From 2012 the big drop in the sawtooth pattern stopped. From 2012 every  value is above every value before 2012 (with a little license for the tiny dip from 2012 to 2013).


Antarctic Sea Ice Extent for Day 34 From 1978 (infilled) Global_Sea_Ice_Extent_Zoomed_2015_Day_34_1981-2010 Antarctic_Sea_Ice_Extent_Zoomed_2015_Day_34_1981-2010 Arctic_Sea_Ice_Extent_Zoomed_2015_Day_34_1981-2010

Nanaimo Tmax from 1913 to 2014 Using Two Overlapping Stations

Every once in a while I visit the data for the weather station closest to my hometown on the west coast of Canada.

Today I am looking at daily data (using KNMI) from Departure Bay (1913 – 1992) and Nanaimo Airport (1947 – 2014).

I’ve summarized the data by monthly mean.

The data does overlap. The first graph is just Tmax. The second graph is Tmax anomaly from the overlap period of 1948 to 1992

Nanaimo TMax - Data From KNMI - Departure Bay and Airport

Nanaimo TMax - Data From KNMI - Departure Bay and Airport - Anomaly From Overlapping 1948-1992