A few days I published 10 more randomly chosen graphs of TMAX using Environment Canada’s monthly summaries.
I was fiddling with the graphing code to add the overall rate of temp change and color the title – red for warming and blue for cooling.
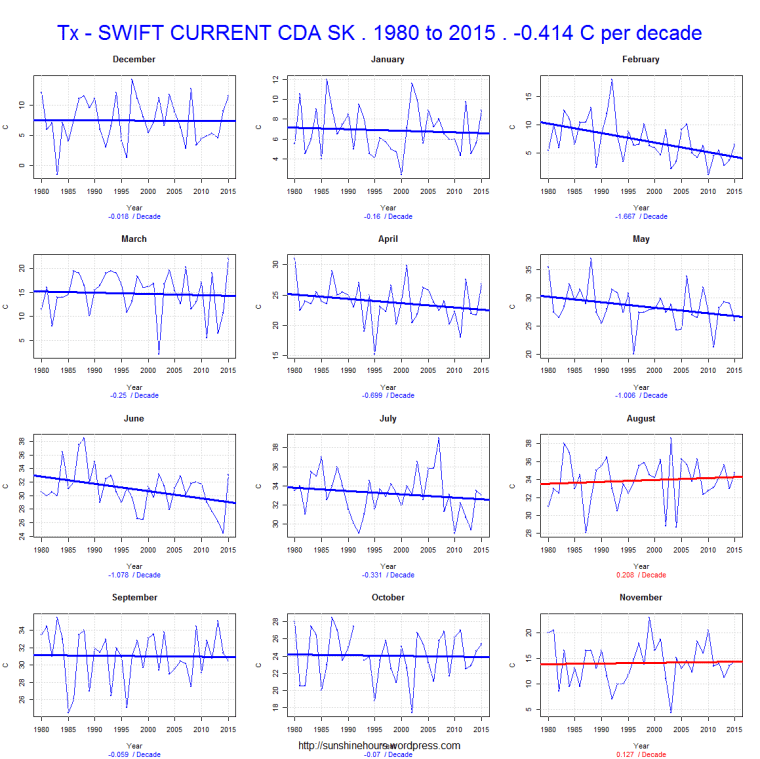
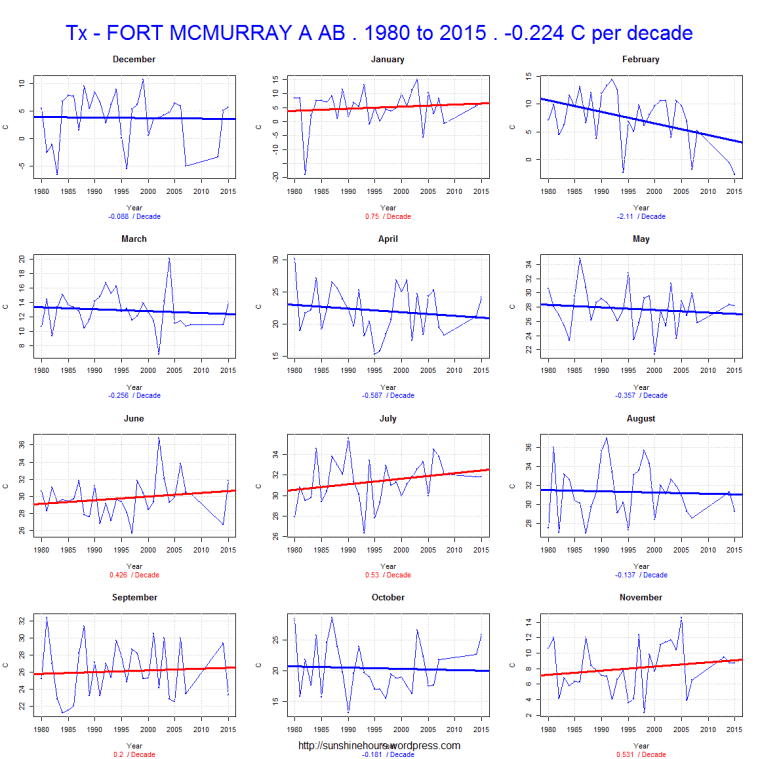
I took a closer look at 3 stations (2 are airports).
Tmax temperatures falling at -.414C /dec, -.224/dec and -.246/dec
April Tmax in Brandon have fallen 7C in 35 years.