Polar Bears Are Morons (Maybe Not)

A study claims Polar Bears are swimming longer, tiring them out and that maybe cause them problems.

The Polar Bear Science Blog points out the obvious:

So, despite what may be implied during media moments, Beaufort Sea polar bears were  not frantically trying to reach the sea ice from land so that they could attempt to keep feeding over the summer – most of their swimming was done during breakup in July and August from one bit of pack ice to another and they showed no evidence of harm from doing so.

What do you think? Do you think they swim like this (avoiding all ice floes):

PB1

Or like this (jumping on ice floes for a rest when they need it):


PB2

Polar Bears in Southern Hudson Bay Losing Body Weight – Or Just Dying?

Capture A new “study” blames climate change for making Polar Bears in the southern Hudson Bay population lose weight .

The world’s southernmost population of polar bears has already lost significant amounts of body weight after decades of shrinking sea ice with breeding females suffering the most, says new research from the Ontario government.

“They’re in poorer condition now than they were in the 1980s,” said Martyn Obbard, of the province’s natural resources department, one of the co-authors of the paper published by the National Research Council.

Maybe it isn’t climate change. Maybe the biggest polar bears are being shot.

Northern wildlife officials will meet in Quebec’s arctic region Wednesday to discuss quotas on the world’s last unregulated polar bear hunt.

Hunters who kill bears from the south Hudson Bay population, which includes Quebec, Ontario and Nunavut, have a voluntary limit of 60 bears a year.

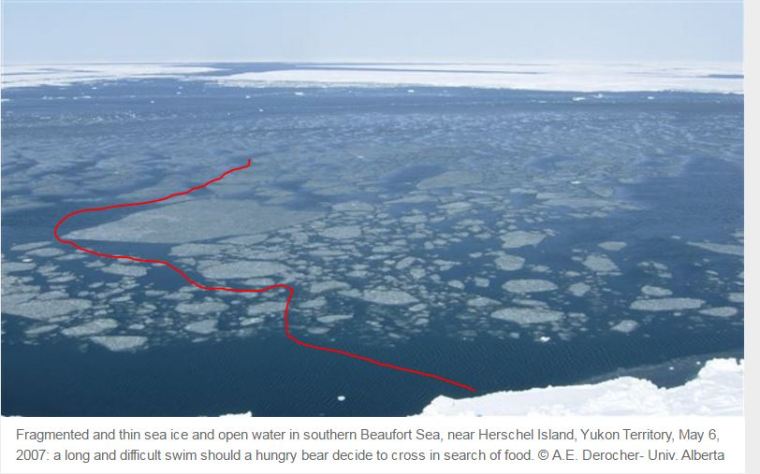
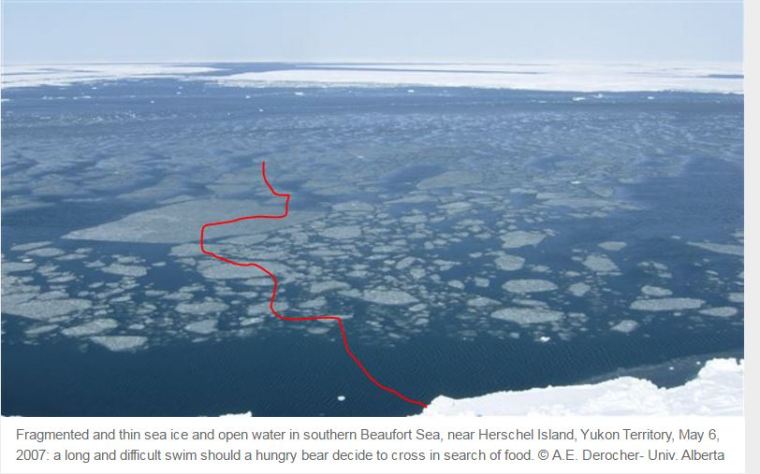
But scientists say climate change is starting to affect the population’s health and that the region’s first official quotas should be lower.

None of the various aboriginal communities that hunt those bears say they’re willing to reduce their take.

According to the first report, there are “roughly 900 bears” in the southern Hudson Bay population. If you kill at least 60 (it is after all a voluntary quota) out of 900 and if you are selling those pelts you want the biggest and healthiest bears.

Maybe the survivors (after the biggest are killed for their pelts) are smaller.

Bids for what ended up being the dearest skin, a spotless white specimen that was also over 10 feet in length, started at $7,000 and didn’t stop until they’d reached $12,400—$1,400 more than last year’s top seller, a previous record. It went to Anna and Steve Gao, whose Mississauga, Ont.-based business, Canadian Intertrade JJ Ltd., ships furs to China and elsewhere.

Early this year, word spread that hunters from the northern Quebec community of Inukjuak had killed as many as 70 polar bears last season—an enormous jump over past years and an unsustainable harvest rate for the southern Hudson Bay polar bear population

The spike in kills around Inukjuak is thought to have begun when a buyer arrived in the region and announced he’d pay big money in advance for furs.

If you look at Canada as a whole 500 polar bears are being shot:

Each year, Aboriginal hunters and foreign sportsmen pursuing the animals alongside Aboriginal guides kill some 500 polar bears (there is no federal cap, and that number depends on shifts in geographic harvest quotas and on First Nations treaties). Many of the resulting polar bear skins find their way to market.


Greenpeace May Be In Trouble in Canada

I’m sure the shredders will work overtime, but Greenpeace could be in trouble.

Any day now a Canadian court could force the radical environmental group Greenpeace to open up its records world-wide to scrutiny from attorneys for Resolute Forest Products. The progressive green bullies may have picked on the wrong business.

Standard operating procedure for many companies faced with a protest campaign is to write a check and hope it goes away. But not at Montreal-based Resolute. CEO Richard Garneau tells us, “If you believe you’re on firm ground, you stand firm.”

In 2012 Greenpeace claimed that Resolute was violating forestry practices that the company had agreed to follow. Resolute threatened legal action and so Greenpeace retracted its claims. But Resolute says that even after the retraction the environmental outfit kept publishing and broadcasting the same false claims, along with some new ones. According to the company, one Greenpeace tactic is to show video footage of trees damaged by an insect outbreak hundreds of miles away but pretend it is the forest harvested by Resolute. Greenpeace denies this.

In 2013 Resolute sued Greenpeace for “defamation, malicious falsehood and intentional interference with economic relations” and sought $7 million Canadian in damages. The company has clearly been harmed by Greenpeace’s fact-challenged denunciations of logging in Canada’s vast boreal forest. As a result of the green media campaign, Resolute says it has lost U.S. customers including Best Buy. Greenpeace says in its court filings that its publications on Resolute “present fair comment based on true facts” and that the company is “engaged in destructive forest operations.”

But Greenpeace may be forced to defend those comments. In January 2015 an Ontario court refused to consider an appeal of its motion to dismiss the lawsuit. Then last June Superior Court Justice F. B. Fitzpatrick rejected Greenpeace’s motion to strike part of the Resolute complaint that details the environmental group’s activities around the world.

It’s a greatest hits collection of green distortions. One paragraph reads: “In 2006, Greenpeace USA mistakenly issued a press release stating ‘In the twenty years since the Chernobyl tragedy, the world’s worst nuclear accident, there have been nearly [FILL IN ALARMIST AND ARMAGEDDONIST FACTOID HERE]’.”

[…] Greenpeace has tried to contain the Resolute case and ensure it only affects its Canadian operations, but Justice Fitzpatrick wisely understood that it is one global organization. Now the Divisional Court in Ontario is considering the issue and if Greenpeace loses again, the outfit could soon be coughing up the internal documents behind its various campaigns of fear and intimidation world-wide.”

http://www.thegwpf.com/pushing-back-against-green-bullies/

Shameful: Environment Canada’s Sunshine Data

Once up a time (June of 1978 to be precise)  if you downloaded Environment Canada’s monthly summaries, you would have found 313 stations with “Bright Sunshine” hours.

Even two years ago, these stations were reporting sunshine data:

TORONTO LESTER B. PEARSON INT’L A
CARTWRIGHT
GOOSE A
VICTORIA INT’L A
COMOX A
VANCOUVER INT’L A
WIARTON A

As of today, only WIARTON A reports sunshine data and for May 2015 25 out of 31 days had no valid measurements.

Canada Monthly Summary Analysis - 1900 to 2015 - Sunshine - 1x1 Grid - WIARTON A ( 3 or fewer missing days)

British Columbia Canada Tmax – Missing Data April 2015

This a followup to this post: British Columbia Canada Tmax , Tmin and Tmean from 1873 (On 1×1 Grid)

The following map shows which stations were missing (or not missing) daily Tmax data in the monthly summary for April 2015.

Blue had 0-3 days missing. Red more than 3. What saddens me is that 19 out of the 43 “red” stations were also “Normals” – which means they were reference stations.

Canada Monthly Summary Analysis - Missing Tmax Data - April 2015


Alberta Canada Tmax , Tmin and Tmean from 1873 (On 1×1 Grid) – It Was 2C Warmer in the 1940s

This is the Alberta followup the BC post. You can read the explnations.

In the terms of Tmax the coldest period in Alberta (using 5 year means) was 1972-1976.

The warmest period was 1940 – 1944. In fact it was 2C warmer in 1940-1944 than 2011 – 2015. (The 1930s were just slightly cooler than the early 40s)

You may ask why the green line of grid counts goes up and down so much. It appears there are many more stations reporting in May/Jun/Jul/Aug/Sep than in the winter.

Tmax

Canada Monthly Summary Analysis - 1873 to 2015 - Tmax - 1x1 Grid - AB

Tmin

Canada Monthly Summary Analysis - 1873 to 2015 - Tmin - 1x1 Grid - AB

Tmean

Canada Monthly Summary Analysis - 1873 to 2015 - Tmean - 1x1 Grid - AB

Click for larger:


British Columbia Canada Tmax , Tmin and Tmean from 1873 (On 1×1 Grid)

Step 1: Use Data from Environment Canada’s monthly summaries.

Step 2: Summarize the data by 1×1 grid square so no region dominates.

Step 3: Graph Tmax, Tmin and Tmean.

The black line is the monthly data. The blue boxes contain the 5 year mean (and I set the 5 year period by just going back from the most recent data in 5 year increments)

The green line is the number of 1×1 grid squares. The blue dashed line is the trend from 1873 (which is the earliest data).

(I won’t count the pre-1900 data as too important since there were so few stations)

Tmax was 1.5C  warmer in the the 1920s/30s/40s than now.

Tmin now is the hottest its been since 1900.

Tmean in the early 40s was slightly warmer than now.

Tmean/Tmin has been warming since 1970 thanks to Tmin … not Tmax.

Click for larger:

Tmax

Canada Monthly Summary Analysis - 1873 to 2015 - Tmax - 1x1 Grid - BC

Tmin

Canada Monthly Summary Analysis - 1873 to 2015 - Tmin - 1x1 Grid - BC

Tmean

Canada Monthly Summary Analysis - 1873 to 2015 - Tmean - 1x1 Grid - BC