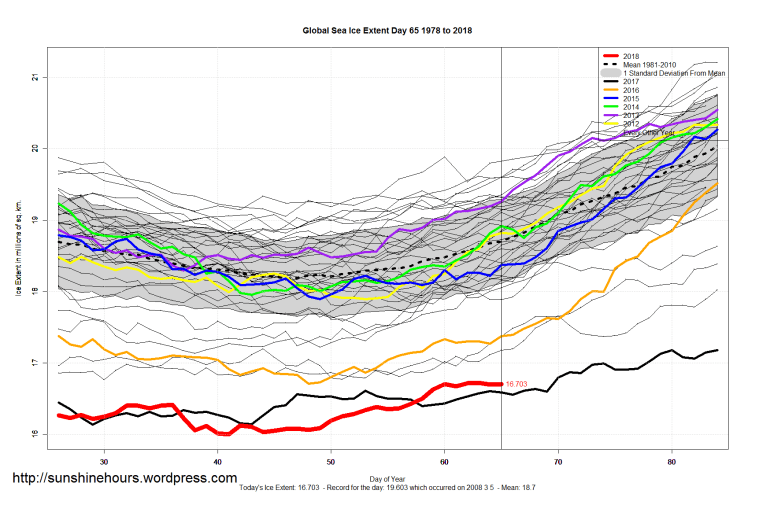
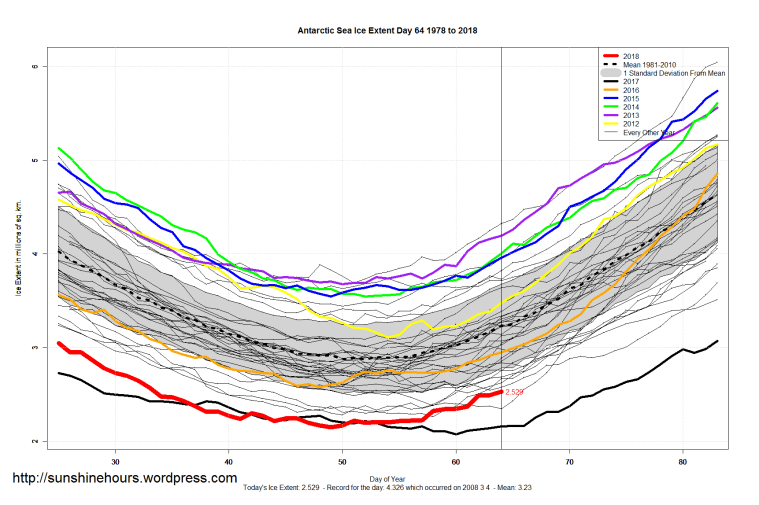
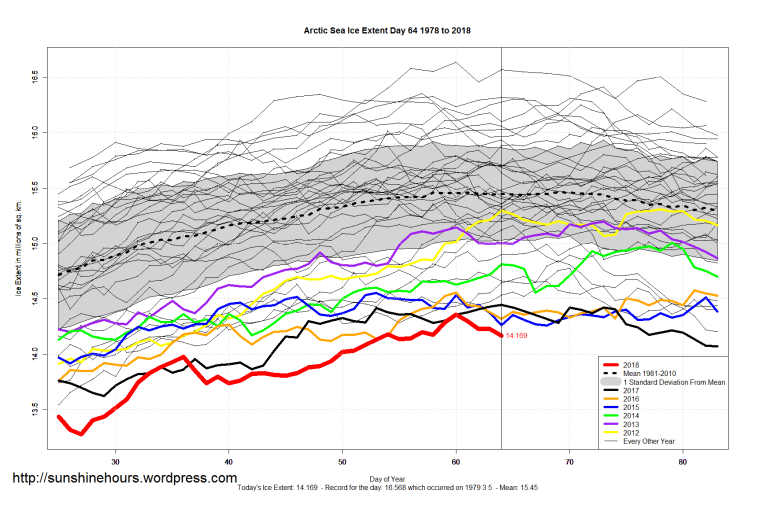
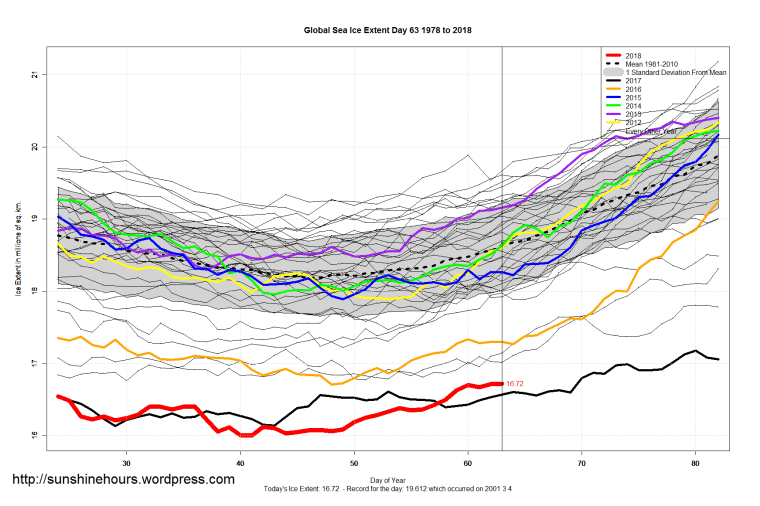
Update: DMI Arctic Temps were high (but still 10C below freezing) … now they aren’t so much.

In my previous post I looked at July averages by decade for Alberta. Go back and read the intro.
In this post I change the selection criteria to allow stations without data in 2017. But kept the other criteria.
I can’t help but think they purged the “hot old” stations to make Albertans think it is getting hotter as of now.
Look at the stations with the 1930s as the hottest decade Tmax July (even with some 2010s data)
| Station | Station No | Records | Min Year | Max Year | pct of data | 2010s | 2000s | 1990s | 1980s | 1970s | 1960s | 1950s | 1940s | 1930s | 1920s | 1910s | 1900s | 1890s | 1880s |
| LETHBRIDGE CDA | 3033890 | 104 | 1908 | 2015 | 96.3 | 33.4 | 35.1 | 31.8 | 33 | 33.4 | 32.7 | 32.8 | 33.5 | 35.1 | 32.9 | 33.5 | 33 | – | – |
| CAMPSIE | 3061200 | 100 | 1913 | 2013 | 99 | 29.8 | 31.8 | 28.8 | 29.9 | 28.6 | 30.4 | 29.9 | 30.8 | 30.7 | 32.1 | 29.3 | – | – | – |
| OLDS | 3024920 | 97 | 1914 | 2013 | 97 | 29.5 | 30.6 | 27.6 | 29.2 | 30.2 | 30.4 | 30.1 | 31.3 | 31.8 | 30.6 | 31.4 | – | – | – |
| RED DEER A | 3025480 | 76 | 1938 | 2013 | 100 | 29.6 | 31.2 | 28.6 | 30.1 | 30.6 | 31.3 | 30.2 | 31.3 | 31.7 | – | – | – | – | – |
| CALGARY INT’L A | 3031093 | 129 | 1884 | 2012 | 100 | 29.6 | 31.8 | 29.8 | 31.2 | 31.6 | 31.2 | 30.5 | 31.6 | 33.8 | 33 | 31.7 | 30 | 32.4 | 30.5 |
| BEAVER MINES | 3050600 | 76 | 1935 | 2011 | 98.7 | 30 | 31.8 | 29.1 | 30.9 | 30.4 | 29.7 | 30.3 | 31.1 | 33.1 | – | – | – | – | – |
| WHITECOURT LO | 3067392 | 63 | 1939 | 2011 | 86.3 | 24.8 | 26.6 | 24.5 | 25.9 | 24.6 | 25.8 | 26 | 27.1 | 28.3 | – | – | – | – | – |
| CARROT CREEK LO | 3061360 | 62 | 1939 | 2011 | 84.9 | 26.5 | 29.7 | 27.1 | 27.8 | 27.6 | 27.2 | 27.2 | 29.4 | 30 | – | – | – | – | – |
| CARWAY | 3031400 | 87 | 1915 | 2010 | 90.6 | 30 | 32.4 | 29.1 | 30.8 | 30.3 | 29.6 | 30.2 | 31.2 | 33.9 | 32 | 31.1 | – | – | – |
| MEDICINE HAT A | 3034480 | 125 | 1884 | 2008 | 100 | – | 36.4 | 33.8 | 34.8 | 35.2 | 34.9 | 36.1 | 36.7 | 38.9 | 36.9 | 36.6 | 35.3 | 36.2 | 34.7 |
| LETHBRIDGE A | 3033880 | 71 | 1938 | 2008 | 100 | – | 35.6 | 32 | 33.4 | 34.3 | 33.9 | 33.8 | 34.9 | 38 | – | – | – | – | – |
| CALMAR | 3011120 | 89 | 1916 | 2007 | 96.7 | – | 30.4 | 27.8 | 29.5 | 29.4 | 30.7 | 30.4 | 31.4 | 31.8 | 31.1 | 29.6 | – | – | – |
| LAKE LOUISE | 3053760 | 88 | 1915 | 2007 | 94.6 | – | 29.5 | 27.8 | 27.7 | 28.5 | 28.7 | 28.5 | 29.6 | 30.5 | 29.5 | 29.2 | – | – | – |
| GLEICHEN | 3032800 | 101 | 1903 | 2005 | 98.1 | – | 34.4 | 31.1 | 33.1 | 33.2 | 32.2 | 31.7 | 32.9 | 35.5 | 32.9 | 32.8 | 31.9 | – | – |
| HIGH RIVER | 3033240 | 95 | 1903 | 2005 | 92.2 | – | 32.5 | 29.1 | 31.2 | 31 | 30.6 | 30.4 | 31.3 | 34.9 | 31.7 | 33.1 | 31 | – | – |
| BEAVERLODGE CDA | 3070560 | 91 | 1913 | 2005 | 97.8 | – | 28.3 | 28.4 | 29.8 | 28.1 | 30.1 | 29.6 | 30.5 | 29.9 | 30.3 | 29 | – | – | – |
| ENTRANCE | 3062440 | 82 | 1918 | 2005 | 93.2 | – | 30.2 | 29.8 | 31.3 | 30.1 | 30.2 | 30.4 | 32.3 | 32.7 | 32.2 | 33.2 | – | – | – |
| SION | 3015960 | 88 | 1911 | 2004 | 93.6 | – | 30.9 | 28.7 | 29.8 | 28.6 | 30.3 | 30.7 | 32 | 31.7 | 31 | 30.3 | – | – | – |
| CARDSTON | 3031320 | 82 | 1919 | 2004 | 95.3 | – | 34.7 | 30.5 | 32.1 | 32.2 | 31.5 | 32.3 | 32.4 | 35.3 | 32.8 | 36.1 | – | – | – |
| FOREMOST | 3032640 | 82 | 1919 | 2004 | 95.3 | – | 36.5 | 33 | 34.1 | 34.1 | 34 | 35.7 | 36.3 | 38.7 | 35.7 | 39.4 | – | – | – |
| EDMONTON CITY CENTRE A | 3012208 | 67 | 1938 | 2004 | 100 | – | 31.9 | 29.1 | 30.7 | 30.5 | 30.9 | 31 | 31.2 | 31.4 | – | – | – | – | – |
| VIKING | 3016840 | 66 | 1923 | 1997 | 88 | – | – | 30.1 | 31.6 | 31.6 | 31.7 | 32.1 | 32.7 | 32.9 | 33 | – | – | – | – |
| ELK POINT | 3012280 | 79 | 1912 | 1996 | 92.9 | – | – | 30.1 | 30.6 | 29.2 | 31.2 | 31.6 | 31.8 | 32.4 | 31.6 | 32 | – | – | – |
| JASPER | 3053520 | 64 | 1927 | 1995 | 92.8 | – | – | 29.1 | 30.2 | 31.2 | 31.3 | 31.3 | 32.4 | 31.1 | 32.2 | – | – | – | – |
| BANFF | 3050520 | 102 | 1890 | 1994 | 97.1 | – | – | 29.4 | 29.9 | 30.2 | 29.6 | 29.9 | 29.9 | 31.6 | 31.4 | 30.4 | 29.2 | 29.3 | – |
| LACOMBE CDA | 3023720 | 86 | 1908 | 1993 | 100 | – | – | 27.6 | 30.1 | 30.1 | 31.6 | 30.7 | 33.3 | 33.7 | 33.3 | 29.8 | 29.1 | – | – |
| PEKISKO | 3055120 | 83 | 1905 | 1992 | 94.3 | – | – | 26.7 | 29.7 | 29.1 | 28.3 | 28.8 | 29.3 | 31.9 | 29.7 | 29.6 | 32.2 | – | – |
| RANFURLY | 3015400 | 86 | 1905 | 1991 | 98.9 | – | – | 32 | 30.6 | 29.2 | 30.8 | 30.9 | 32.9 | 32.9 | 35.5 | 30.4 | 28.3 | – | – |
| FAIRVIEW | 3072520 | 60 | 1932 | 1991 | 100 | – | – | 31.5 | 29.1 | 27.4 | 29.9 | 29.3 | 30.5 | 29 | – | – | – | – | – |
| MANYBERRIES CDA | 3044200 | 62 | 1929 | 1990 | 100 | – | – | 36 | 34.8 | 34.5 | 33.9 | 35.1 | 35.6 | 37.8 | 34.8 | – | – | – | – |
| CALDWELL | 3031000 | 56 | 1932 | 1990 | 94.9 | – | – | 29 | 31.1 | 30.7 | 29.4 | 30.6 | 32.9 | 33.7 | – | – | – | – | – |
| FORT MACLEOD | 3032680 | 94 | 1876 | 1987 | 83.9 | – | – | – | 33.4 | 33.2 | 32.9 | 33.8 | 34.8 | 36.9 | 34.6 | 34.7 | 33.4 | 35.5 | – |
| FORT VERMILION CDA | 3072720 | 78 | 1908 | 1985 | 100 | – | – | – | 30.7 | 29.3 | 30.7 | 30.2 | 32 | 31.1 | 31.6 | 30.7 | 30.5 | – | – |
| HANNA | 3023000 | 54 | 1921 | 1984 | 84.4 | – | – | – | 37 | 31.4 | 32.8 | 33.2 | 33.5 | 35.1 | 33.4 | – | – | – | – |
| KEG RIVER | 3073640 | 43 | 1935 | 1979 | 95.6 | – | – | – | – | 29.4 | 30 | 30.8 | 31.5 | 30.1 | – | – | – | – | – |
| THREE HILLS | 3026480 | 56 | 1921 | 1977 | 98.2 | – | – | – | – | 33.5 | 33.3 | 32.5 | 33.8 | 35.4 | 35 | – | – | – | – |
| WASTINA HEMARUKA | 3016960 | 60 | 1913 | 1976 | 93.8 | – | – | – | – | 32.4 | 32.6 | 32.2 | 35.3 | 37.2 | 34.7 | 31.3 | – | – | – |
| STETTLER | 3016120 | 57 | 1919 | 1976 | 98.3 | – | – | – | – | 29.7 | 32.2 | 32 | 33.2 | 34.7 | 30.2 | 32.2 | – | – | – |
| HIGH PRAIRIE | 3063160 | 47 | 1927 | 1976 | 94 | – | – | – | – | 26.6 | 30.3 | 29.2 | 31.9 | 30.8 | 29.5 | – | – | – | – |
| IRON RIVER | 3083480 | 49 | 1925 | 1975 | 96.1 | – | – | – | – | 28.8 | 30.7 | 30.6 | 30.7 | 30.7 | 31.1 | – | – | – | – |
| WETASKIWIN | 3017280 | 69 | 1903 | 1974 | 95.8 | – | – | – | – | 29.3 | 31.4 | 31.1 | 32.2 | 33 | 31.8 | 30.6 | 28.7 | – | – |
| HUGHENDEN | 3013360 | 35 | 1935 | 1971 | 94.6 | – | – | – | – | 30 | 32.4 | 33.8 | 34.4 | 35 | – | – | – | – | – |
| LLOYDMINSTER | 3013960 | 51 | 1913 | 1970 | 87.9 | – | – | – | – | 30 | 31.8 | 32.9 | 32.5 | 33.3 | 34.1 | 30.4 | – | – | – |
| BROOKS 1 | 3030840 | 56 | 1912 | 1968 | 98.2 | – | – | – | – | – | 33.3 | 33.2 | 35.2 | 36 | 34.2 | 33.1 | – | – | – |
| DRUMHELLER | 3022120 | 36 | 1923 | 1967 | 80 | – | – | – | – | – | 34.5 | 35 | 35.6 | 37.2 | 34.7 | – | – | – | – |
| ATHABASCA | 3060320 | 42 | 1918 | 1965 | 87.5 | – | – | – | – | – | 31.6 | 31.7 | 32.5 | 30.7 | 32.2 | 35 | – | – | – |
| NACO | 3014760 | 35 | 1930 | 1965 | 97.2 | – | – | – | – | – | 32.7 | 32.9 | 35.2 | 36.5 | – | – | – | – | – |
| PINCHER CREEK TOWN | 3035220 | 64 | 1894 | 1962 | 92.8 | – | – | – | – | – | 32.8 | 31.9 | 32.3 | 33.7 | 30.7 | 30.5 | 31.2 | 30.7 | – |
| STRATHMORE | 3036200 | 49 | 1912 | 1962 | 96.1 | – | – | – | – | – | 31.9 | 30.4 | 32.1 | 34.2 | 32.9 | 30.6 | – | – | – |
| SLAVE LAKE | 3066000 | 36 | 1925 | 1962 | 94.7 | – | – | – | – | – | 29.8 | 29.8 | 30.2 | 30.6 | 28.7 | – | – | – | – |
| ANTHRACITE | 3050240 | 33 | 1929 | 1961 | 100 | – | – | – | – | – | 31.9 | 29.1 | 30.4 | 32 | 31.7 | – | – | – | – |
| HILLSDOWN | 3023280 | 56 | 1904 | 1960 | 98.2 | – | – | – | – | – | 33.9 | 29.8 | 30 | 32.1 | 32.7 | 29.4 | 29.1 | – | – |
| EDSON | 3062240 | 43 | 1916 | 1959 | 97.7 | – | – | – | – | – | – | 29.6 | 30.4 | 32 | 32.6 | 31.8 | – | – | – |
| BUFFALO HEAD PRAIRIE | 3070960 | 27 | 1933 | 1959 | 100 | – | – | – | – | – | – | 30.6 | 31.2 | 30.2 | – | – | – | – | – |
| LUNDBRECK | 3054080 | 39 | 1913 | 1958 | 84.8 | – | – | – | – | – | – | 29.4 | 30.9 | 33.9 | 30.1 | 30.1 | – | – | – |
| THORSBY | 3016440 | 26 | 1932 | 1958 | 96.3 | – | – | – | – | – | – | 29.7 | 31.7 | 31.8 | – | – | – | – | – |
| SPRINGDALE | 3026080 | 42 | 1913 | 1956 | 95.5 | – | – | – | – | – | – | 30.5 | 30.1 | 30.3 | 30.2 | 29 | – | – | – |
| VAUXHALL | 3036680 | 42 | 1914 | 1956 | 97.7 | – | – | – | – | – | – | 35 | 34.3 | 36.7 | 34.7 | 35.9 | – | – | – |
| NORDEGG | 3054840 | 36 | 1916 | 1954 | 92.3 | – | – | – | – | – | – | 30.2 | 28.9 | 28.8 | 29.4 | 28.6 | – | – | – |
| ELMWORTH | 3072320 | 26 | 1927 | 1952 | 100 | – | – | – | – | – | – | 31.5 | 31.4 | 30.1 | 29.3 | – | – | – | – |
| RADWAY | 3015345 | 27 | 1923 | 1951 | 93.1 | – | – | – | – | – | – | 34.2 | 32.6 | 31.3 | 30.8 | – | – | – | – |
| ALIX | 3020120 | 43 | 1906 | 1949 | 97.7 | – | – | – | – | – | – | – | 34.7 | 36.4 | 34.4 | 31.1 | 28.1 | – | – |
| FT MCMURRAY | 3062695 | 31 | 1910 | 1944 | 88.6 | – | – | – | – | – | – | – | 34.2 | 32.1 | 32.7 | 32.6 | 34.4 | – | – |
| GROUARD | 3062965 | 30 | 1914 | 1944 | 96.8 | – | – | – | – | – | – | – | 31.7 | 30.2 | 31.1 | 31 | – | – | – |
| EDMONTON | 3012195 | 61 | 1880 | 1942 | 96.8 | – | – | – | – | – | – | – | 31.1 | 32.4 | 31.8 | 29.4 | 29.2 | 30.6 | 30.1 |
| HARMATTAN | 3023055 | 30 | 1908 | 1938 | 96.8 | – | – | – | – | – | – | – | – | 31.9 | 30.4 | 29.1 | 26.7 | – | – |
| PERBECK | 3025170 | 25 | 1913 | 1938 | 96.2 | – | – | – | – | – | – | – | – | 35.7 | 33.6 | 32.4 | – | – | – |
I posted some data about temperatures in Edmonton and Alberta. I wanted to visualize it. So I’ve made a grid.
The source of the data is Environment Canadas monthly summaries.
I’m using Tmax, not Tmean. (The logic being that max temps are the problem)
And I’m starting with the July only average for the decade. (I’ll expand in later posts).
There are 1087 stations with July data in Alberta.
I’m narrowing it down to stations with 25 years of data and data all the way up to 2017 and 80% complate.
Things to note:
Only 29 stations make the cut. Only 1 station has the 2010s as the decade with the hottest July average Tmax.
Only 2 stations have data from the 1940s (none before that).
So … AGW ain’t going to kill Albertans in July. They already survived July in the 2000s.
And there isn’t any stations with old and new data. (By that I mean the 30s).
| Station |
Station No |
Records | Min Year | Max Year | pct of data | 2010s | 2000s | 1990s | 1980s | 1970s | 1960s | 1950s | 1940s | 1930s | 1920s | 1910s | 1900s | 1890s | 1880s |
| KANANASKIS | 3053600 | 77 | 1940 | 2017 | 98.7 | 30.4 | 31.1 | 28.3 | 30.1 | 29.3 | 28.8 | 29.3 | 29.9 | – | – | – | – | – | – |
| CAMROSE | 3011240 | 70 | 1946 | 2017 | 97.2 | 29.9 | 31.6 | 28.7 | 30 | 29.1 | 31.1 | 31.2 | 30.9 | – | – | – | – | – | – |
| COLD LAKE A | 3081680 | 65 | 1953 | 2017 | 100 | 30.2 | 31.2 | 29.8 | 30 | 29.3 | 31.4 | 30.9 | – | – | – | – | – | – | – |
| FORT SASKATCHEWAN | 3012710 | 58 | 1958 | 2017 | 96.7 | 31.4 | 32 | 29 | 30.3 | 29.9 | 31.6 | 33.9 | – | – | – | – | – | – | – |
| CRAIGMYLE | 3021940 | 52 | 1960 | 2017 | 89.7 | 31.8 | 33.5 | 30.3 | 32.8 | 32.6 | 32.7 | – | – | – | – | – | – | – | – |
| EDMONTON STONY PLAIN | 301222F | 52 | 1966 | 2017 | 100 | 29.8 | 30.8 | 27.8 | 29.2 | 28.4 | 28.6 | – | – | – | – | – | – | – | – |
| QUEENSTOWN | 3035340 | 51 | 1967 | 2017 | 100 | 31.9 | 33.3 | 31.4 | 33.8 | 34.2 | 32.2 | – | – | – | – | – | – | – | – |
| FORESTBURG PLANT SITE | 3012652 | 50 | 1968 | 2017 | 100 | 31.7 | 34 | 30.9 | 32.6 | 31.8 | 31.7 | – | – | – | – | – | – | – | – |
| HIGH LEVEL A | 3073146 | 47 | 1971 | 2017 | 100 | 30.9 | 29.9 | 29.7 | 29.8 | 29.2 | – | – | – | – | – | – | – | – | – |
| SIMONETTE | 3075937 | 44 | 1974 | 2017 | 100 | 28.9 | 30 | 29.1 | 29.3 | 28.6 | – | – | – | – | – | – | – | – | – |
| VEGREVILLE | 3016GF0 | 37 | 1981 | 2017 | 100 | 30.7 | 31.3 | 29.7 | 30.3 | – | – | – | – | – | – | – | – | – | – |
| FABYAN | 3012515 | 36 | 1981 | 2017 | 97.3 | 29.9 | 32.2 | 29.7 | 31.9 | – | – | – | – | – | – | – | – | – | – |
| LLOYDMINSTER A | 3013961 | 36 | 1982 | 2017 | 100 | 29.4 | 31.6 | 29.6 | 31.7 | – | – | – | – | – | – | – | – | – | – |
| ELK ISLAND NAT PARK | 3012275 | 33 | 1982 | 2017 | 91.7 | 30.8 | 31.3 | 29.9 | 29.4 | – | – | – | – | – | – | – | – | – | – |
| BRULE BLACK CAT | 3060903 | 31 | 1987 | 2017 | 100 | 30.7 | 31 | 28.8 | 29.8 | – | – | – | – | – | – | – | – | – | – |
| PICTURE BUTTE WEST | 303N1G3 | 31 | 1987 | 2017 | 100 | 33.6 | 34.6 | 31.3 | 33.2 | – | – | – | – | – | – | – | – | – | – |
| ENTWISTLE | 3062451 | 30 | 1988 | 2017 | 100 | 29.9 | 31.3 | 29.1 | 29.8 | – | – | – | – | – | – | – | – | – | – |
| UNIVERSITY OF ALBERTA METABOLIC CENTRE | 301FFNJ | 30 | 1987 | 2017 | 96.8 | 31.8 | 32.2 | 29.5 | 30.8 | – | – | – | – | – | – | – | – | – | – |
| OKOTOKS | 303M9JM | 28 | 1990 | 2017 | 100 | 32.8 | 33.3 | 29.9 | – | – | – | – | – | – | – | – | – | – | – |
| BROOKS | 3030QLP | 26 | 1989 | 2017 | 89.7 | 33.3 | 35 | 33.2 | 34 | – | – | – | – | – | – | – | – | – | – |
| BOW ISLAND | 3030768 | 25 | 1993 | 2017 | 100 | 33.7 | 34.3 | 31.6 | – | – | – | – | – | – | – | – | – | – | – |
| BOW VALLEY | 3050778 | 25 | 1993 | 2017 | 100 | 32.1 | 32.2 | 29.1 | – | – | – | – | – | – | – | – | – | – | – |
| COP UPPER | 3031875 | 25 | 1993 | 2017 | 100 | 31.1 | 31.3 | 28.5 | – | – | – | – | – | – | – | – | – | – | – |
| CROWSNEST | 3051R4R | 25 | 1993 | 2017 | 100 | 31 | 32 | 29.1 | – | – | – | – | – | – | – | – | – | – | – |
| ESTHER 1 | 301B460 | 25 | 1993 | 2017 | 100 | 32.9 | 34.8 | 32.3 | – | – | – | – | – | – | – | – | – | – | – |
| LACOMBE CDA 2 | 3023722 | 25 | 1993 | 2017 | 100 | 30.1 | 31.3 | 28.4 | – | – | – | – | – | – | – | – | – | – | – |
| SUNDRE A | 3026KNQ | 25 | 1993 | 2017 | 100 | 30.6 | 31.1 | 28.5 | – | – | – | – | – | – | – | – | – | – | – |
| THREE HILLS | 3026479 | 25 | 1993 | 2017 | 100 | 30.7 | 32.5 | 29.9 | – | – | – | – | – | – | – | – | – | – | – |
| VAUXHALL CDA CS | 3036682 | 25 | 1993 | 2017 | 100 | 33.6 | 34.8 | 32.8 | – | – | – | – | – | – | – | – | – | – | – |
I was looking over Alberta weather data (Environment Canada monthly summaries) because some article said Edmonton was warming by some godawful amount.
When I looked at Edmonton weather data I found 23 stations. Some old, some recent, some only running for a few years.
I looked at EDMONTON CITY CENTRE A – 1937 to 2005 – average of 11.9 records per year. Pretty complete.
I know, no data from 2010s. But the 1980s were hottest.
1980s 4.3
1990s 3.9
2000s 3.8
1970s 3.4
1960s 3.0
1940s 2.7
1950s 2.6
1930s 2.2
EDMONTON STONY PLAIN 1966 to 2018 – 12
2010s 4.3
2000s 4.1
1980s 3.8
1990s 3.8
1960s 2.7
1970s 2.6
2010s aren’t over.
Then I went looking for some old/new data in Alberta with long runs just to get a feel for the province.
MEDICINE HAT A – 1883 to 2008 11.9 record per year. Again, no 2010s. Tragic that EC let old long stations die off.
1910s 6.4
1920s 6.2
1980s 6.2
2000s 6.2
1900s 6.0
1990s 5.9
1930s 5.8
1880s 5.3
1940s 5.3
1960s 5.3
1970s 5.0
1950s 4.9
1890s 4.7
I’ll do some more like this.
Sometimes you gotta laugh.
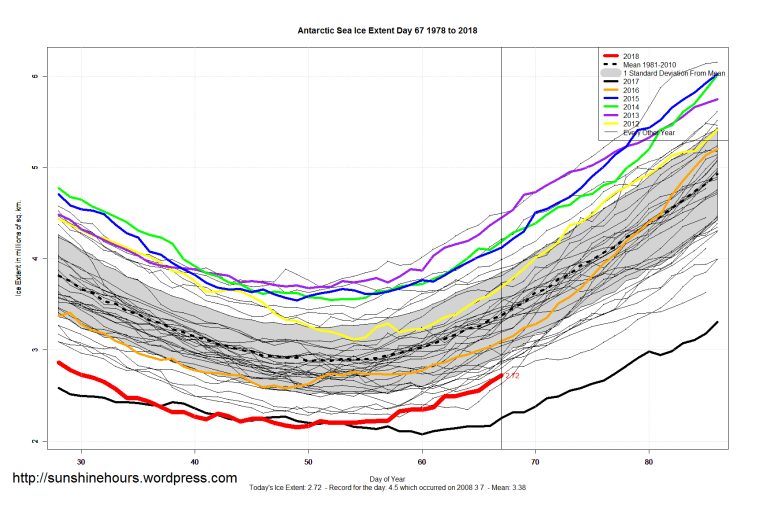
Penguins are in trouble because of AGW … then they find 1.5 million they knew nothing about doing just fine.
“Researchers are stunned to find such a large number in the remote Danger Islands, seemingly unaffected by climate change.”
“Just 100 miles away, on the peninsula’s west, Adelie numbers have dropped by around 70% in recent decades due to melting sea ice, something blamed on global warming.”
Maybe they just moved?
https://news.sky.com/story/massive-colony-of-15-million-adelie-penguins-found-in-antarctica-11273522