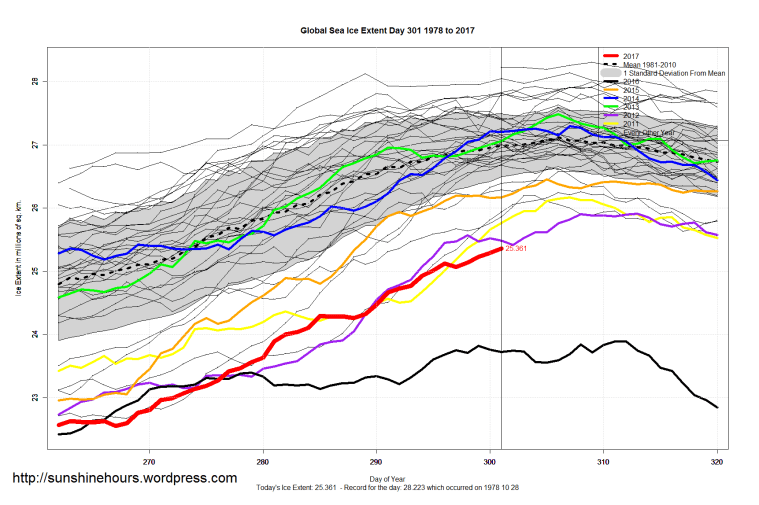
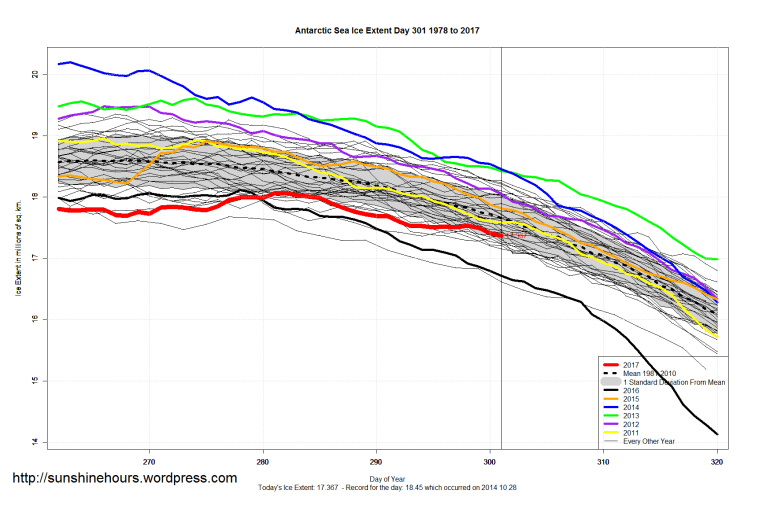
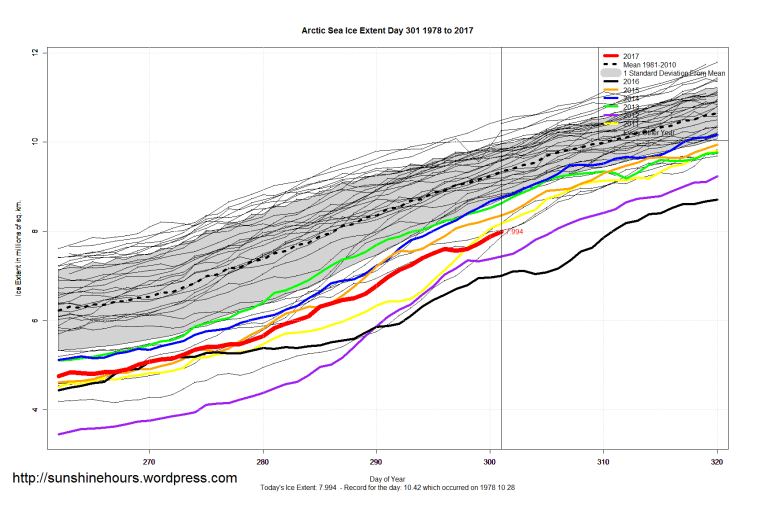
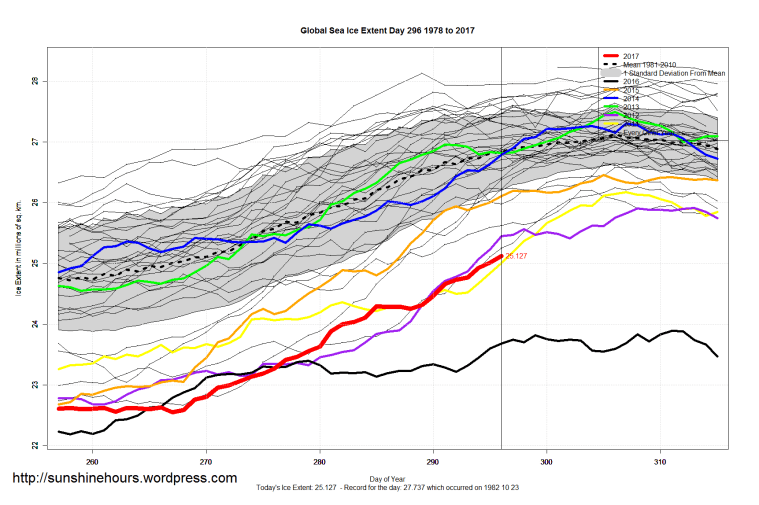
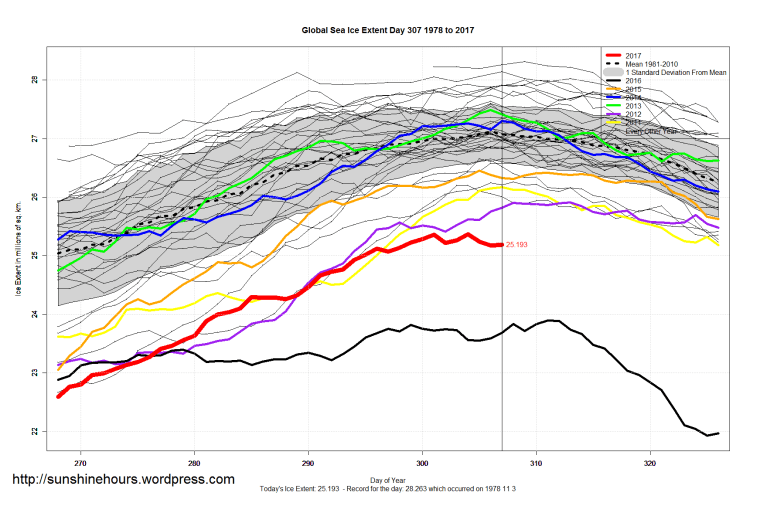
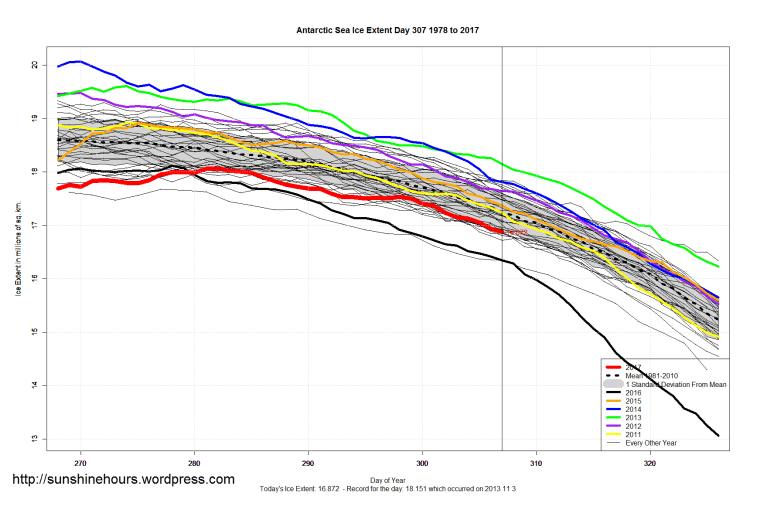
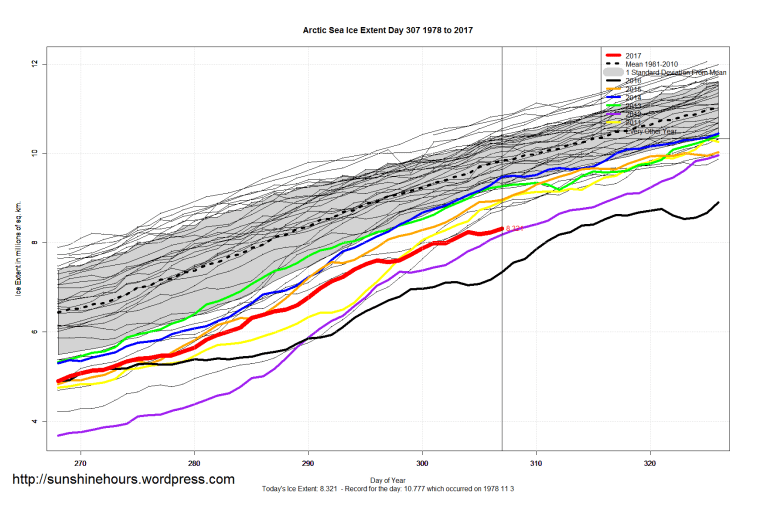
All graphs are way higher on day 307 than they were on the same day in 2016.
National Post has published some maps claiming Canada is going to suffer from “scorching summers”.
I’ve hit my online paper article limit so I’ll post the tweet.
The animated gif starts with a scary January, lots of red. And article/tweet predicts “warm winters, scorching summers”.
Note that they are using “mean temperatures”, not maximums.
But if you capture the monthly images , when do you notice about the summer months?
June/July/Aug are not scary and all red. They are pretty high up on the scale (which means the lowest change)
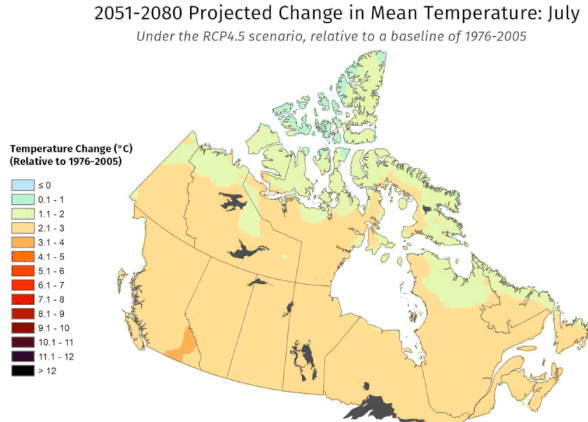
And I repeat. This is mean temperatures. Not max. And having looked at the data I know many of the BC cities have a very low rate of maximum change versus minimum.
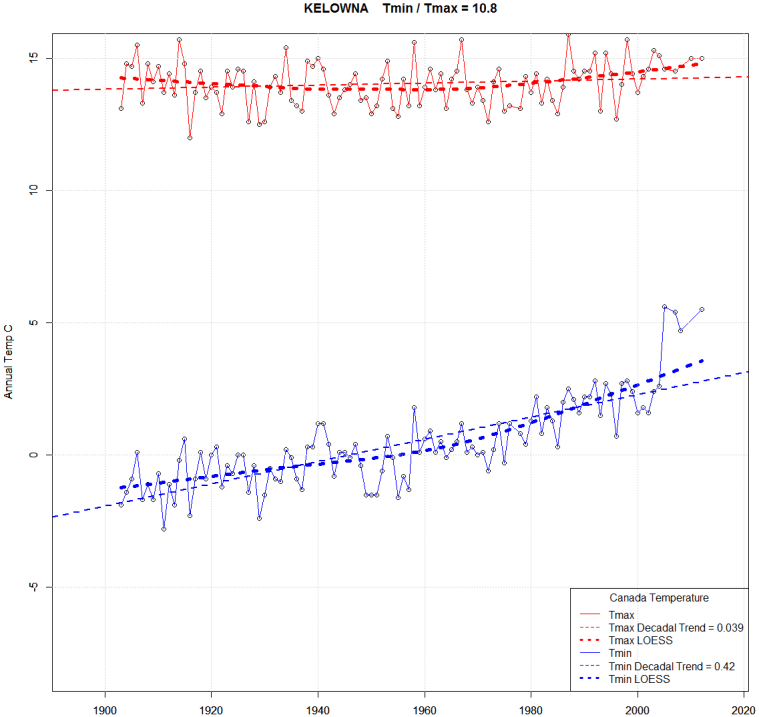
It is the minimums that are climbing in a lot of cities and the max isn’t.
Here is my original hometown of Kelowna. Tmax has barely changed since 1900 (and in fact dropped from 1900 to 1950 and then climbed a bit since then.
The ratio of Tmin change to Tmax change is 10.8 to 1. Look at the Tmin climb. Huge. 7C warmer.
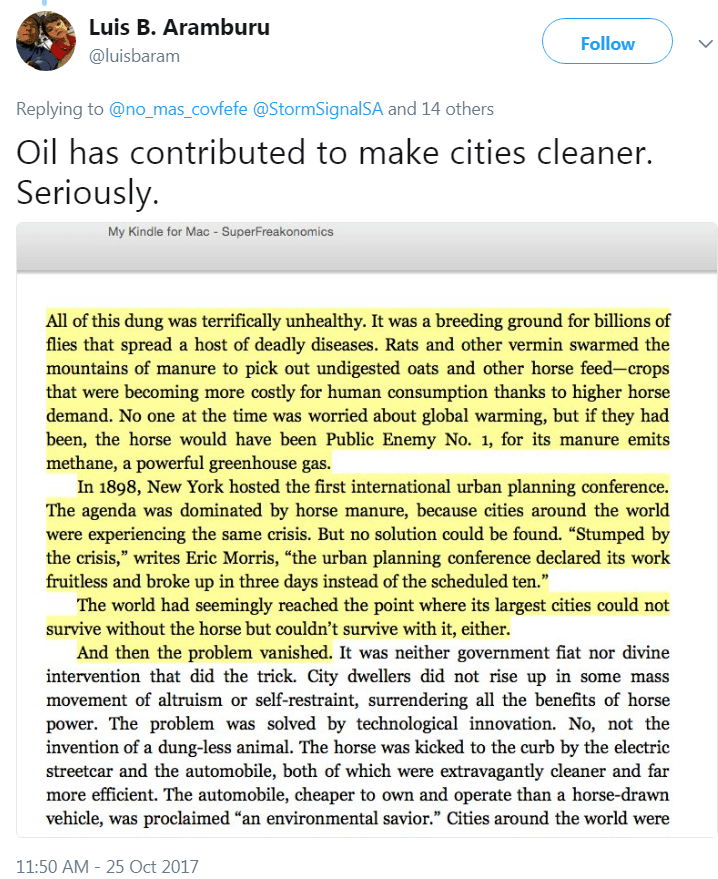
When some AGW cultists talks about the “cost of carbon”, shove this quote about dung in their face.
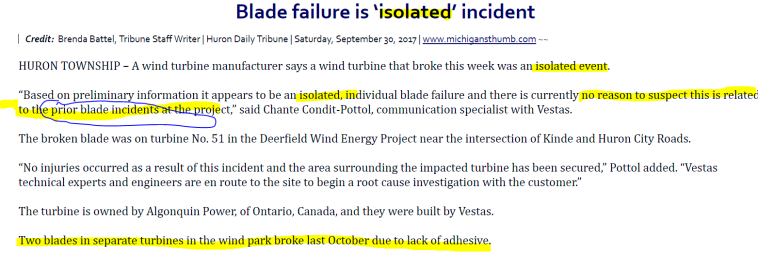
The wind turbine blades did poorly in Puerto Rico.