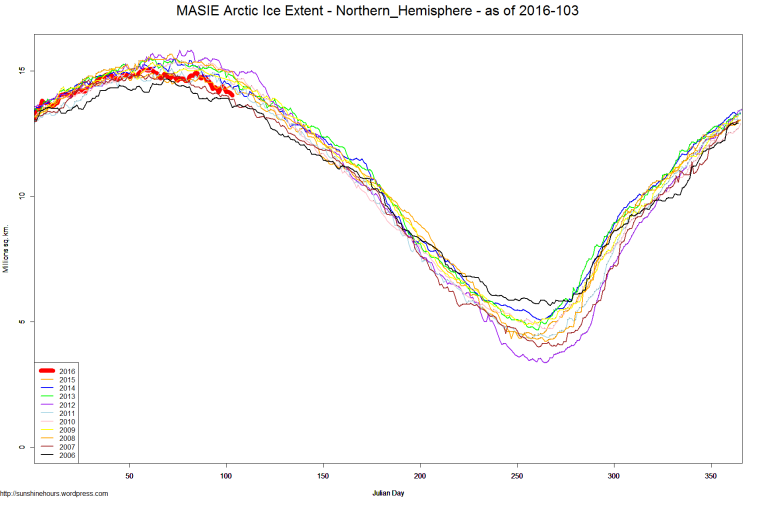
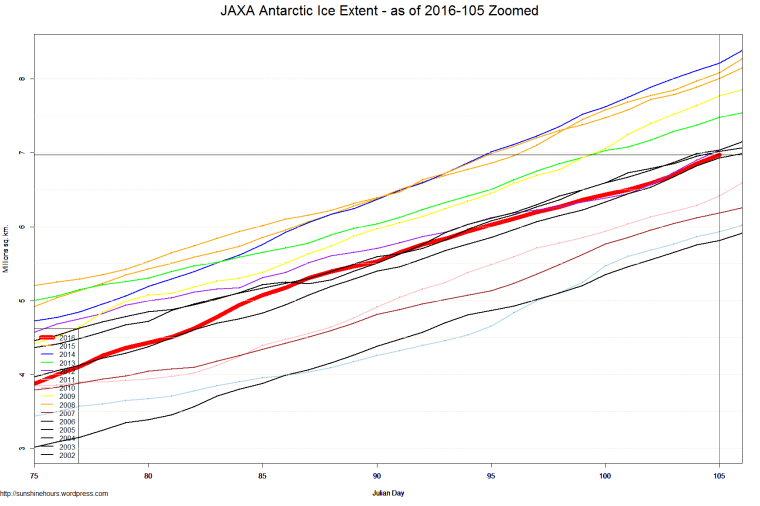
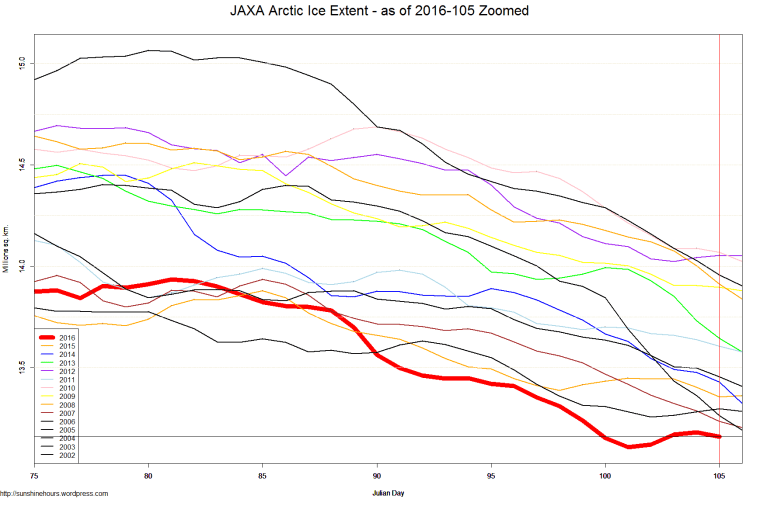
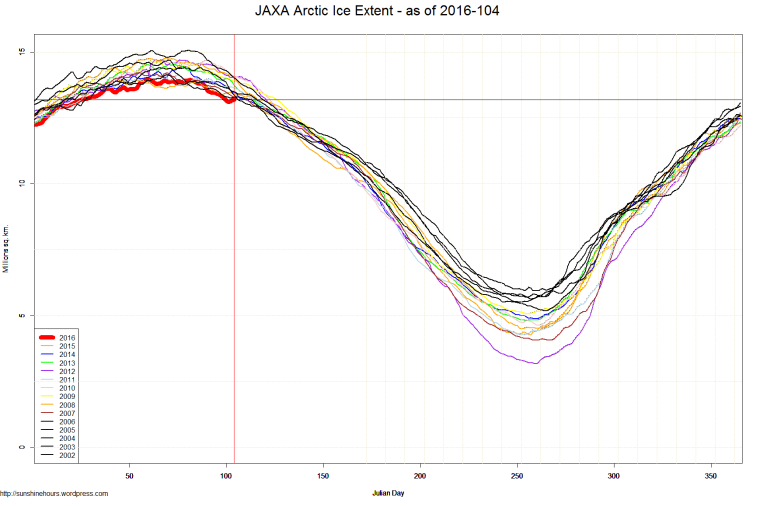
JAXA is sea ice extent data from Japan (only goes back to 2002).
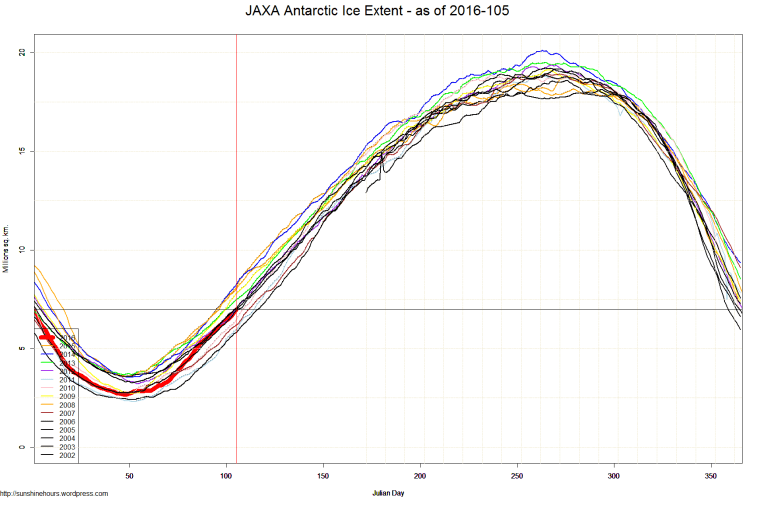

JAXA is sea ice extent data from Japan (only goes back to 2002).
If you have been following this blog, you know the NSIDC satellite data has been very bad. Off by millions of sq km.
So I will be posting graphs for sea ice extent using data from JAXA (only goes back to 2002).

Finlandia Vodka has decided to “Protect Our Winters”.
There is no denying that for the past decade, our winters have gradually become shorter and warmer, creating vast changes in the landscape of Canada’s climate. Finlandia Vodka (Finlandia) is pleased to be joining forces with Protect Our Winters (POW), the leading climate change advocacy group for the snow sports community, in an effort to reduce the effects of global climate change. Finlandia believes that if you are kind to nature, it will return the favour, and has decided to join the movement against climate change by donating one per cent of its total April sales from the British Columbia market to POW.
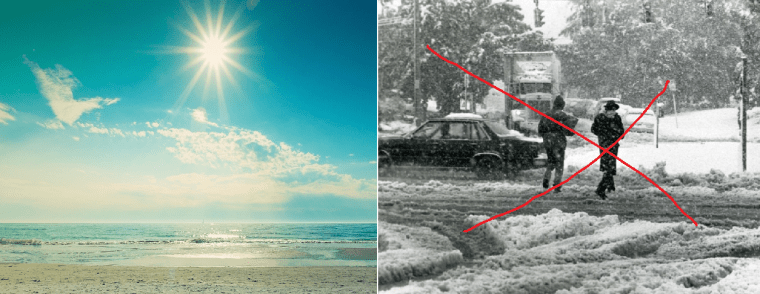
I live in BC. I hate long cold wet winters.
Screw Finlandia. Screw long cold wet snowy winters.
I want long, hot, glorious summers with lots of swimming and barbecues and baking in the sun!
Boycott Finlandia.
I was reading this article on Greenland melting. And then I read this:
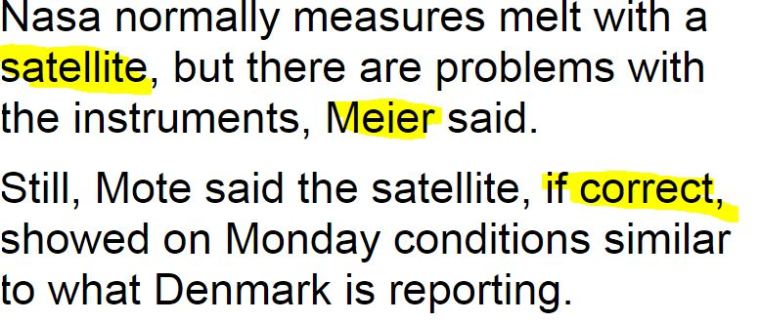
Meier is (I assume) Walt Meier of the NSIDC.
Ok … so the satellite that was producing spurious massive jumps in Arctic/Antarctic Sea Ice is being used to confirm the melting of Greenland despite being told the satellite is broken.
Yup. Sounds typical.
On Monday and Tuesday, about 12 per cent of the ice sheet surface area — 656,000 square miles or 1.7 million square kilometers — showed signs of melting ice, according to Peter Langen, a climate scientist at the Danish Meteorological Institute.
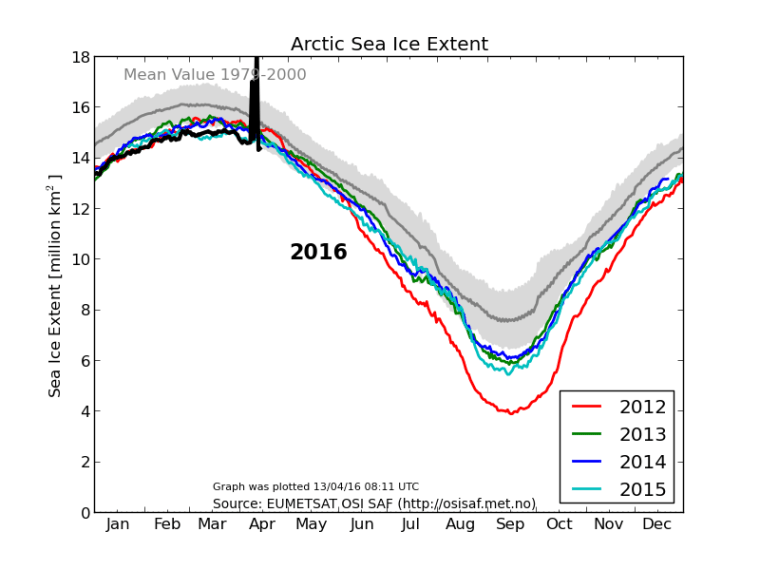
This is the DMI graph of the arctic sea ice extent using data from the same satellite … I think.
Wait. This just in.(I’m flabbergasted).
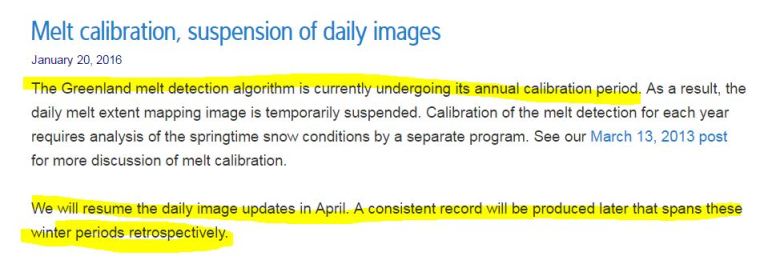
Greenland Surface Melt dataset produced by:
DMSP 5D-2/F11, DMSP 5D-2/F13, DMSP 5D-2/F8, DMSP 5D-3/F17, NIMBUS-7
F17 is the satellite producing spurious sea ice data.
The U.S. Department of Energy published data last week with some amazing revelations — so amazing that most Americans will find them hard to believe. As a nation, the United States reduced its carbon emissions by 2 percent from last year. Over the past 14 years, our carbon emissions are down more than 10 percent. On a per-unit-of-GDP basis, U.S. carbon emissions are down by closer to 20 percent.
Even more stunning: We’ve reduced our carbon emissions more than virtually any other nation in the world, including most of Europe.
How can this be? We never ratified the Kyoto Treaty. We never adopted a national cap-and-trade system, or a carbon tax, as so many of the sanctimonious Europeans have done.
The answer isn’t that the EPA has regulated CO2 out of the economy. With strict emission standards, the EPA surely has started to strangle our domestic industries, such as coal, and our electric utilities. But that’s not the big story here.
The primary reason carbon emissions are falling is because of hydraulic fracturing — or fracking. Some readers now are probably thinking I’ve been drinking or have lost my mind. Fracking technology for shale oil and gas drilling is supposed to be evil. Some states have outlawed it. Hillary Clinton and Bernie Sanders have come out against it in recent weeks. Schoolchildren have been bombarded with green propaganda about all the catastrophic consequences of fracking.
This free fall in prices means that America is using far more natural gas for heating and electricity and much less coal. Here is how the International Energy Agency put it: “In the United States, (carbon) emissions declined by 2 percent, as a large switch from coal to natural gas use in electricity generation took place.”
… read the rest …
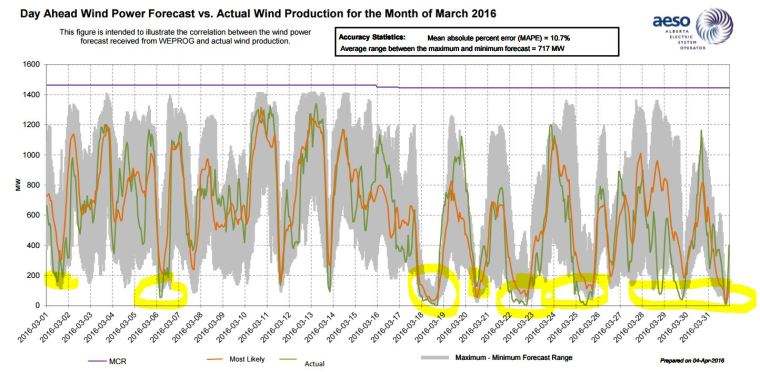
As some of you my have noticed I like to mock the idea that wind can take over for fossil fuels.
Here is the Actual Wind Production versus the day ahead prediction.
Purple is the the 1450MW of power wind could generate (and never does).
Green is actual. Notice it goes to zero 4 times and under 200MW a bunch of times.
And several of those low stretches last a whole day!
If you have been following this blog, you know the NSIDC satellite data has been very bad. Off by millions of sq km.
As of this morning the data file his missing all data past March 31 2016. And NSIDC posted this:
NSIDC has suspended daily sea ice extent updates until further notice, due to issues with the satellite data used to produce these images. The vertically polarized 37 GHz channel (37V) of the Special Sensor Microwave Imager and Sounder (SSMIS) on the Defense Meteorological Satellite Program (DMSP) F-17 satellite that provides passive microwave brightness temperatures is providing spurious data. The 37V channel is one of the inputs to the sea ice retrieval algorithms, so this is resulting in erroneous estimates of sea ice concentration and extent. The problem was initially seen in data for April 5 and all data since then are unreliable, so we have chosen to remove all of April from NSIDC’s archive.
It is unknown at this time if or when the problem with F-17 can be fixed. In the event that the sensor has permanently failed, NSIDC is working to transition to either the DMSP F-18 or possibly the JAXA Advanced Microwave Scanning Radiometer 2 (AMSR2) on the Global Change Observation Mission – Water (GCOM-W) satellite. Transitioning to a different satellite will require a careful calibration against the F-17 data to ensure consistency over the long-term time series. While this transition is of high priority, NSIDC has no firm timeline on when it will be able to resume providing the sea ice time series. For background information on the challenges of using data in near-real-time, see the ASINA FAQ, “Do your data undergo quality control?”
Wow. CO2 to the rescue!
Rising levels of carbon dioxide in the atmosphere are accelerating the growth of B.C.’s forests by one to three per cent a year, enough to cancel out the impact on the climate from the mountain pine beetle outbreak by 2020, according to a new study from the Pacific Institute for Climate Solutions.
“This turnaround will happen much sooner than we had imagined,” said lead author and Environment Canada climate scientist Vivek Arora.
The pine beetle infestation, which killed countless trees over 18 million hectares, had a double impact — dramatically reducing the ability of western Canadian forests to store carbon, and worse, releasing massive quantities of carbon as dead stands of pine rotted or burned. The combined effect turned B.C. forests from a carbon sink (a reservoir) into a carbon source during the peak years of the outbreak between 2009 to 2011, said co-author Werner Kurz of the Canadian Forest Service. 
Computer models estimate that B.C. forests stored 328 million tonnes less carbon dioxide and released in excess of one billion tonnes of CO2 into the atmosphere during the outbreak, which began in 1999.
However, the effects of global warming — rising temperatures, higher rainfall, and an atmosphere richer in carbon dioxide — have created a “fertilization effect” which has accelerated the growth of trees, especially in the high-latitude forests that cover much of Canada, Russia and Europe.
Relatively cool temperatures in Canadian forests typically limit tree growth and carbon uptake to less than half the rate seen in tropical latitudes. But that is beginning to change.
New research suggests that climate change has increased the rate of growth and carbon storage in our forests, so much so that an additional one billion tonnes of carbon dioxide will be stored by our trees between the pine beetle outbreak and 2020.
Trees are smart enough to use the CO2. Humans are dumb enough to want to store it in CCS facilities underground.