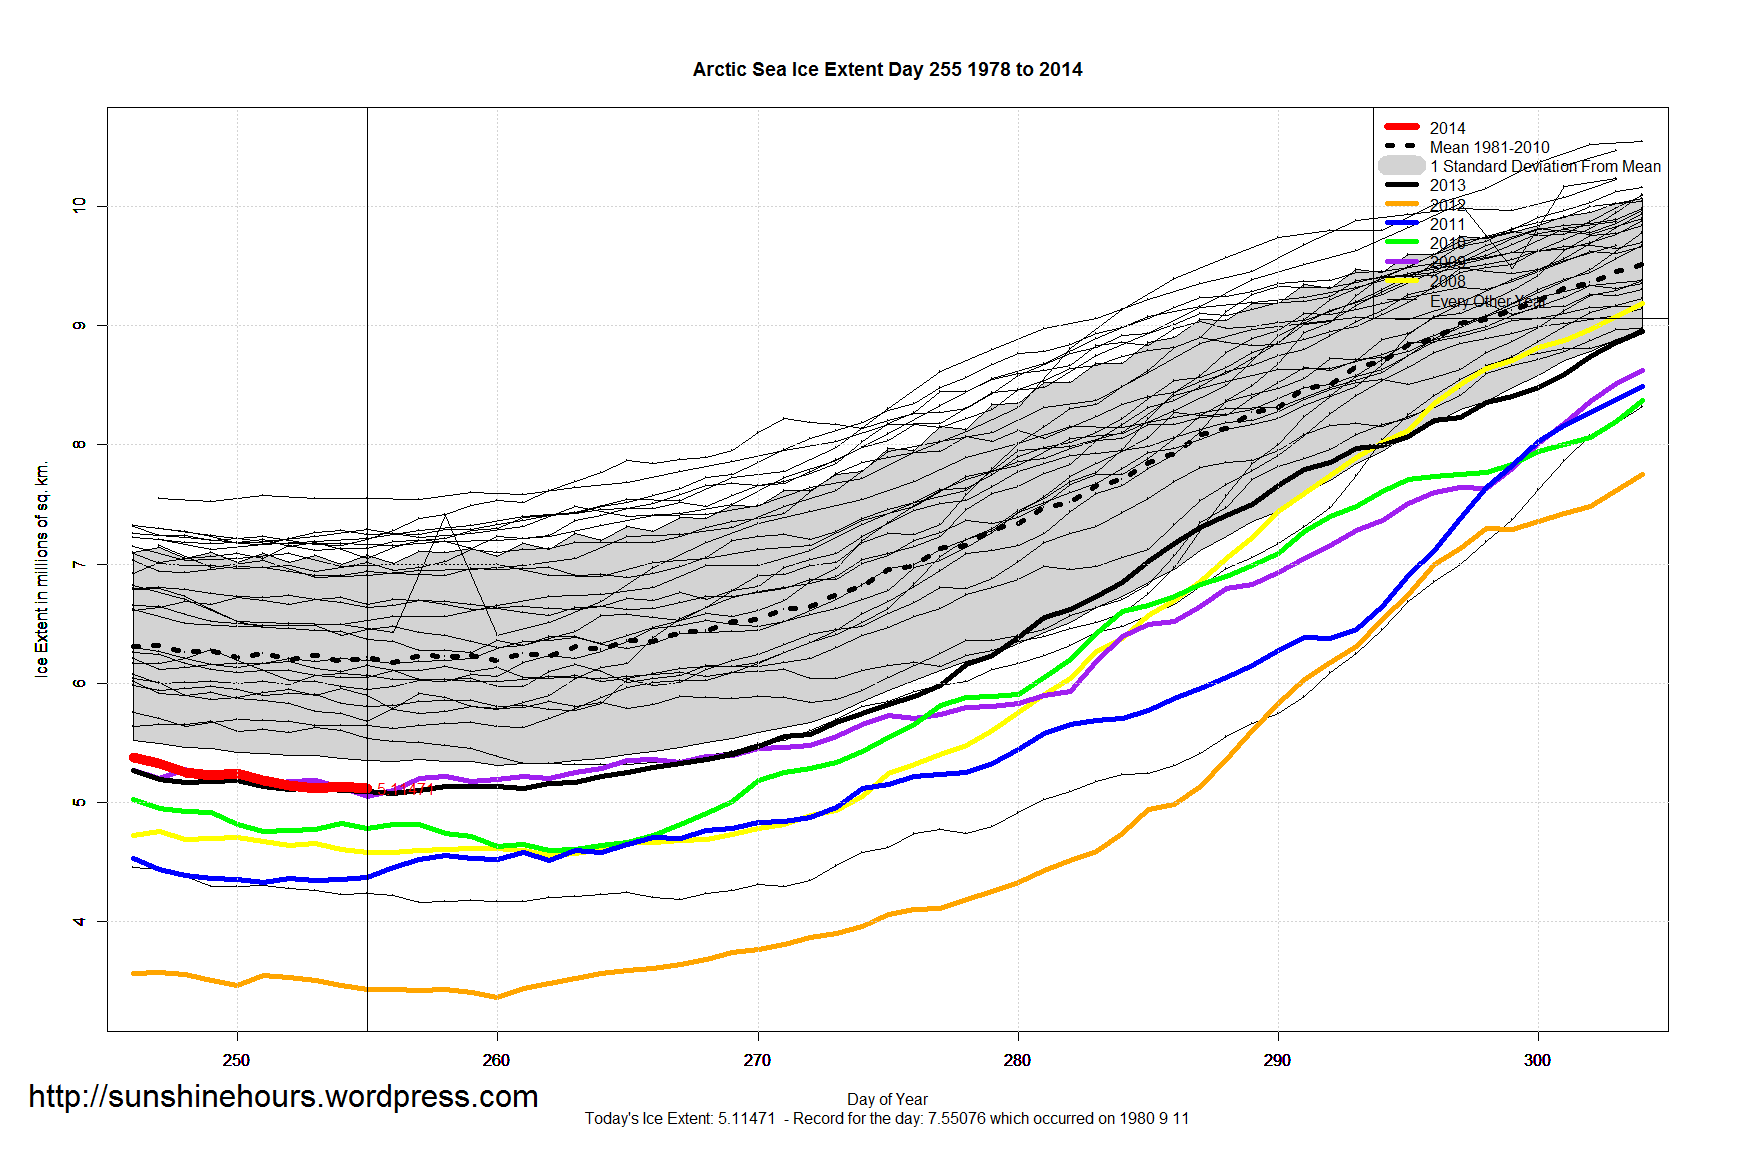
Arctic Sea Ice Extent Sep 13 2014 – -1,098,000 sq km below the 1981-2010 mean. Data for Day 255. Data here.
Day 255 is a new minimum at 5.11471 million sq km – 4800 sq km lower than day 253. (Day 254 was 20,000 sq km higher than day 253)

Arctic Sea Ice Extent Sep 13 2014 – -1,098,000 sq km below the 1981-2010 mean. Data for Day 255. Data here.
Day 255 is a new minimum at 5.11471 million sq km – 4800 sq km lower than day 253. (Day 254 was 20,000 sq km higher than day 253)
Update: A 3rd all-time record has been set
Update: Another record was set the next day.
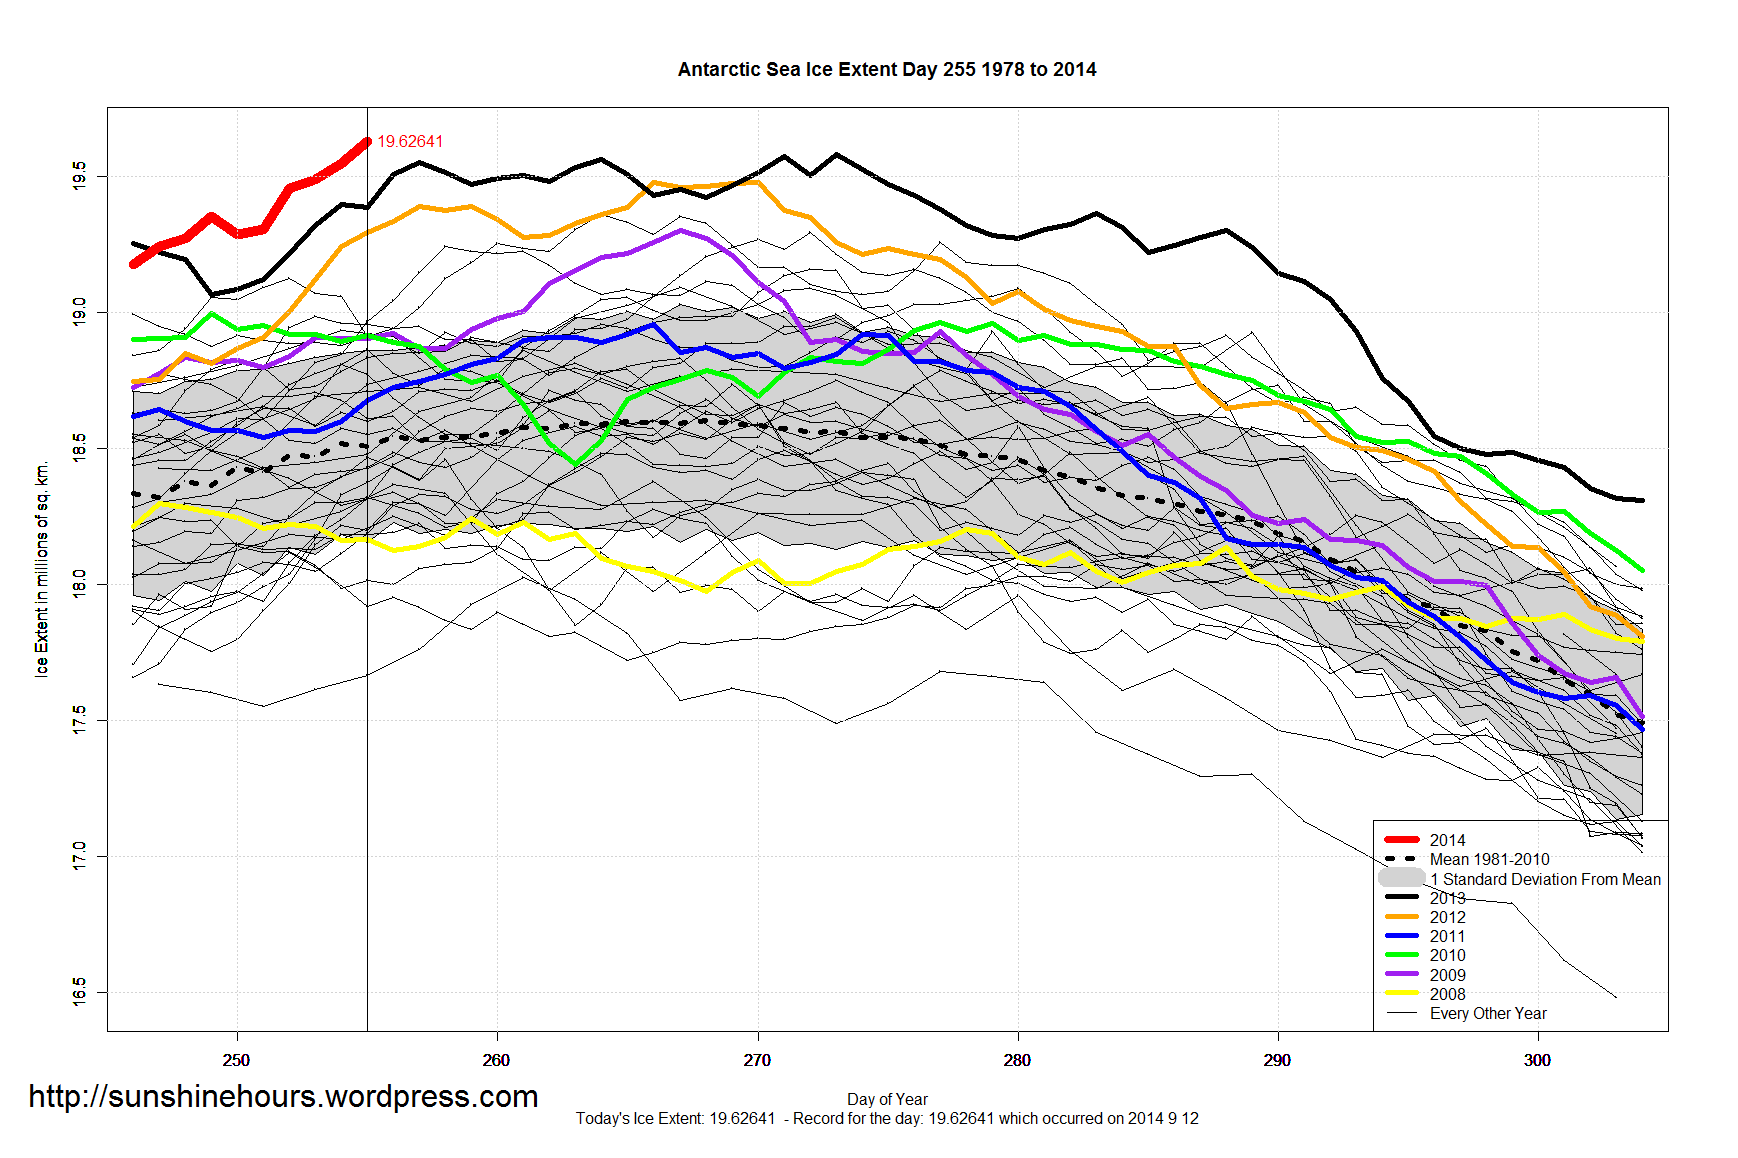
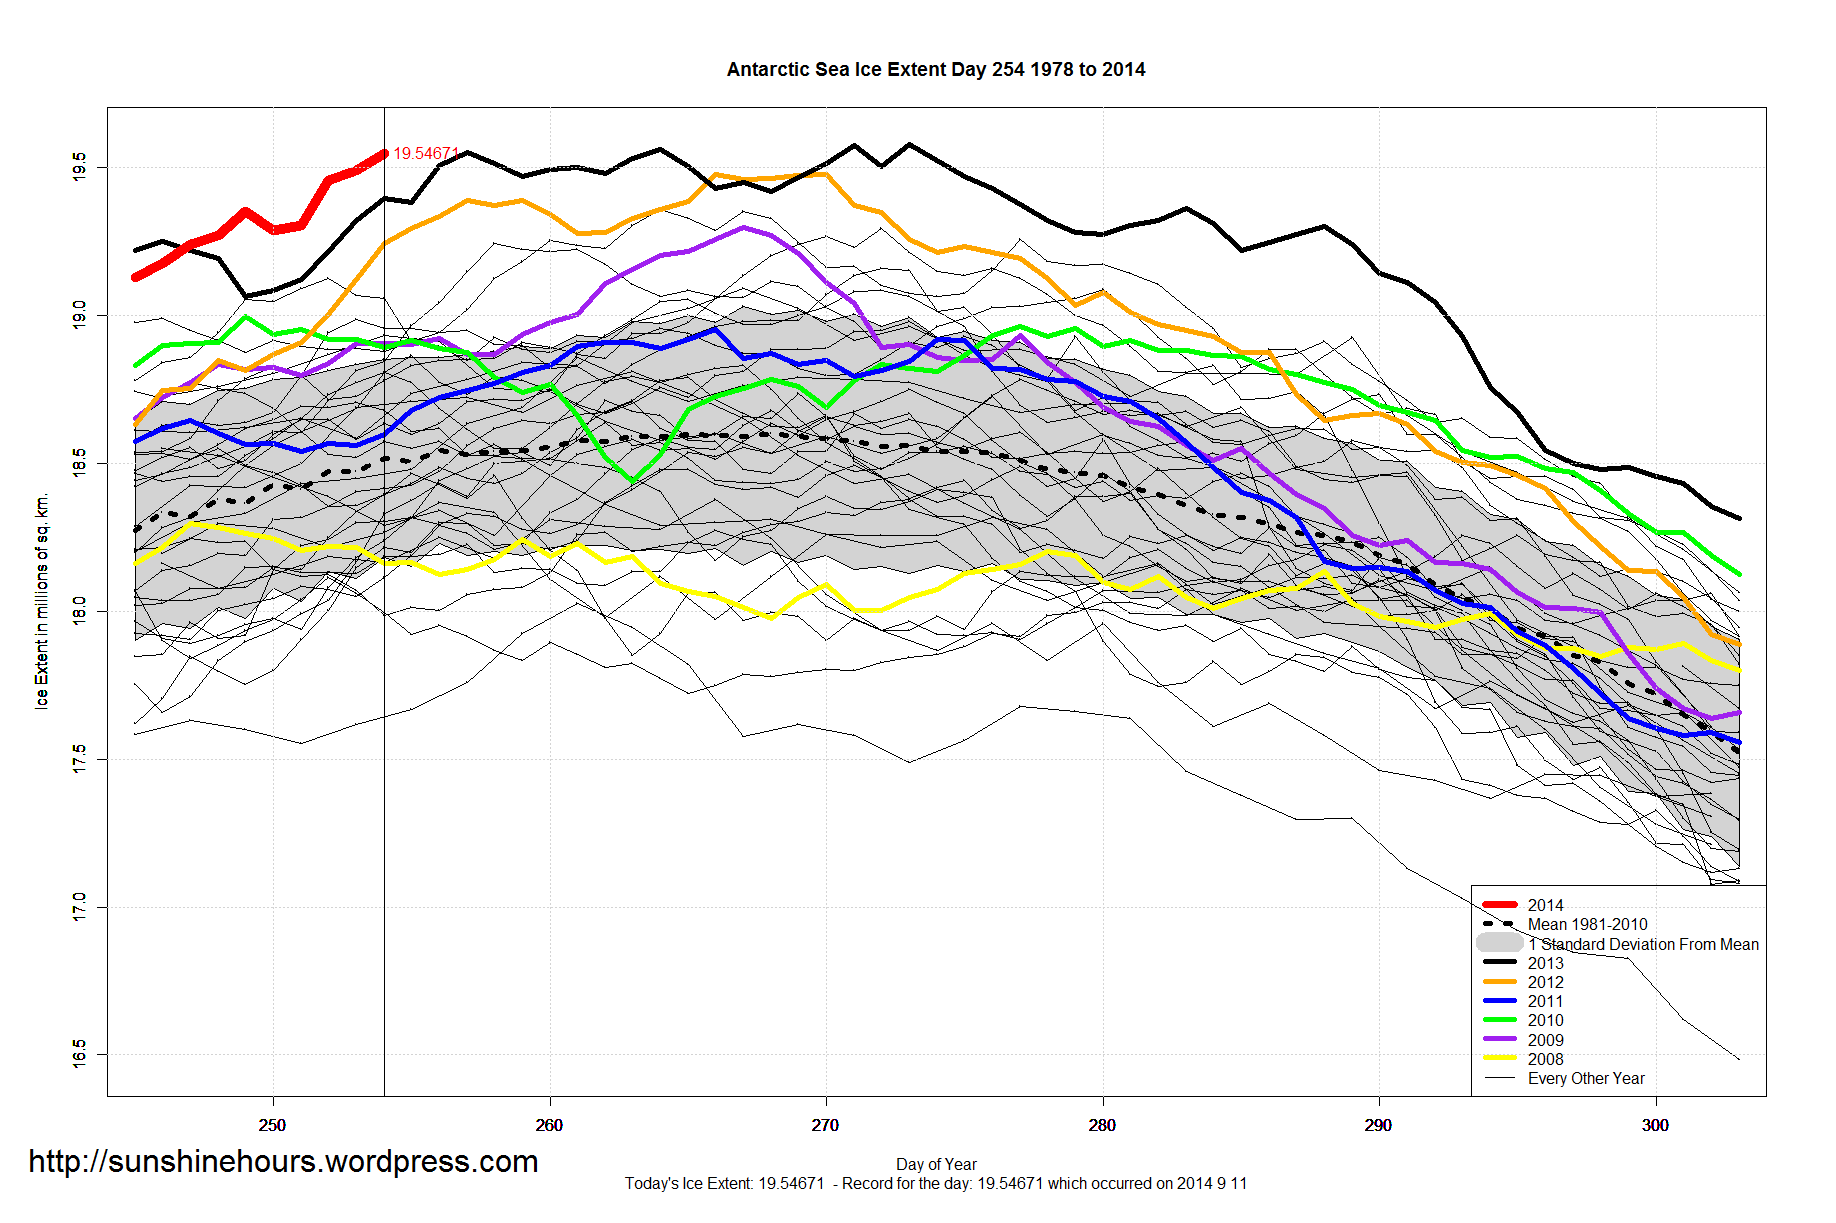
Antarctic Sea Ice Extent Sept 13 2014 – 1,121,000 sq km above the 1981-2010 mean. Data for Day 255. Data here.

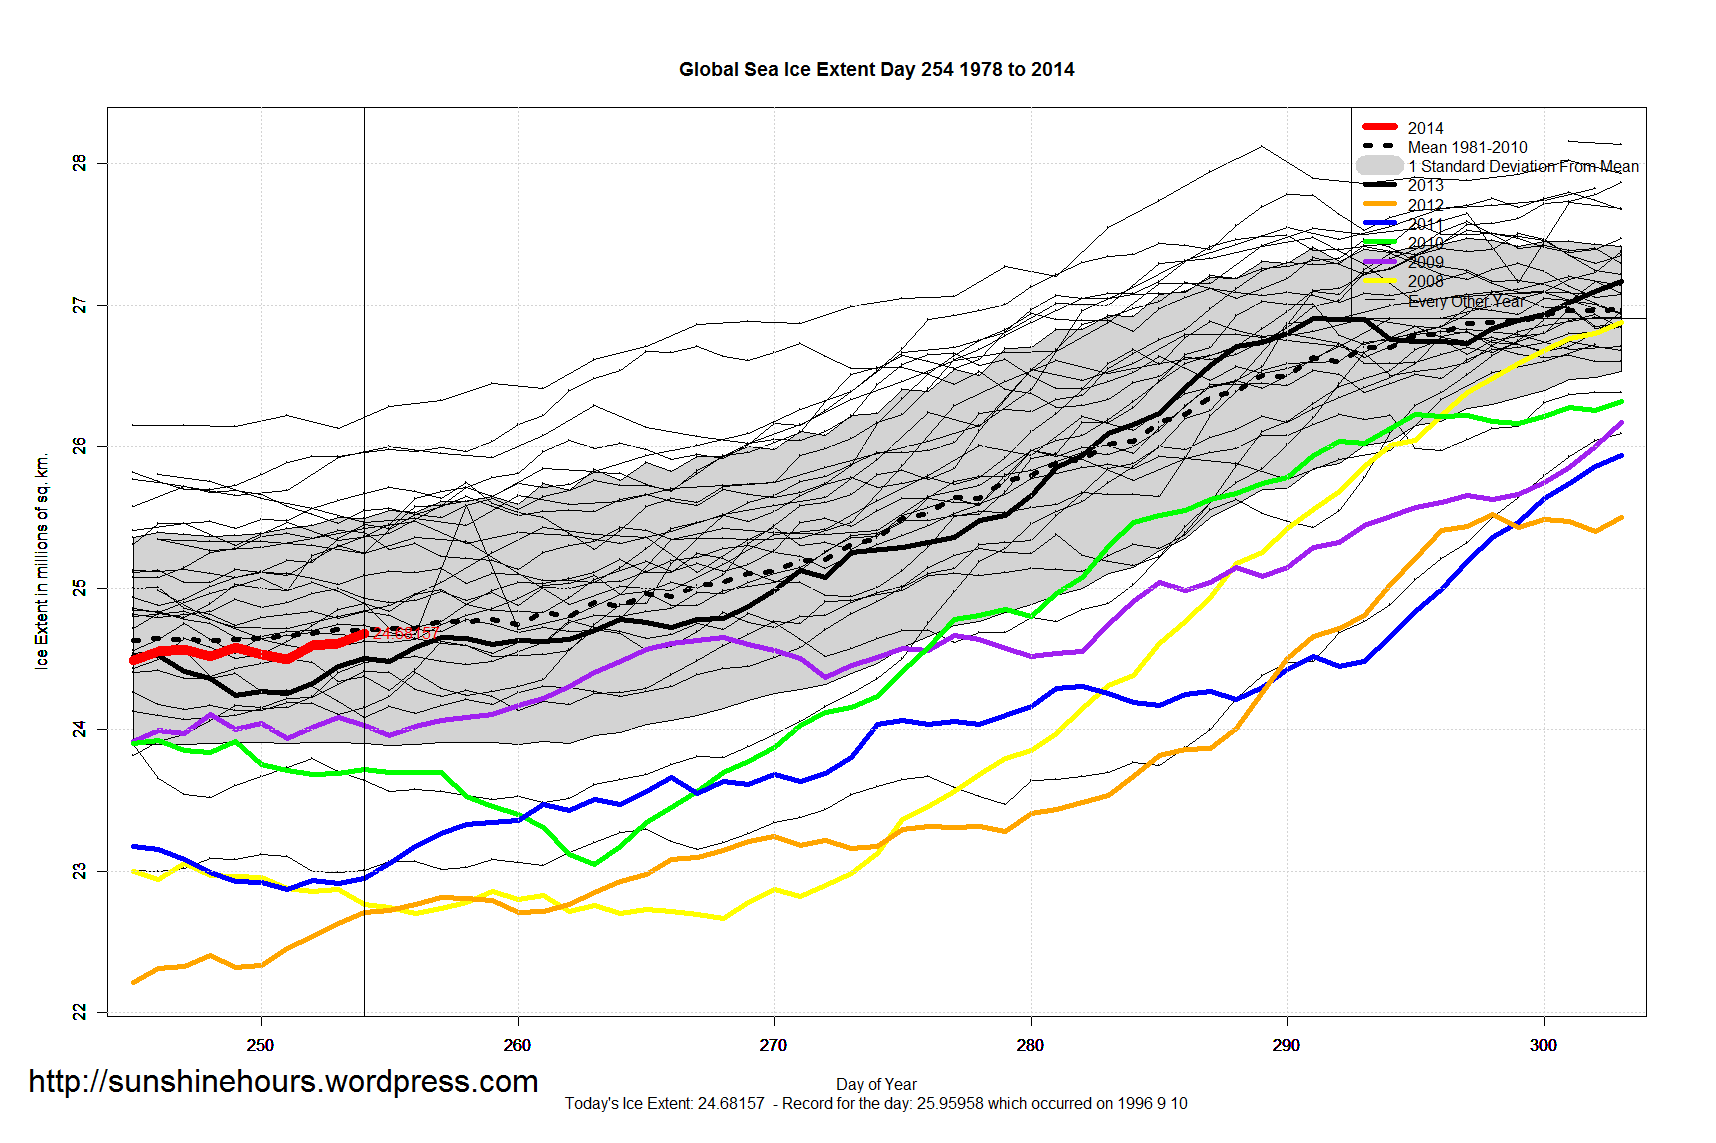
Global Sea Ice Extent Sept 12 2014 – -17,000 sq km below the 1981-2010 mean. Data for Day 254. Data here.

Update: Antarctica is setting records for sea ice too.
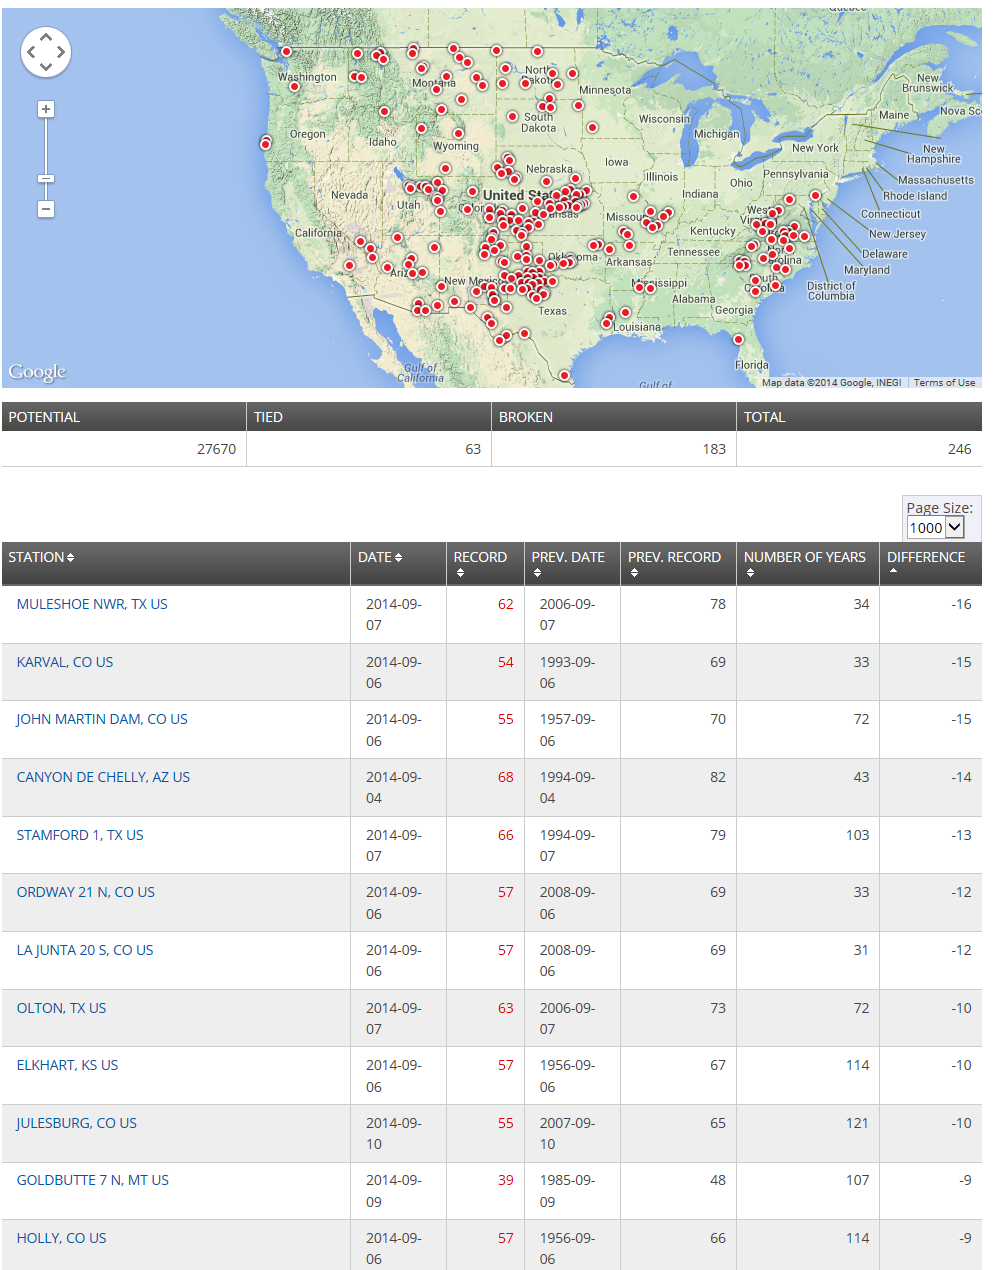
246 Low Max Records Broken or Tied From Sept 1 to Sept 10 according to the NOAA.
A “Low Max” means that the maximum temperatures for the day was the lowest it has ever been. This indicates daytime cooling.
Below is a screenshot showing location and the biggest difference between old record and new record.
The list is just the ones I could capture in a screenshot.
Arctic Sea Ice Extent Sep 12 2014 – -1,048,000 sq km below the 1981-2010 mean. Data for Day 254. Data here.
Day 253 is potentially the minimum for 2014.


Antarctic Sea Ice Extent Sep 12 2014 – 1,030,000 sq km above the 1981-2010 mean. Data for Day 254. Data here.
5th Highest of All-Time – 32,210 sq km From A New Record

Arctic Sea Ice Extent Sep 11 2014 – -1,117,000 sq km below the 1981-2010 mean. Data for Day 253. Data here.


According to the NOAA, August 2014 ranked 110th wettest out of 120 (120 is wettest). 0.48″ above the 1901-2000 average.
The last August that was wetter was 1977.

According to the NOAA, August 2014 ranked 28th coldest out of 120 using the Maximum temperature. Average temperature is ranked 68th out of 120.

I only have 166 days of MASIE data. These two graphs are NSIDC and MASIE for the same period.
Minimum is close.


