According to the NOAA, for Illionois, July 2014 ranked 2nd coldest out of 120 using the Maximum temperature.
The average max in July 1936 was 97.2. In July 2014 it was 81F. That means it was 16.2F colder .

According to the NOAA, for Illionois, July 2014 ranked 2nd coldest out of 120 using the Maximum temperature.
The average max in July 1936 was 97.2. In July 2014 it was 81F. That means it was 16.2F colder .
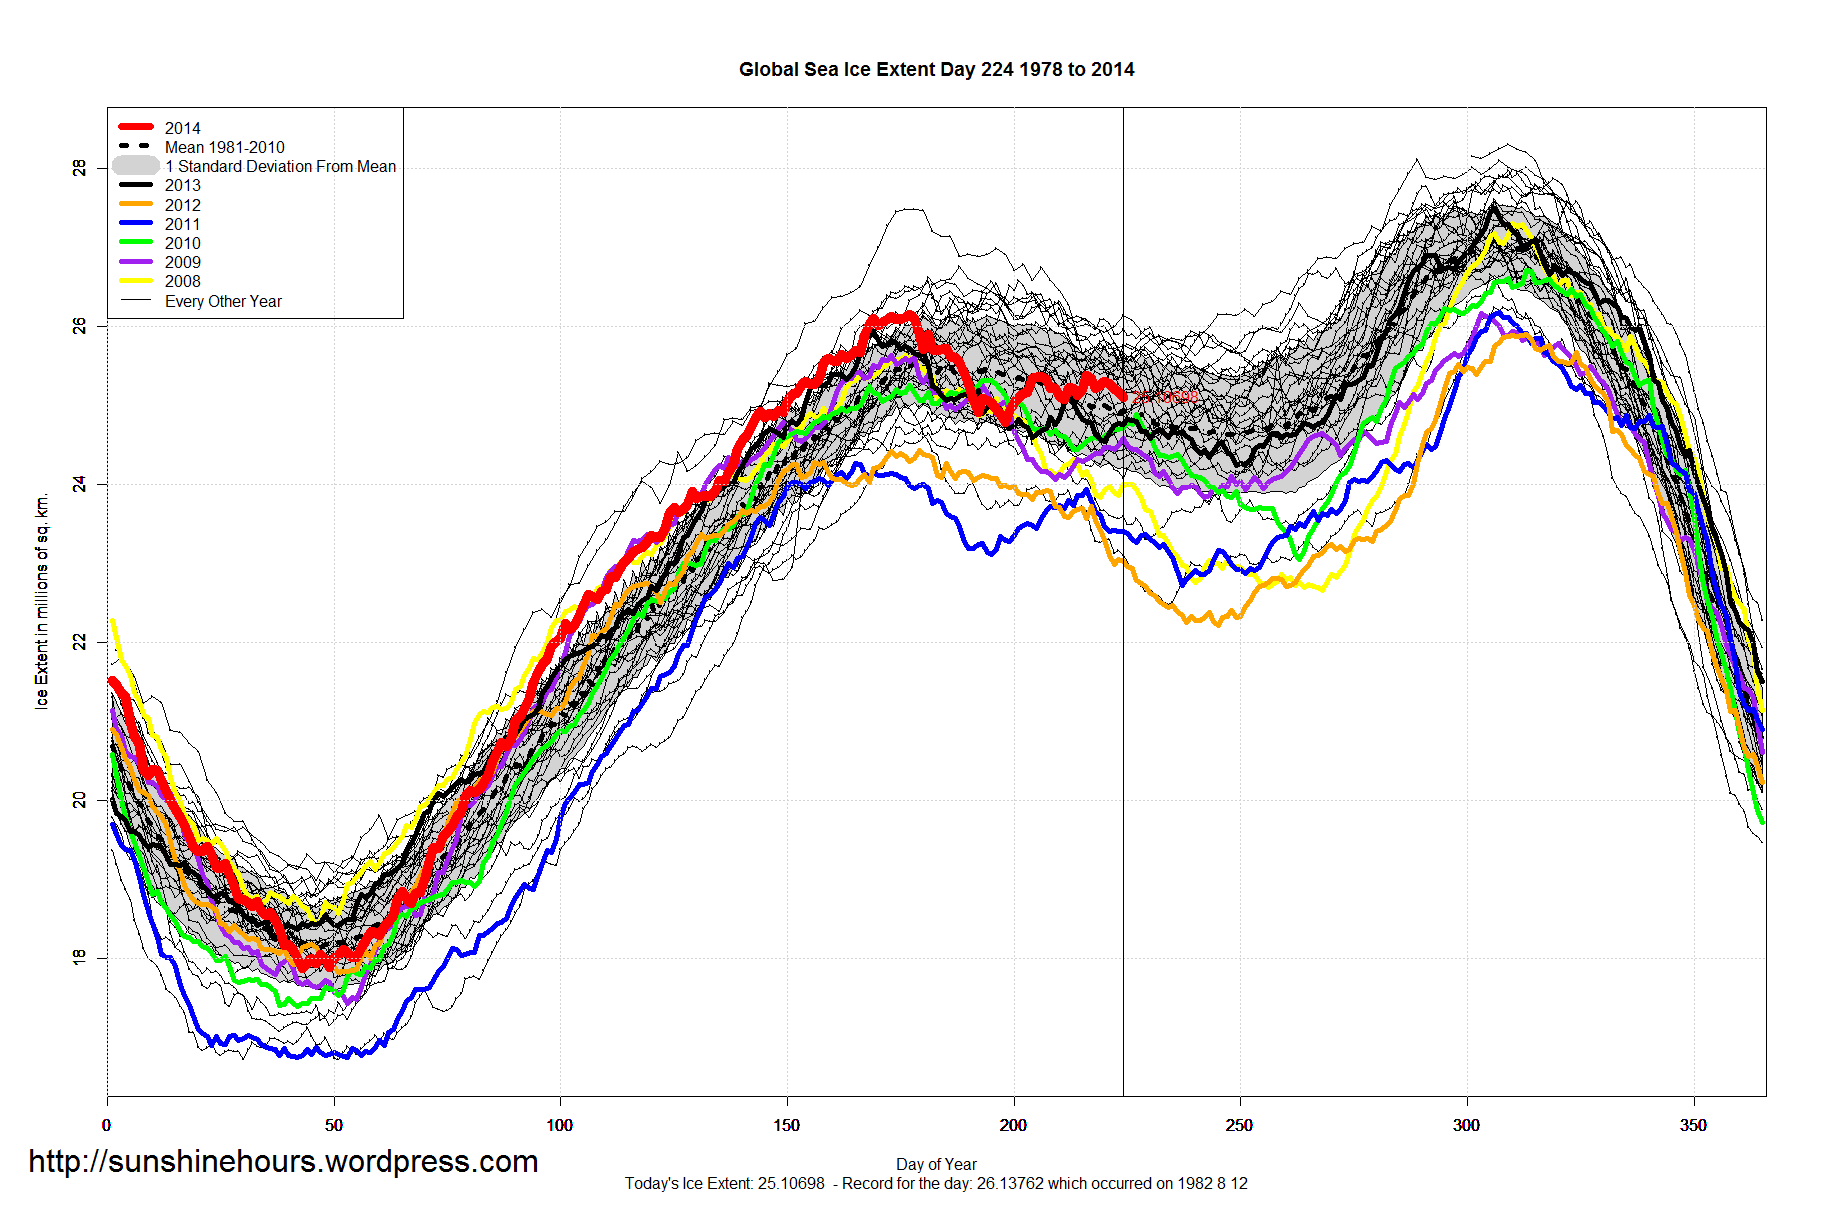
Global Sea Ice Extent is 144,000 sq km above the 1981-2010 mean. 2,100,000 sq km than 2012.
http://www.newsmax.com/MichaelReagan/California-Water-Management-Fails/2014/08/04/id/586658/
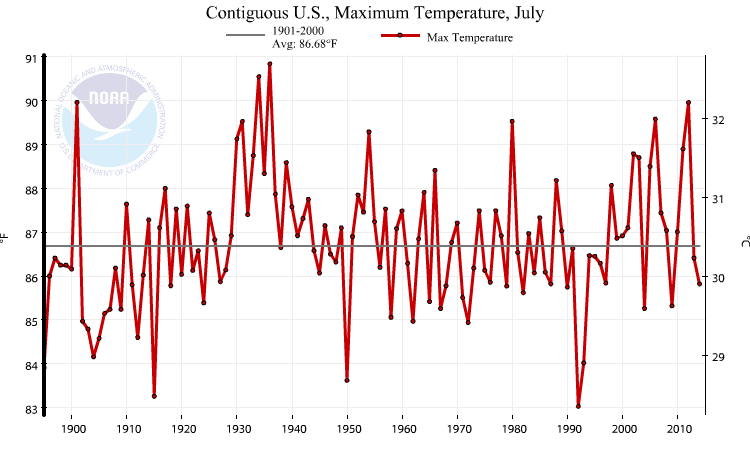
According to the NOAA, July 2014 ranked 29th coldest out of 120 using the Maximum temperature
Wow.
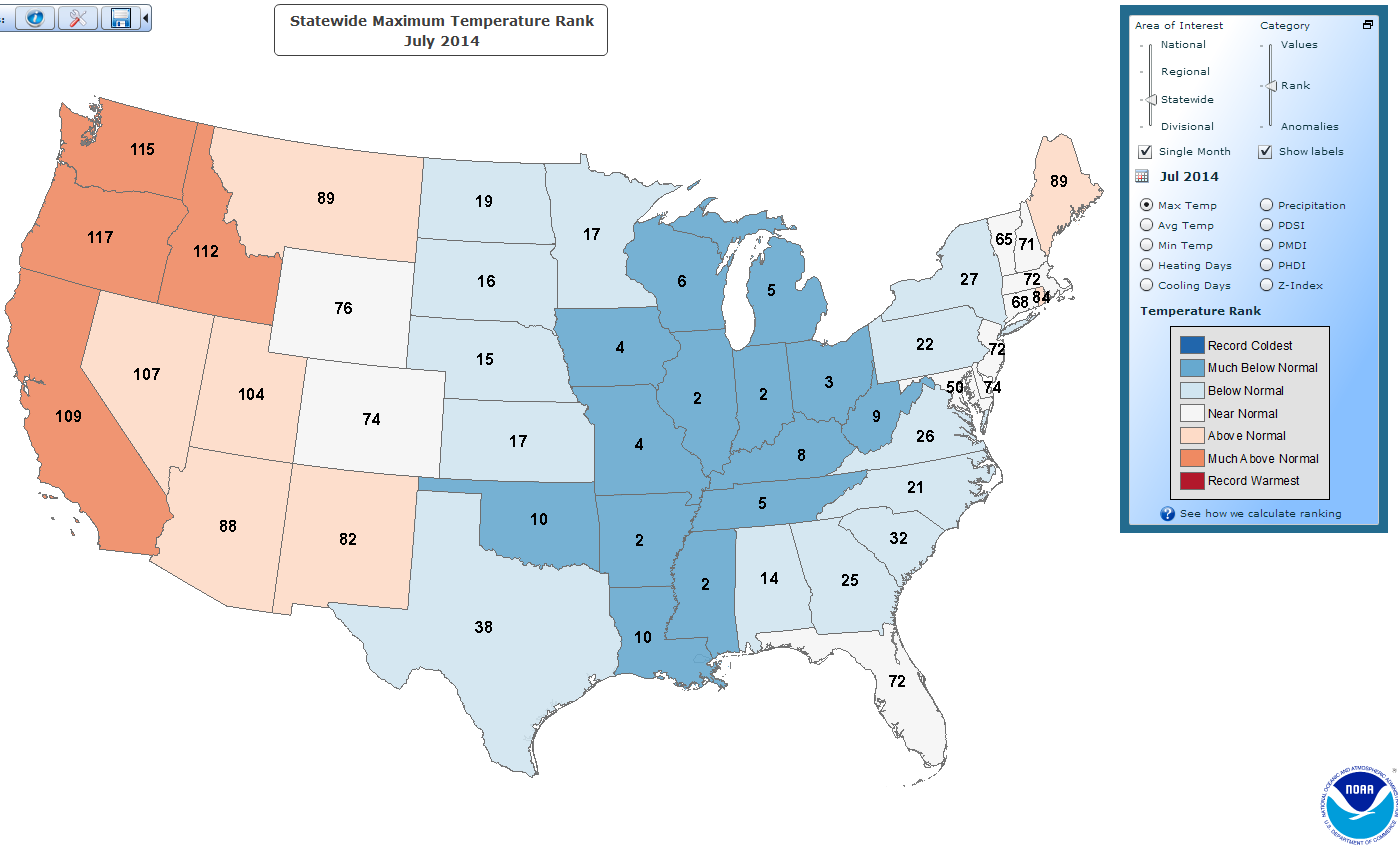
Take a look at the dark blue states. The number is the ranking out of 120. 1 would be the coldest. 120 would be warmest.
4 states were ranked 2nd coldest maximum temperatures since 1895.
1 was ranked 3rd, 2 were ranked 4th , 2 were ranked 5th, and there was 1 ranked 6, 1 ranked 8, 1 ranked 9 and 2 ranked 10th
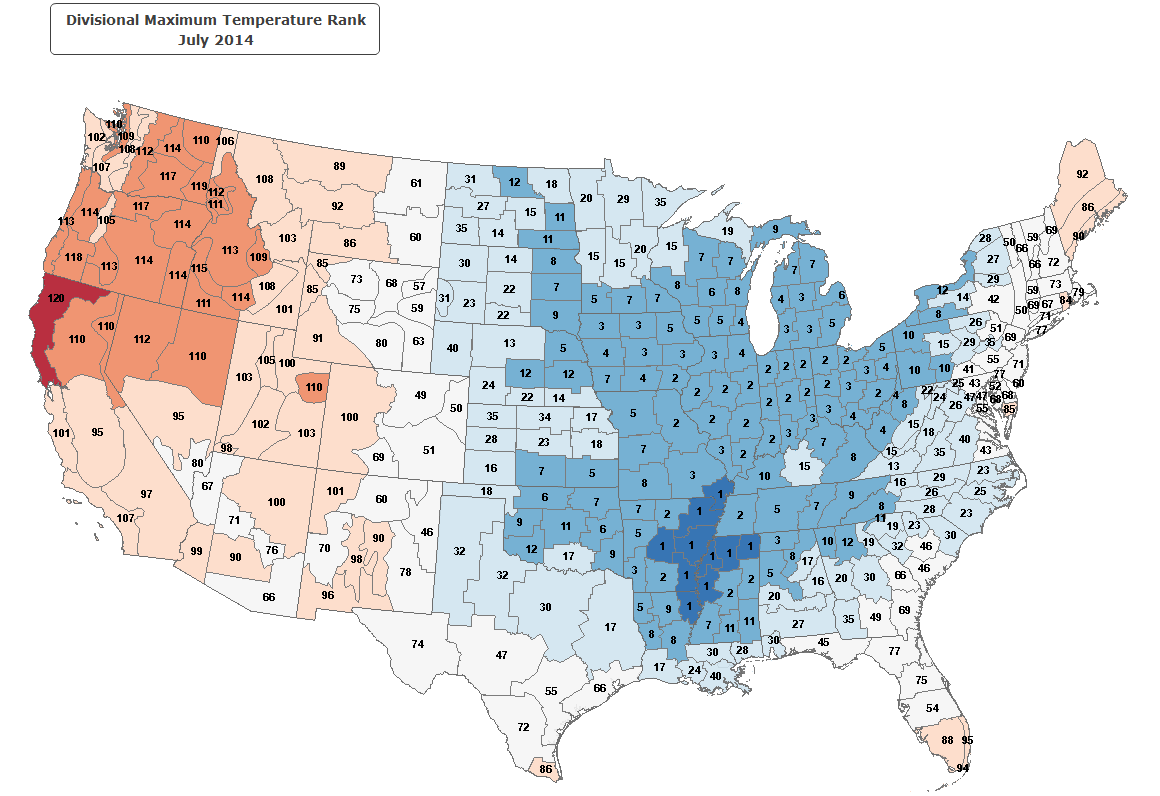
Here is the ranking by division. 10 divisions had the lowest maximum temperatures of all time. One division in northern California was ranked 120.
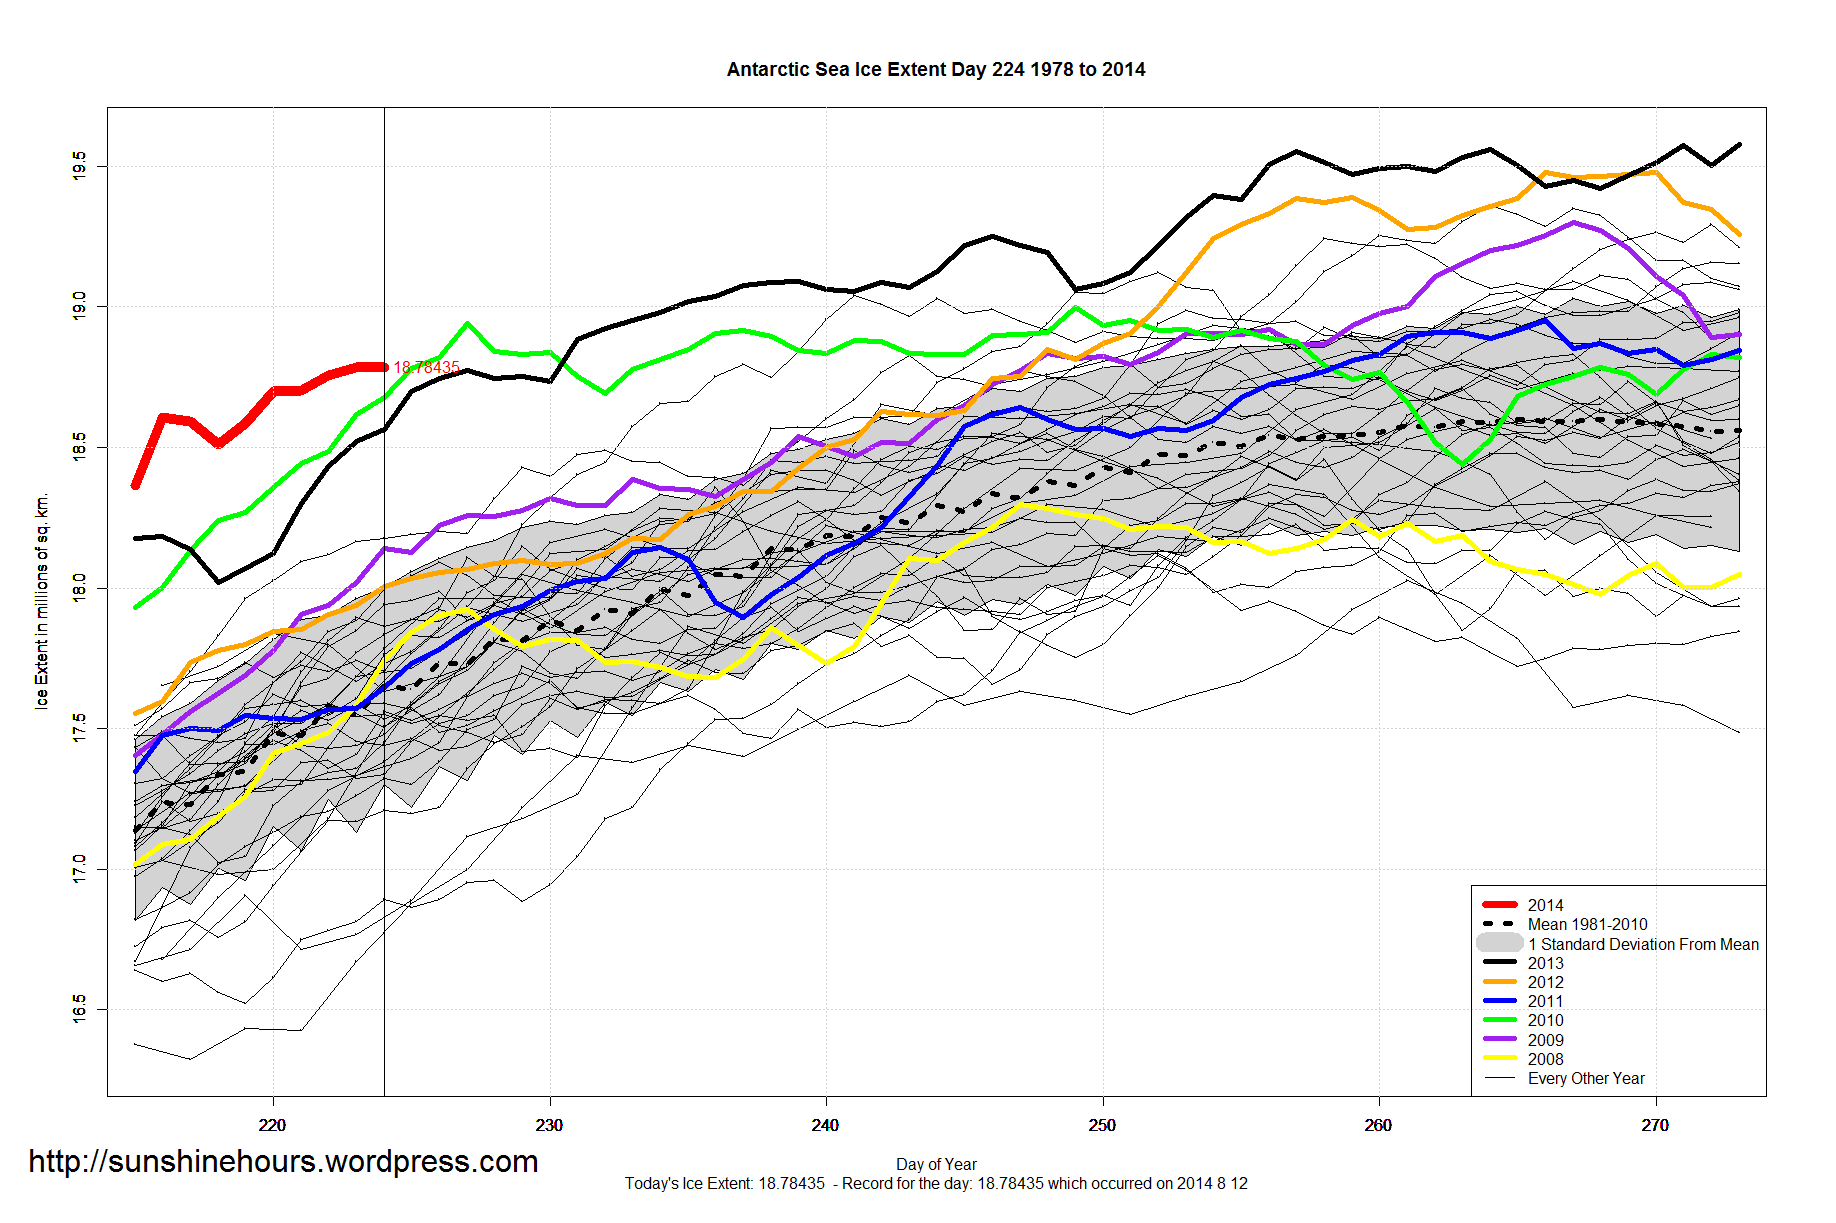
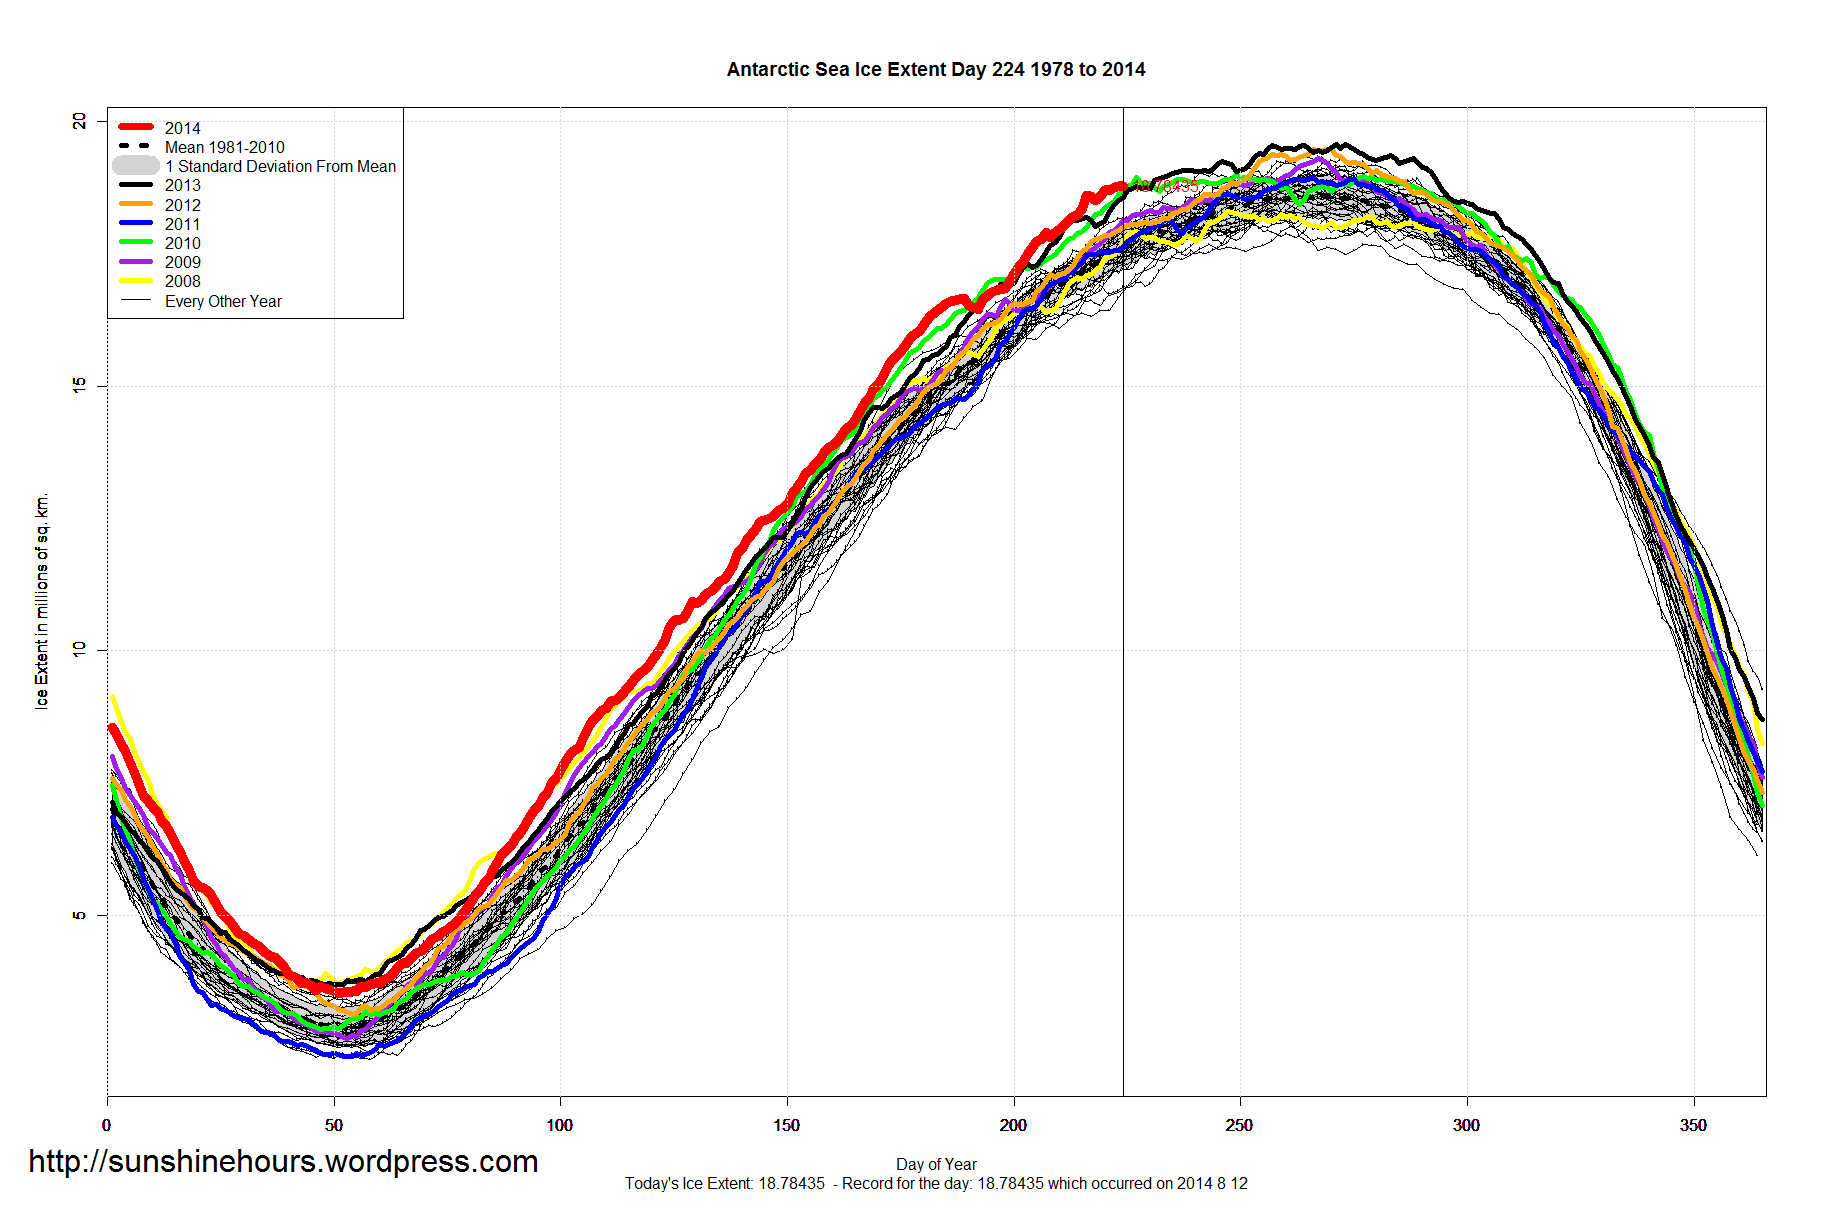
Antarctic Sea Ice Extent is 1,187,000 sq km above the 1981-2010 mean.
In 2010 (green line) , despite smashing previous records, the sea ice tailed away to normal levels. And in 2013 (black line), sea ice went on to break 2012’s record and then broke it again and again until it peaked on Sep 30.
So I make no predictions.
Arctic Sea Ice Extent is -1,043,000 sq km below the 1981-2010 mean.
Drifting very slowly away from the standard deviation mark. It is now 300,000 sq km below. A few days ago it was 220,000. But, to be fair, 2 weeks ago it was 500,000 below.
The data is for day 224. Day 245 was the earliest minimum ever. Day 265 was the latest. So 3 to 6 weeks more melting.

According to the NOAA, for Arkansas July 2014 ranked 2nd coldest out of 120 using the Maximum temperature.
It was -5.8F below the 1901-2000 average. Only .1F warmer than 1905.

Arctic Sea Ice Extent is -1,017,000 sq km below the 1981-2010 mean.

Antarctic Sea Ice Extent is 1,233,000 sq km above the 1981-2010 mean. That is the 145th daily record for 2014.

According to the NOAA, July 2014 ranked 29th coldest out of 120 using the Maximum temperature
The list in order of warmest to coldest.
1936,1934,1901,2012,2006,1931,1980,1954,1930,2011,2002,1933,2003,1939,2005,1966,1935,1988,1998,1917,1964
1937,1952,1943,1910,1921,1940,1919,1957,1960,1974,1977,1953,1925,2007,1932,1985,1942,1914,1955,1970,1946
1916,1949,2001,1959,2008,1989,2010,1983,1929,1941,1978,2000,1951,1999,1963,1926,1969,1938,1991,1923,1944
1981,1947,1994,1995,1897,2013,1948,1961,1996,1898,1899,1956,1908,1973,1900,1928,1922,1975,1986,1945,1984
1920,1913,1896,1927,1976,1997,1987,2014,1911,1918,1968,1979,1990,1982,1971,1965,1924,2009,1967,2004
1907,1909,1906,1958,1902,1962,1972,1903,1912,1905,1904,1993,1895,1950,1915,1992
The scary thing is … 2009 and 2004 were colder than 2014.