MASIE May 31 2014 – Arctic Ice Extent By Region As of Day 150

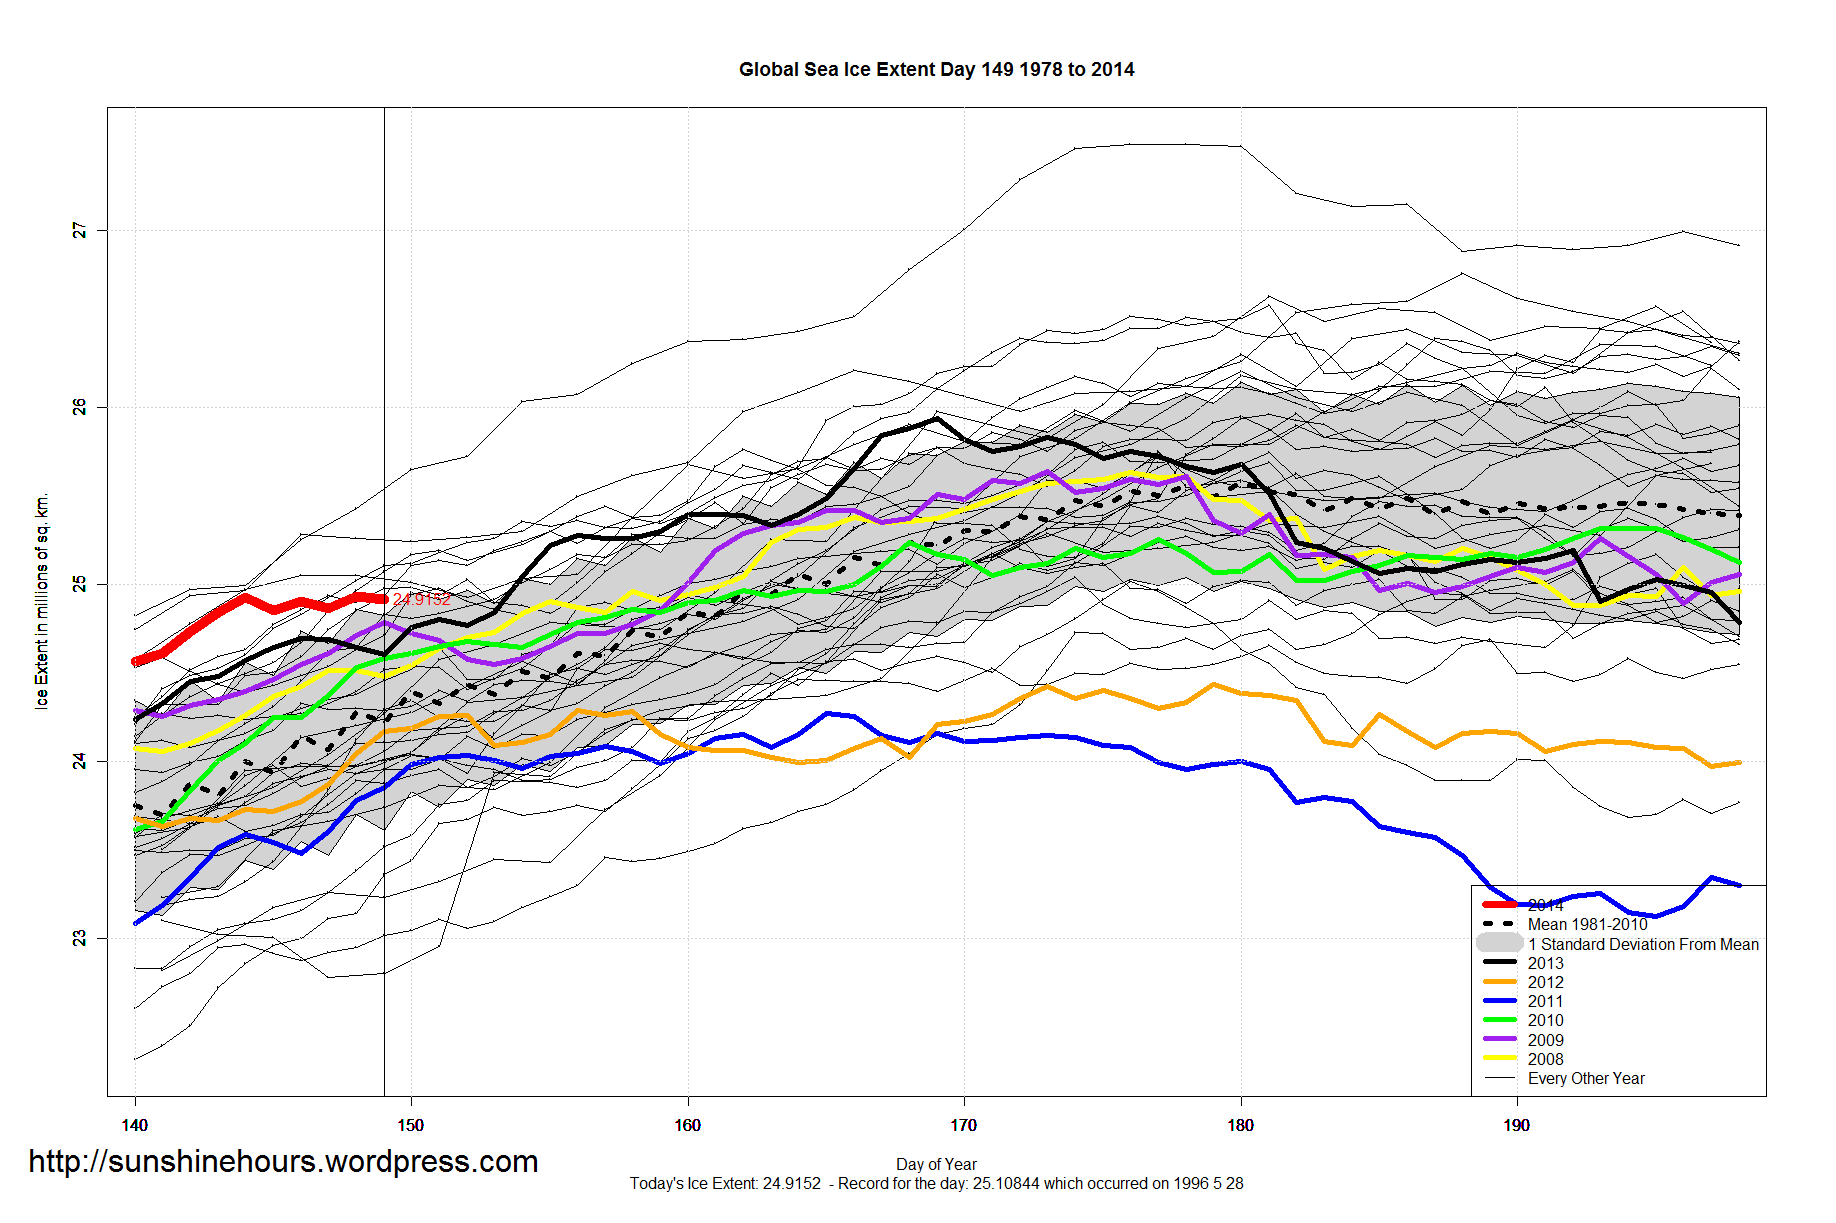
May 31 2014  MASIE Update

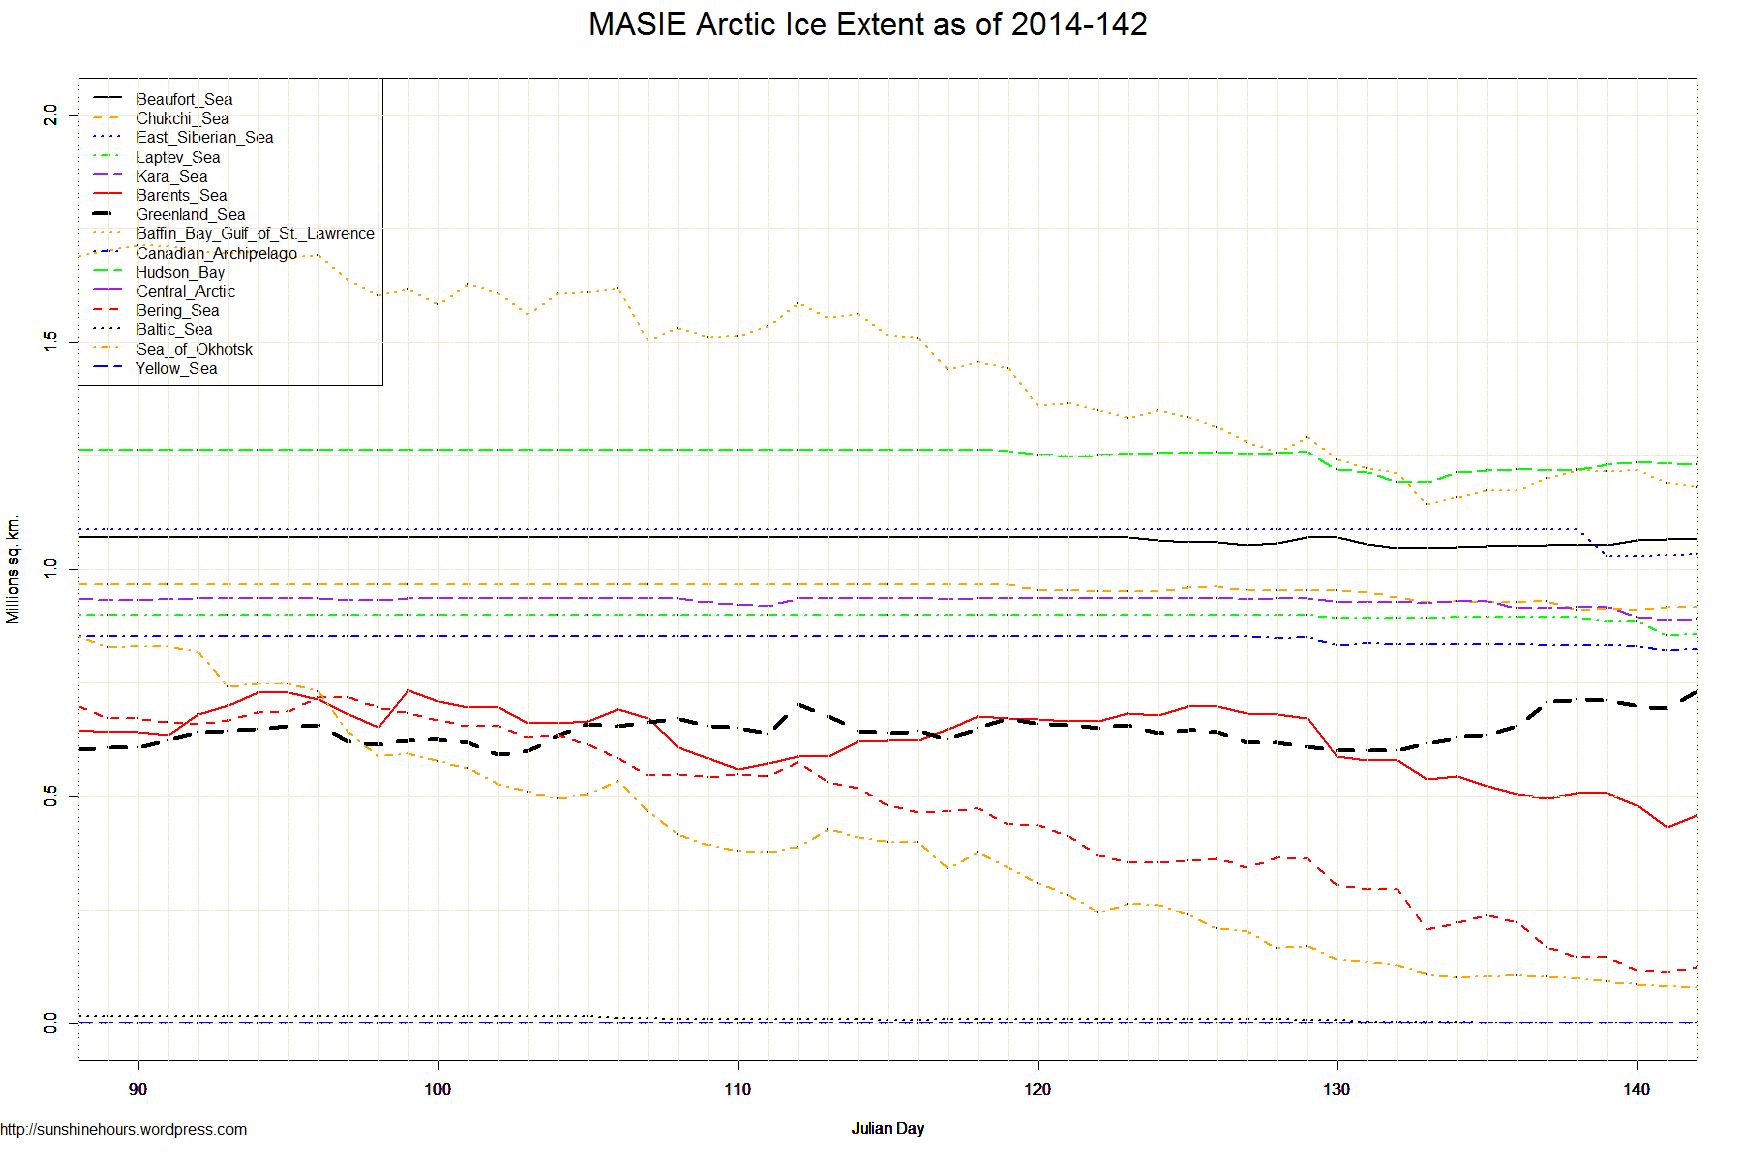
This is the gain/loss up to day 150. Negative = loss. Sorted with biggest loser in last 7 days at top. Northern Hemisphere is the grand total.

While melting resumed in many regions over the last one day, over the last 3 days daily melt was only -9,229 sq km per day.

The Greenland Sea continues to climb.

Region Start End Last 62 Last 28 Last 14 Last 7 Last 3 Last 1
Greenland Sea 603,416 655,024 51,609 4,140 -90 -106,985 18,233 13,181
Baffin Bay Gulf of St. Lawrence 1,688,530 1,103,619 -584,912 -245,220 -69,982 -80,040 36,442 -7,578
Barents Sea 645,917 397,108 -248,810 -267,741 -108,359 -50,858 -27,296 -23,217
Laptev Sea 897,845 818,855 -78,990 -78,990 -74,487 -25,700 -10,619 -7,430
Canadian Archipelago 853,214 810,271 -42,943 -42,943 -23,912 -15,090 -4,928 -3,406
Kara Sea 933,859 869,825 -64,034 -65,198 -44,437 -14,481 -19,292 -9,079
Chukchi Sea 966,006 903,001 -63,005 -49,419 -23,794 -11,676 -15,364 -6,480
Sea of Okhotsk 853,240 72,328 -780,912 -172,684 -34,867 -8,824 -608 1,685
Bering Sea 697,324 110,295 -587,029 -259,246 -112,201 -7,340 -4,777 -5,541
Central Arctic 3,221,921 3,241,348 19,427 -6,665 -5,400 -5,418 -2,634 -290
Hudson Bay 1,260,903 1,225,457 -35,446 -25,002 6,010 -5,232 -5,008 -6,607
Beaufort Sea 1,070,445 1,066,643 -3,802 -3,802 16,656 -495 539 -280
Baltic Sea 15,337 0 -15,337 -8,219 0 0 0 0
Yellow Sea 0 0 0 0 0 0 0 0
East Siberian Sea 1,087,137 1,034,287 -52,850 -52,850 -52,850 13,387 7,625 248
Northern Hemisphere (Total) 14,805,115 12,309,541 -2,495,574 -1,274,566 -527,729 -318,446 -27,687 -54,792
NH (Average Loss per Day)     -39,612 -45,520 -37,695 -45,492 -9,229 -54,792

MASIE Arctic Ice Extent as of 2014-150

Whitehouse Admits Warmer Weather Best For Economy

The White House admitted yesterday that warmer weather is better for the US GDP. (A very slight exaggeration on my part)

3. The first quarter of 2014 was marked by unusually severe winter weather, including record cold temperatures and snowstorms, which explains part of the difference in GDP growth relative to previous quarters. The left chart shows the quarterly deviation in heating degree days from its average for the same quarter over the previous five years. By this measure, the first quarter of 2014 was the third most unusually cold quarter over the last sixty years, behind only the first quarter of 1978 and the fourth quarter of 1976. “

There is some question whether there numbers are correct as this blog post discusses.

The NOAA suggests Q1 had the 9th lowest heating degree days (not the asserted 3rd)


Heating Degree Days 2014 Q1

But I think we can all agree that if more “Heating Degree Days” is bad for the GDP as the White House assets, then fewer “Heating Degree Days” would be better for the economy.

And therefore “Global Warming” is better for the US GDP.

We certainly don’t want to damage the economy by returning to the late 1970’s when “Heating Degree Days” went through the roof!  That would be a disaster for the US economy.

Hurrah!

Sea Ice Update May 30 2014

A quick update for sea ice extent for day 149 of 2014:

  • Global Sea Ice Extent is 639,000 sq km above the 1981-2010 mean.
  • Antarctic Sea Ice Extent is 1,150,000 sq km above the 1981-2010 mean.
  • Arctic Sea Ice Extent is -511,000 sq km below the 1981-2010 mean.

NOAA Data here and here here.

Graphs below. Click for bigger.


Global_Sea_Ice_Extent_Zoomed_2014_Day_149_1981-2010

Antarctic_Sea_Ice_Extent_Zoomed_2014_Day_149_1981-2010

Arctic_Sea_Ice_Extent_Zoomed_2014_Day_149_1981-2010

London’s Dirty Secret: Pollution Worse Than Beijing’s

The AGW Cult is making air pollution worse.

“European Union efforts to fight climate change favored diesel fuel over gasoline because it emits less carbon dioxide, or CO2. However, diesel’s contaminants have swamped benefits from measures that include a toll drivers pay to enter central London, a thriving bike-hire program and growing public-transport network.

“Successive governments knew more than 10 years ago that diesel was producing all these harmful pollutants, but they myopically plowed on with their CO2 agenda,” said Simon Birkett, founder of Clean Air in London, a nonprofit group. “It’s been a catastrophe for air pollution, and that’s not too strong a word. It’s a public-health catastrophe.””

“Nitrogen dioxide is a problem that you get in all big cities with a lot of traffic,” said Alberto Gonzalez Ortiz, project manager for air quality at the European Environment Agency, which is based in Copenhagen. “In many cases it’s gotten worse because of the new fleets of diesel cars.”

Embed from Getty Images

http://www.bloomberg.com/news/2014-05-27/london-s-dirty-secret-pollutes-like-beijing-airpocalyse.html


Sea Ice Update May 28 2014

A quick update for sea ice extent for day 147 of 2014:

  • Global Sea Ice Extent is 721,000 sq km above the 1981-2010 mean. Big drop over the last few days because Antarctica slowed down.
  • Antarctic Sea Ice Extent is 1,214,000 sq km above the 1981-2010 mean. 80th daily record for 2014.
  • Arctic Sea Ice Extent is -493,000 sq km below the 1981-2010 mean.

NOAA Data here and here here.

Graphs below. Click for bigger.


Global_Sea_Ice_Extent_Zoomed_2014_Day_147_1981-2010

Antarctic_Sea_Ice_Extent_Zoomed_2014_Day_147_1981-2010

Arctic_Sea_Ice_Extent_Zoomed_2014_Day_147_1981-2010

VANCOUVER HARBOUR CS May 25 (1958 – 2014)

I thought it was a little cold on Sunday (May 25) so I thought I would take a look at the daily data for a weather station near me using Environment Canada’s web service.

I picked  VANCOUVER HARBOUR CS which is in the harbour in Vancouver BC.

It turns out May 25 was the 6th coldest maximum temperature since 1958 (the start of the data) and the coldest since 1998.  It was also the 9th warmest minimum.

Remember, this is just one day’s data for 56 years. But there isn’t much of a CO2 signal is there? (Click graph for larger)

VANCOUVER HARBOUR CS - May 25 Max and Min Temperature


Sea Ice Update May 27 2014 – Global Sea 827,000 sq km Above ‘Normal’

A quick update for sea ice extent for day 146 of 2014:

  • Global Sea Ice Extent is 827,000 sq km above the 1981-2010 mean.
  • Antarctic Sea Ice Extent is 1,281,000 sq km above the 1981-2010 mean.  79th daily record for 2014.
  • Arctic Sea Ice Extent is -454,000 sq km below the 1981-2010 mean.

NOAA Data here and here here.

Graphs below. Click for bigger.

Global_Sea_Ice_Extent_Zoomed_2014_Day_146_1981-2010

Antarctic_Sea_Ice_Extent_Zoomed_2014_Day_146_1981-2010

Arctic_Sea_Ice_Extent_Zoomed_2014_Day_146_1981-2010

MASIE May 25 2014 – Arctic Ice Extent By Region As of Day 144

May 25 2014  MASIE Update

This is the gain/loss up to day 144. Negative = loss. Sorted with biggest loser in last 7 days at top. Northern Hemisphere is the grand total.

I’ve added a “NH (Average Loss per Day)” line to the bottom of the table.  The interesting figure is that even though a lot of ice melted over the last 1 day, very little melted over the last 3 days: -7,232/day

Region Start End Last 56 Last 28 Last 14 Last 7 Last 3 Last 1
Barents Sea 645,917 426,330 -219,587 -197,492 -161,324 -69,343 -5,468 -21,635
East Siberian Sea 1,087,137 1,020,900 -66,237 -66,237 -66,237 -66,237 -9,601 0
Bering Sea 697,324 116,770 -580,554 -348,719 -187,839 -50,274 4,780 -866
Laptev Sea 897,845 844,555 -53,290 -53,290 -48,104 -48,787 -8,963 0
Baffin Bay Gulf of St. Lawrence 1,688,530 1,159,590 -528,941 -348,384 -82,592 -40,205 -29,385 -24,069
Sea of Okhotsk 853,240 68,004 -785,236 -330,041 -74,417 -36,163 -13,934 -13,148
Kara Sea 933,859 877,476 -56,383 -57,547 -49,337 -35,799 -9,626 -6,829
Chukchi Sea 966,006 914,677 -51,329 -51,329 -38,707 -14,015 -2,244 0
Canadian Archipelago 853,214 823,129 -30,085 -30,085 -9,967 -10,396 1,002 -2,232
Baltic Sea 15,337 0 -15,337 -8,172 -8,065 0 0 0
Yellow Sea 0 0 0 0 0 0 0 0
Central Arctic 3,221,921 3,246,766 24,844 -1,247 -1,247 18 72 0
Beaufort Sea 1,070,445 1,069,505 -940 -940 -940 16,478 4,165 2,367
Hudson Bay 1,260,903 1,235,572 -25,331 -25,331 15,864 18,058 3,072 4,883
Greenland Sea 603,416 736,975 133,559 94,070 136,343 29,406 44,112 -25,034
Northern Hemisphere (Total) 14,805,115 12,541,745 -2,263,370 -1,425,454 -576,650 -306,971 -21,697 -86,242
NH (Average Loss per Day)     -39,708 -50,909 -41,189 -43,853 -7,232 -86,242

MASIE Arctic Ice Extent as of 2014-144

Sea Ice Update May 25 2014 – Global Sea Ice Still Skyrocketing

A quick update for sea ice extent for day 144 of 2014:

  • Global Sea Ice Extent is 984,000 sq km above the 1981-2010 mean.
  • Antarctic Sea Ice Extent is 1,416,000 sq km above the 1981-2010 mean. 77th daily record for 2014.
  • Arctic Sea Ice Extent is -433,000 sq km below the 1981-2010 mean.

NOAA Data here and here here.

Graphs below. Click for bigger.


Global_Sea_Ice_Extent_Zoomed_2014_Day_144_1981-2010 Antarctic_Sea_Ice_Extent_Zoomed_2014_Day_144_1981-2010 Arctic_Sea_Ice_Extent_Zoomed_2014_Day_144_1981-2010


MASIE May 23 2014 – Arctic Ice Extent By Region As of Day 142

May 23 2014  MASIE Update

This is the gain/loss up to day 42. Negative = loss. Sorted with biggest loser in last 7 days at top. Northern Hemisphere is the grand total.

Over the last day Arctic Sea Ice actually rose  71,918 sq km.

Greenland Sea is actually 128,906  higher than it was 54 days ago. Central Arctic is a little higher than 54 days ago.

Region Start End Last 54 Last 28 Last 14 Last 7 Last 3 Last 1
Bering Sea 697,324 123,222 -574,102 -393,550 -241,699 -115,261 -22,203 11,232
Barents Sea 645,917 457,488 -188,429 -163,976 -223,226 -63,857 -48,336 25,690
East Siberian Sea 1,087,137 1,032,550 -54,587 -54,587 -54,587 -54,587 4,155 2,049
Kara Sea 933,859 888,854 -45,006 -46,170 -46,170 -39,891 -27,783 1,751
Laptev Sea 897,845 856,855 -40,990 -40,990 -40,990 -36,487 -28,395 3,337
Sea of Okhotsk 853,240 79,942 -773,298 -330,572 -86,154 -23,851 -13,813 -1,996
Canadian Archipelago 853,214 823,902 -29,312 -29,312 -24,790 -10,281 -9,624 1,774
Chukchi Sea 966,006 916,921 -49,085 -49,085 -35,691 -9,874 2,459 0
Central Arctic 3,221,921 3,246,693 24,772 -1,320 -1,320 -1,049 -126 0
Baltic Sea 15,337 0 -15,337 -8,356 -9,170 0 0 0
Yellow Sea 0 0 0 0 0 0 0 0
Baffin Bay Gulf of St. Lawrence 1,688,530 1,179,599 -508,931 -380,919 -75,117 5,981 -36,203 -9,376
Hudson Bay 1,260,903 1,230,482 -30,422 -30,422 -24,442 13,734 -825 -2,019
Beaufort Sea 1,070,445 1,065,340 -5,105 -5,105 8,745 15,352 12,764 0
Greenland Sea 603,416 732,322 128,906 88,573 113,953 97,131 19,995 39,459
Northern Hemisphere (Total) 14,805,115 12,635,360 -2,169,755 -1,446,806 -741,488 -223,244 -147,953 71,918

MASIE Arctic Ice Extent as of 2014-142