Thanks to anti-fracking activities in Europe by environmentalists, the only plentiful fuel available cheap enough to use against Putin’s control is Coal.
I’ve mentioned Poland and Germany and Japan. Now it is Sweden’s turn.
“In the wake of the Ukraine crisis and Germany’s nuclear shutdown, Swedish-state-owned Vattenfall is supplying even more energy from coal. Vattenfal’s chief executive officer told Swedish public television that coal power will have an important role to play in the future.
The state-owned power company, which runs Sweden’s hydro and nuclear plants, had its annual general meeting on Monday. Despite getting badly burned by buying the now-devalued Dutch company Nuon, Vattenfall has plans to buy up even more foreign coal companies.
The Swedish state is the owner of Vattenfall. The government’s representative at the meeting says that, despite setting a goal of reducing carbon emissions, the government has no objection to Vattenfall investing in coal, and leaves such decisions to the company board.”
http://www.thegwpf.org/sweden-coal-to-play-important-role-in-future/
If Europe had jumped into fracking as soon as possible, the natural gas would have been coming on stream by now and they could be replacing coal with cleaner, lower CO2 gas. But Europe bet the farm on wind and solar. Idiots.
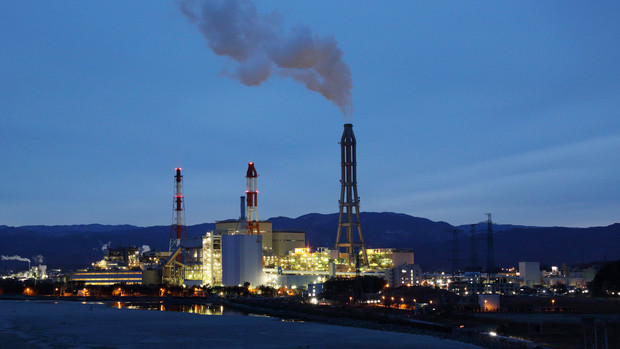
Embed from Getty Images