“As the planet warms, animals and plants are learning to adapt to their new environment by either migrating or evolving, new research has revealed.”

What kind of idiots didn’t think plants and animals couldn’t adapt?
What kind of idiots didn’t think plants and animals couldn’t adapt?
May 8 2014 MASIE Update (Although the dataset from MASIE only has 28 days of data, I have started to save the data allowing the analysis to go further back)
This is the gain/loss from day 88to day 121. Negative = loss. Sorted with biggest loser in last 7 days at top. Northern Hemisphere is the grand total.
Today I added Last 1 day and Last 39 (which will change every time I post). Four of the regions actually gained ice over the last 39 days, but that is dwarfed by losses elsewhere.
| Region | Start | End | Last 39 | Last 28 | Last 14 | Last 7 | Last 3 | Last 1 |
| Sea of Okhotsk | 853,240 | 202,954 | -650,286 | -390,876 | -225,244 | -105,804 | -57,396 | -6,523 |
| Bering Sea | 697,324 | 343,858 | -353,465 | -339,657 | -186,759 | -91,668 | -11,233 | -20,631 |
| Baffin Bay Gulf of St. Lawrence | 1,688,530 | 1,280,204 | -408,326 | -336,002 | -274,332 | -81,529 | -70,417 | -31,659 |
| Greenland Sea | 603,416 | 620,032 | 16,616 | -3,174 | -55,151 | -37,714 | -17,926 | -20,800 |
| Beaufort Sea | 1,070,445 | 1,053,016 | -17,429 | -17,429 | -17,429 | -17,429 | -11,126 | -7,107 |
| Chukchi Sea | 966,006 | 952,528 | -13,478 | -13,478 | -13,478 | -1,617 | 1,112 | -8,746 |
| Canadian Archipelago | 853,214 | 851,952 | -1,262 | -1,262 | -1,262 | -1,262 | -1,262 | -1,262 |
| Kara Sea | 933,859 | 934,833 | 973 | -191 | -191 | -191 | -191 | -191 |
| Baltic Sea | 15,337 | 8,402 | -6,935 | -7,186 | -1,394 | -105 | 184 | 0 |
| East Siberian Sea | 1,087,137 | 1,087,137 | 0 | 0 | 0 | 0 | 0 | 0 |
| Laptev Sea | 897,845 | 897,845 | 0 | 0 | 0 | 0 | 0 | 0 |
| Central Arctic | 3,221,921 | 3,248,013 | 26,092 | 795 | 0 | 0 | 0 | 0 |
| Yellow Sea | 0 | 0 | 0 | 0 | 0 | 0 | 0 | 0 |
| Hudson Bay | 1,260,903 | 1,251,802 | -9,101 | -9,101 | -9,101 | 491 | -2,890 | -5,686 |
| Barents Sea | 645,917 | 683,279 | 37,362 | -50,574 | 96,138 | 14,592 | 3,769 | -15,785 |
| Northern Hemisphere (Total) | 14,805,115 | 13,418,045 | -1,387,069 | -1,170,395 | -688,220 | -322,253 | -167,391 | -118,392 |
What an insane world we live in. Did you know that burning wood pellets in power plant produces twice as much CO2 (or more) per unit of electricity as burning natural gas does?
“Some of the most distinguished scientists in the US have written to UK energy secretary Ed Davey, urging him to abandon the government’s “misguided” subsidies for companies burning wood pellets to generate electricity, such as the Drax plant in Yorkshire”
http://www.ft.com/intl/cms/s/0/6f242a06-d388-11e3-b0be-00144feabdc0.html#axzz3142c1bWV
The letter is here:
“Mounting demand for wood pellets in the UK and Europe has led to an explosive growth in facilities
across the Southern US that are manufacturing wood pellets for export to supply the European
electricity market. In 2012, the Southeastern US emerged as the world’s largest exporter of wood pellets
for biomass electricity generation. With continued investments throughout the southern US, export
volumes reached an estimated 1.75 million tons in 2012 and are expected to jump to 5.7 million tons in
2015, according to the North American Wood Fiber Review.
.
Demand for wood pellets in the UK and Europe is fueled by misguided energy policies, which
incorrectly assume that burning wood will lower carbon emissions and help address climate change.
These policies appear to subscribe to the wood pellet and power industry claim that burning wood is a
carbon neutral process because new trees will eventually absorb and store the carbon that was released
when wood is burned. In addition, industry claims of sustainability are often based on citing positive
growth to harvest rates in the South. We dispute these claims for the following reasons:
First, a growing body of evidence suggests that trees rather than wood waste are the primary source of
the wood pellets exported to the UK from the Southern US. Recent advances in science and accounting
for pollution from different types of woody biomass have clarified that burning trees to produce
electricity actually increases carbon emissions compared with fossil fuels for many decades and
contributes to other air pollution problems.”
etc etc
DRAX is spending £700 million to kill trees and produce more CO2 all because of EU directives claiming wood is “carbon neutral” and therefore eligible for green subsidies.
What an insane world.
The title of this post is not one I ever expected to write … even when I write a post mocking the evil greenies.
“Investigators from the National Fish and Wildlife Forensics Laboratory, in a report kept confidential until this week, describe the power towers as a “mega trap” that claims layers of species in the same food chain. The lab is part of the U.S. Fish and Wildlife Service.
“There were hundreds upon hundreds of butterflies (including monarchs, Danaus plexippus) and dragonfly carcasses,” the investigators said. “Some showed singeing, and many appeared to have just fallen from the sky. … Birds were also observed feeding on the insects. At times birds flew into the solar flux and ignited.””
Forensics lab staff observed a falcon or falcon-like bird with a plume of smoke streaming from its tail as it passed through the heat zone. The bird lost stability and descended, but the team could not locate it. The investigators could not identify many burning objects, which they call streamers.
“We observed many streamer events,” the report said. “It is claimed that these events represent the combustion of loose debris, or insects. Although some of the events are likely that, there were instances in which the amount of smoke produced by the ignition could only be explained by a larger flammable biomass such as a bird. Indeed, OLE (office of law enforcement) staff observed birds entering the solar flux and igniting, consequently becoming a streamer.
“OLE staff observed an average of one streamer event every two minutes.”
Read the rest … if you can.
(h/t Master Resource Blog)
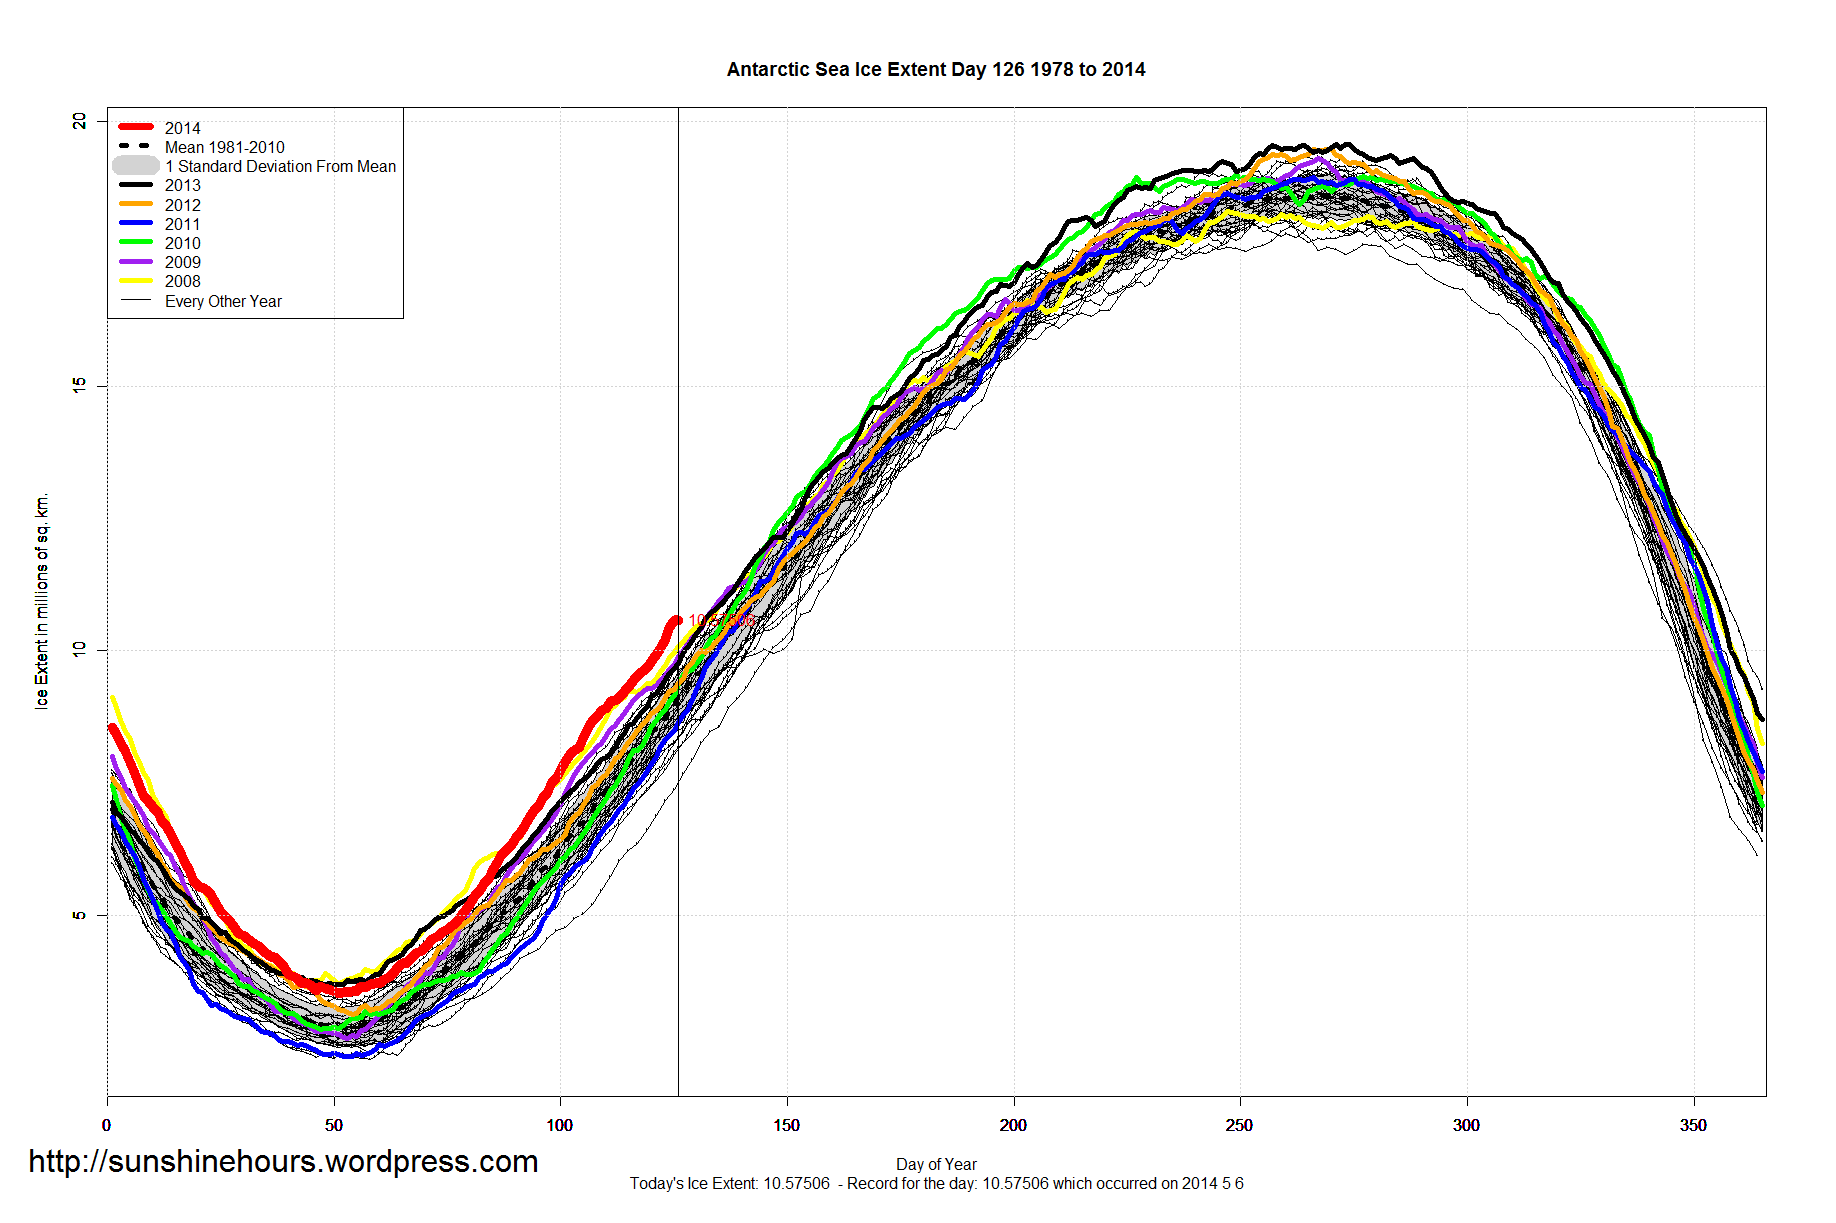
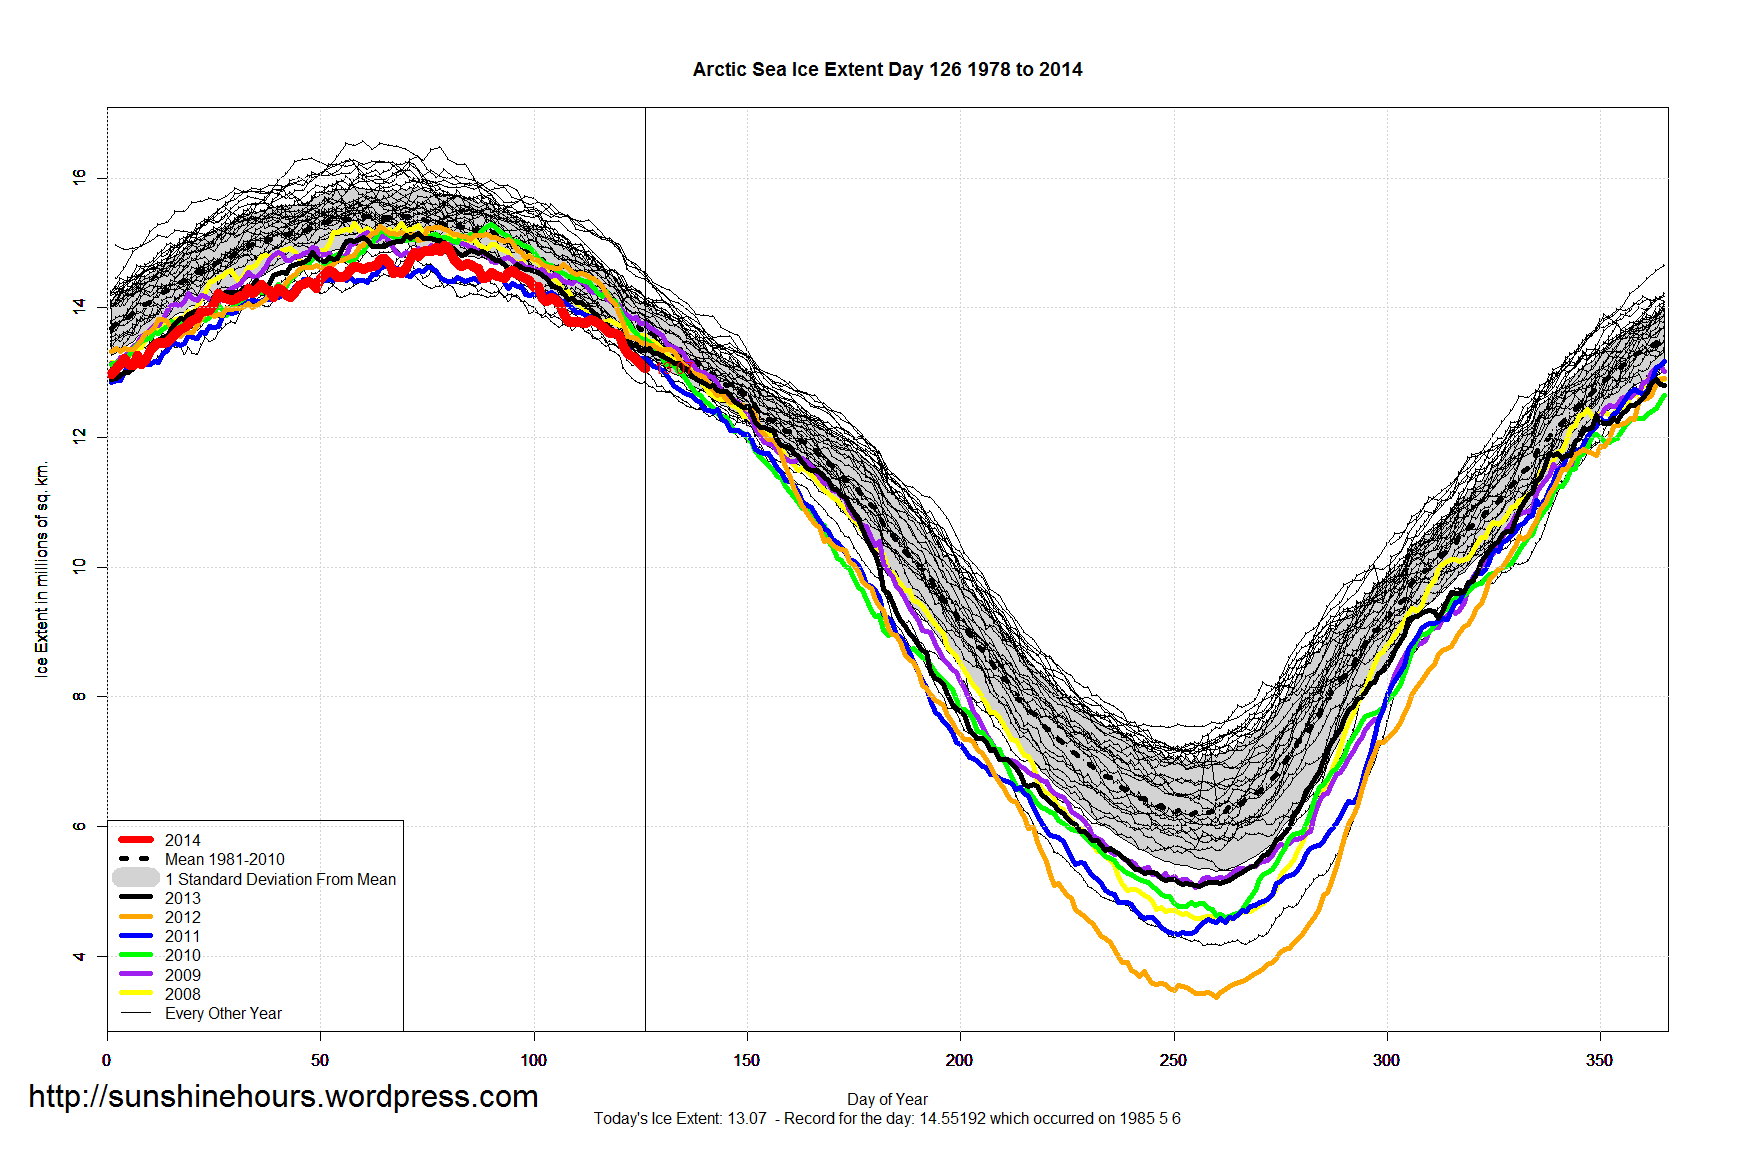
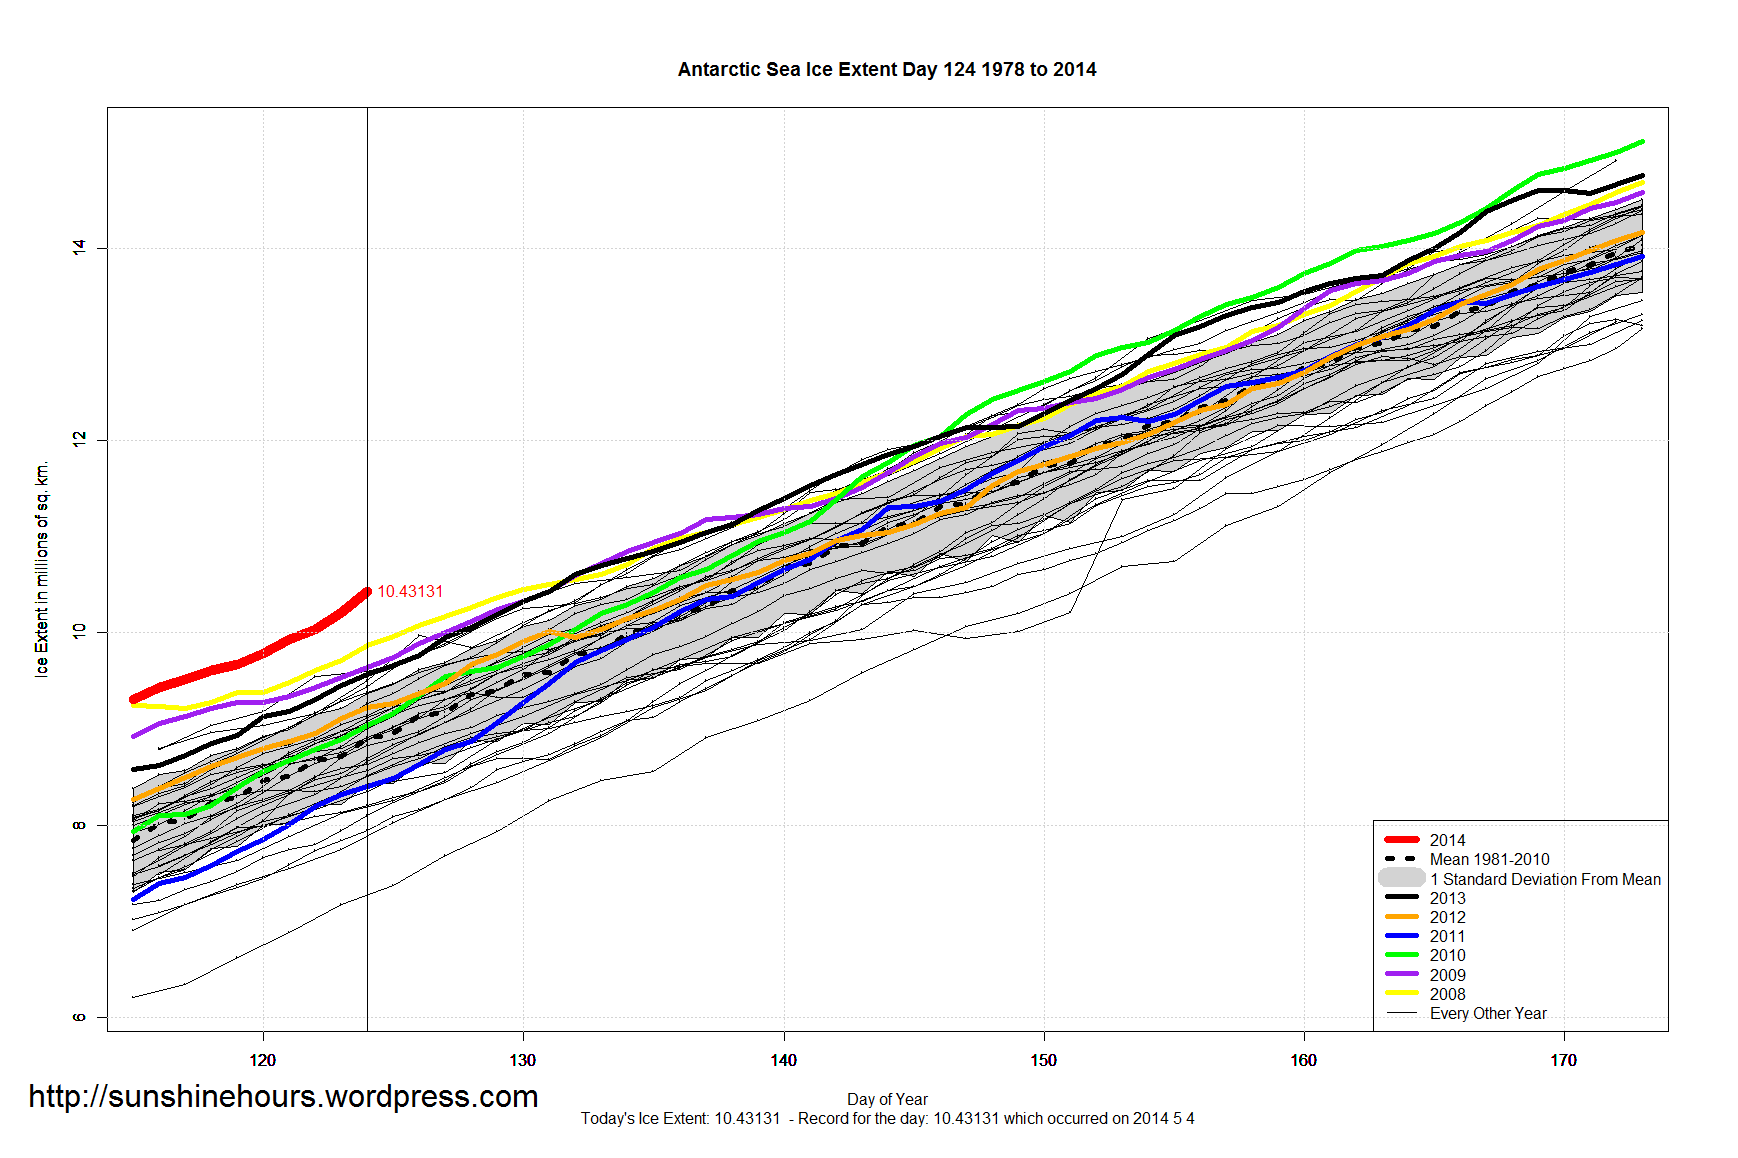
Update: Since March 27 Antarctic Sea Ice Extent has been more than two standard deviations above normal. 82 days out of 126.
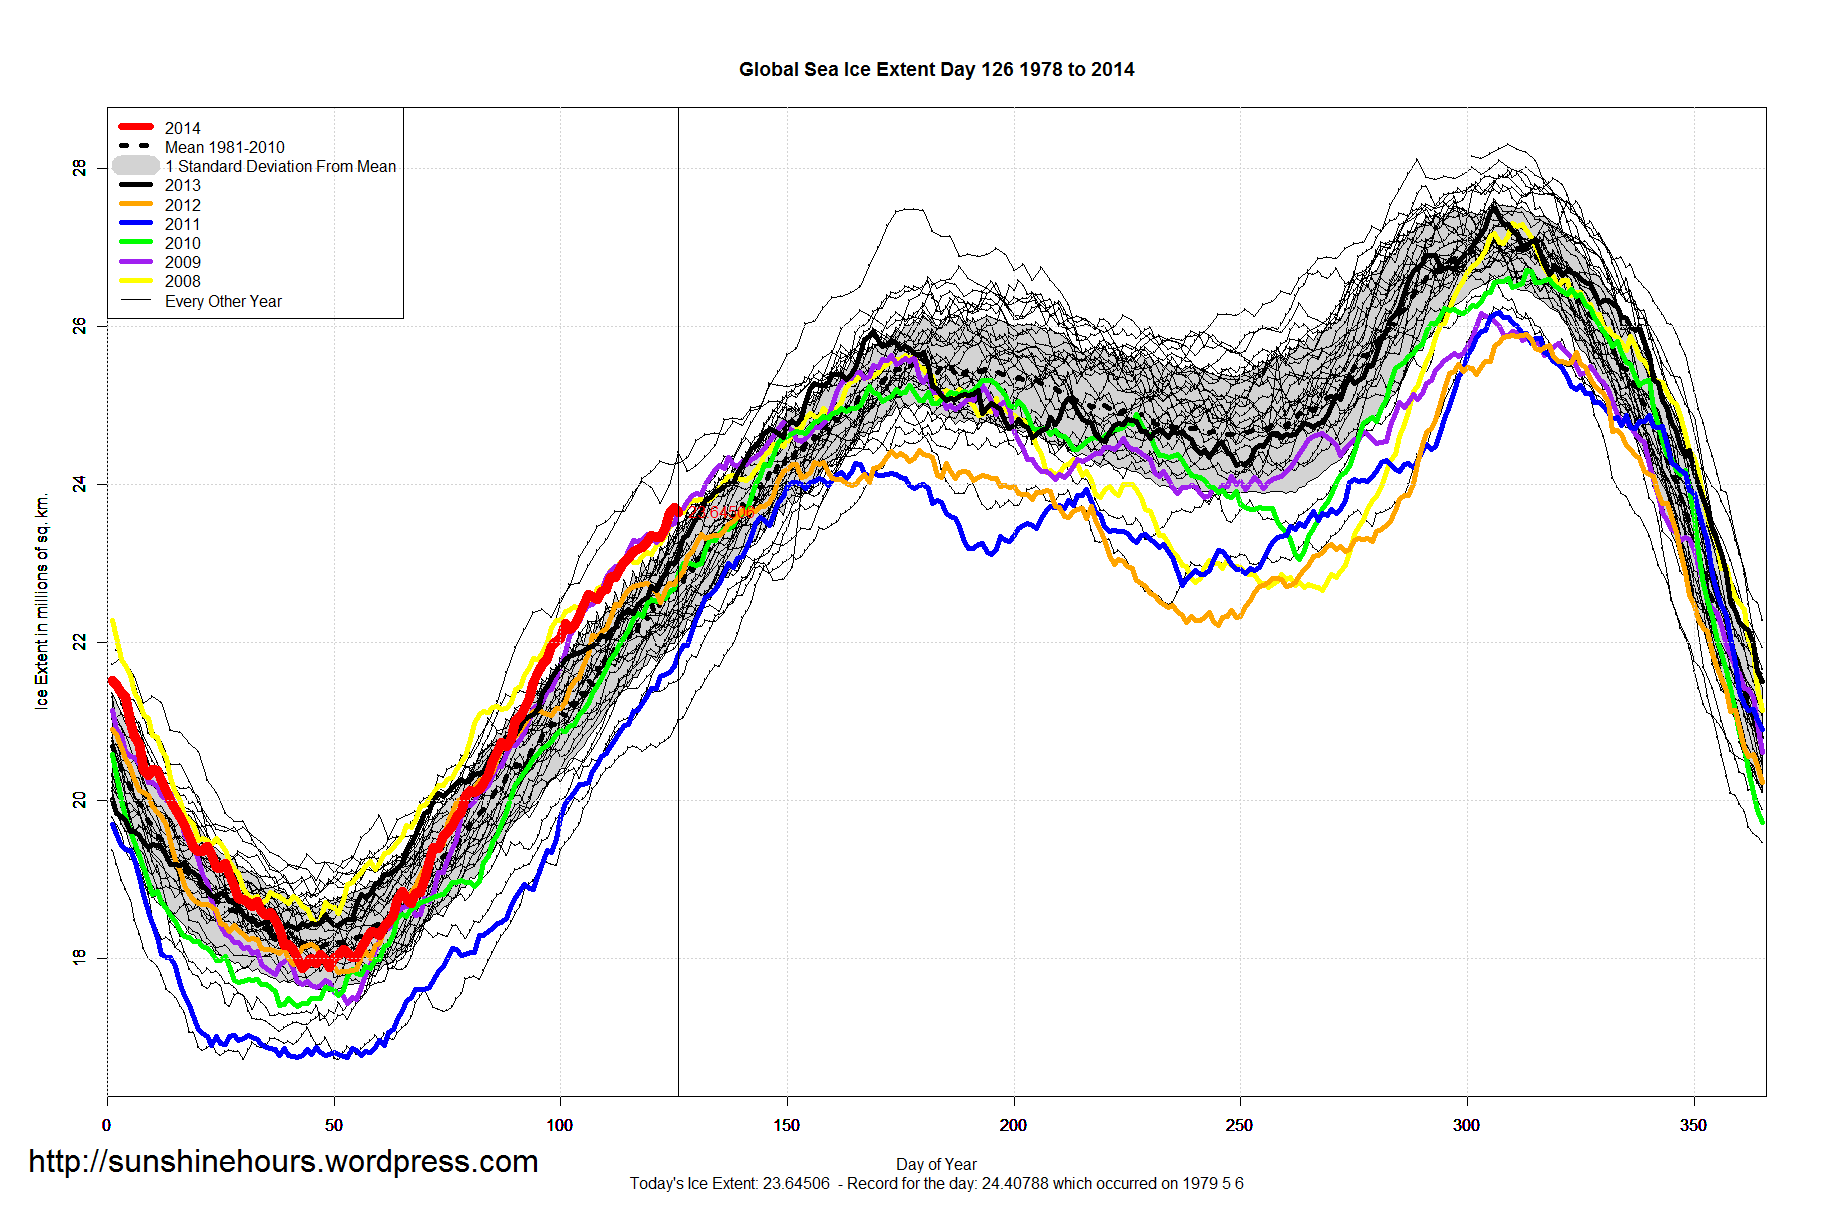
A quick update for sea ice extent for day 126 of 2014:
Graphs below. (The big view for a change) Click for bigger.
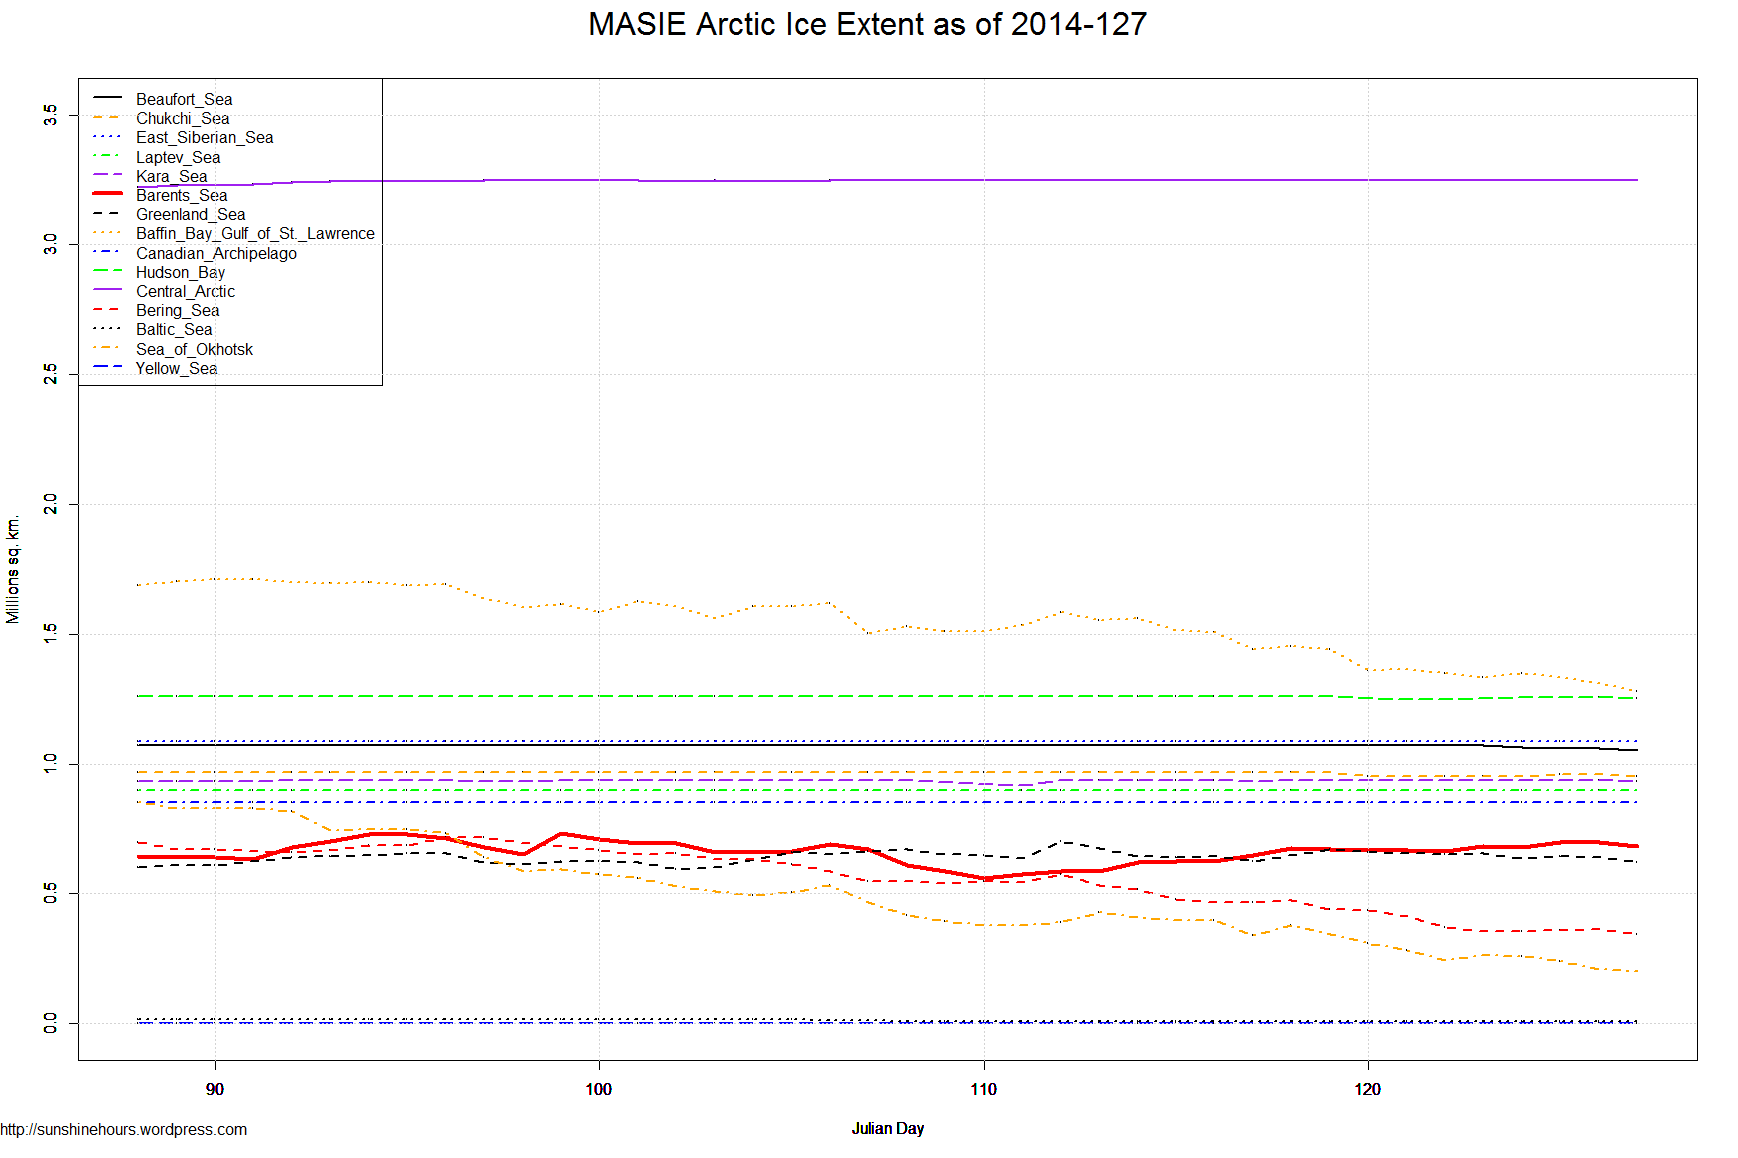
May 6 2014 MASIE Update (This Arctic Sea Ice dataset from MASIE only has 28 days of data.)
This is the gain/loss from day 94 to day 121. Negative = loss. Sorted with biggest loser in last 7 days at top. Northern Hemisphere is the grand total.
Normally I only show Last 28,14 and 7. Today I added Last 3 days because it was so interesting.
In the last 3 days Northern Hemisphere actually rose 2,503 sq km because Barents Sea rose 34,216 sq km.
Hudson Bay, Baltic and Chukchi Sea also rose. This rise hasn’t shown up on the NOAA dataset.
| Region | Start | End | Last 28 Days | Last 14 | Last 7 | Last 3 |
| Sea of Okhotsk | 587,542 | 239,550 | -347,992 | -136,916 | -137,139 | -5,462 |
| Baffin Bay Gulf of St. Lawrence | 1,602,768 | 1,335,175 | -267,593 | -198,696 | -119,337 | -13,664 |
| Bering Sea | 695,431 | 359,469 | -335,961 | -185,286 | -114,606 | -10,071 |
| Beaufort Sea | 1,070,445 | 1,060,123 | -10,322 | -10,322 | -10,322 | -10,322 |
| Hudson Bay | 1,260,903 | 1,254,692 | -6,211 | -6,211 | -6,211 | 4,234 |
| Chukchi Sea | 966,006 | 961,021 | -4,985 | -4,985 | -4,985 | 8,600 |
| Greenland Sea | 613,925 | 645,689 | 31,765 | 9,194 | -3,962 | -5,195 |
| Baltic Sea | 15,566 | 8,402 | -7,163 | -976 | -323 | 184 |
| East Siberian Sea | 1,087,137 | 1,087,137 | 0 | 0 | 0 | 0 |
| Laptev Sea | 897,845 | 897,845 | 0 | 0 | 0 | 0 |
| Kara Sea | 931,339 | 935,023 | 3,684 | 16,849 | 0 | 0 |
| Canadian Archipelago | 853,214 | 853,214 | 0 | 0 | 0 | 0 |
| Central Arctic | 3,247,200 | 3,248,013 | 813 | 1,482 | 0 | 0 |
| Yellow Sea | 0 | 0 | 0 | 0 | 0 | 0 |
| Barents Sea | 651,565 | 699,064 | 47,499 | 125,742 | 23,541 | 34,216 |
| Northern Hemisphere (Total) | 14,485,805 | 13,586,610 | -899,195 | -390,141 | -373,360 | 2,503 |
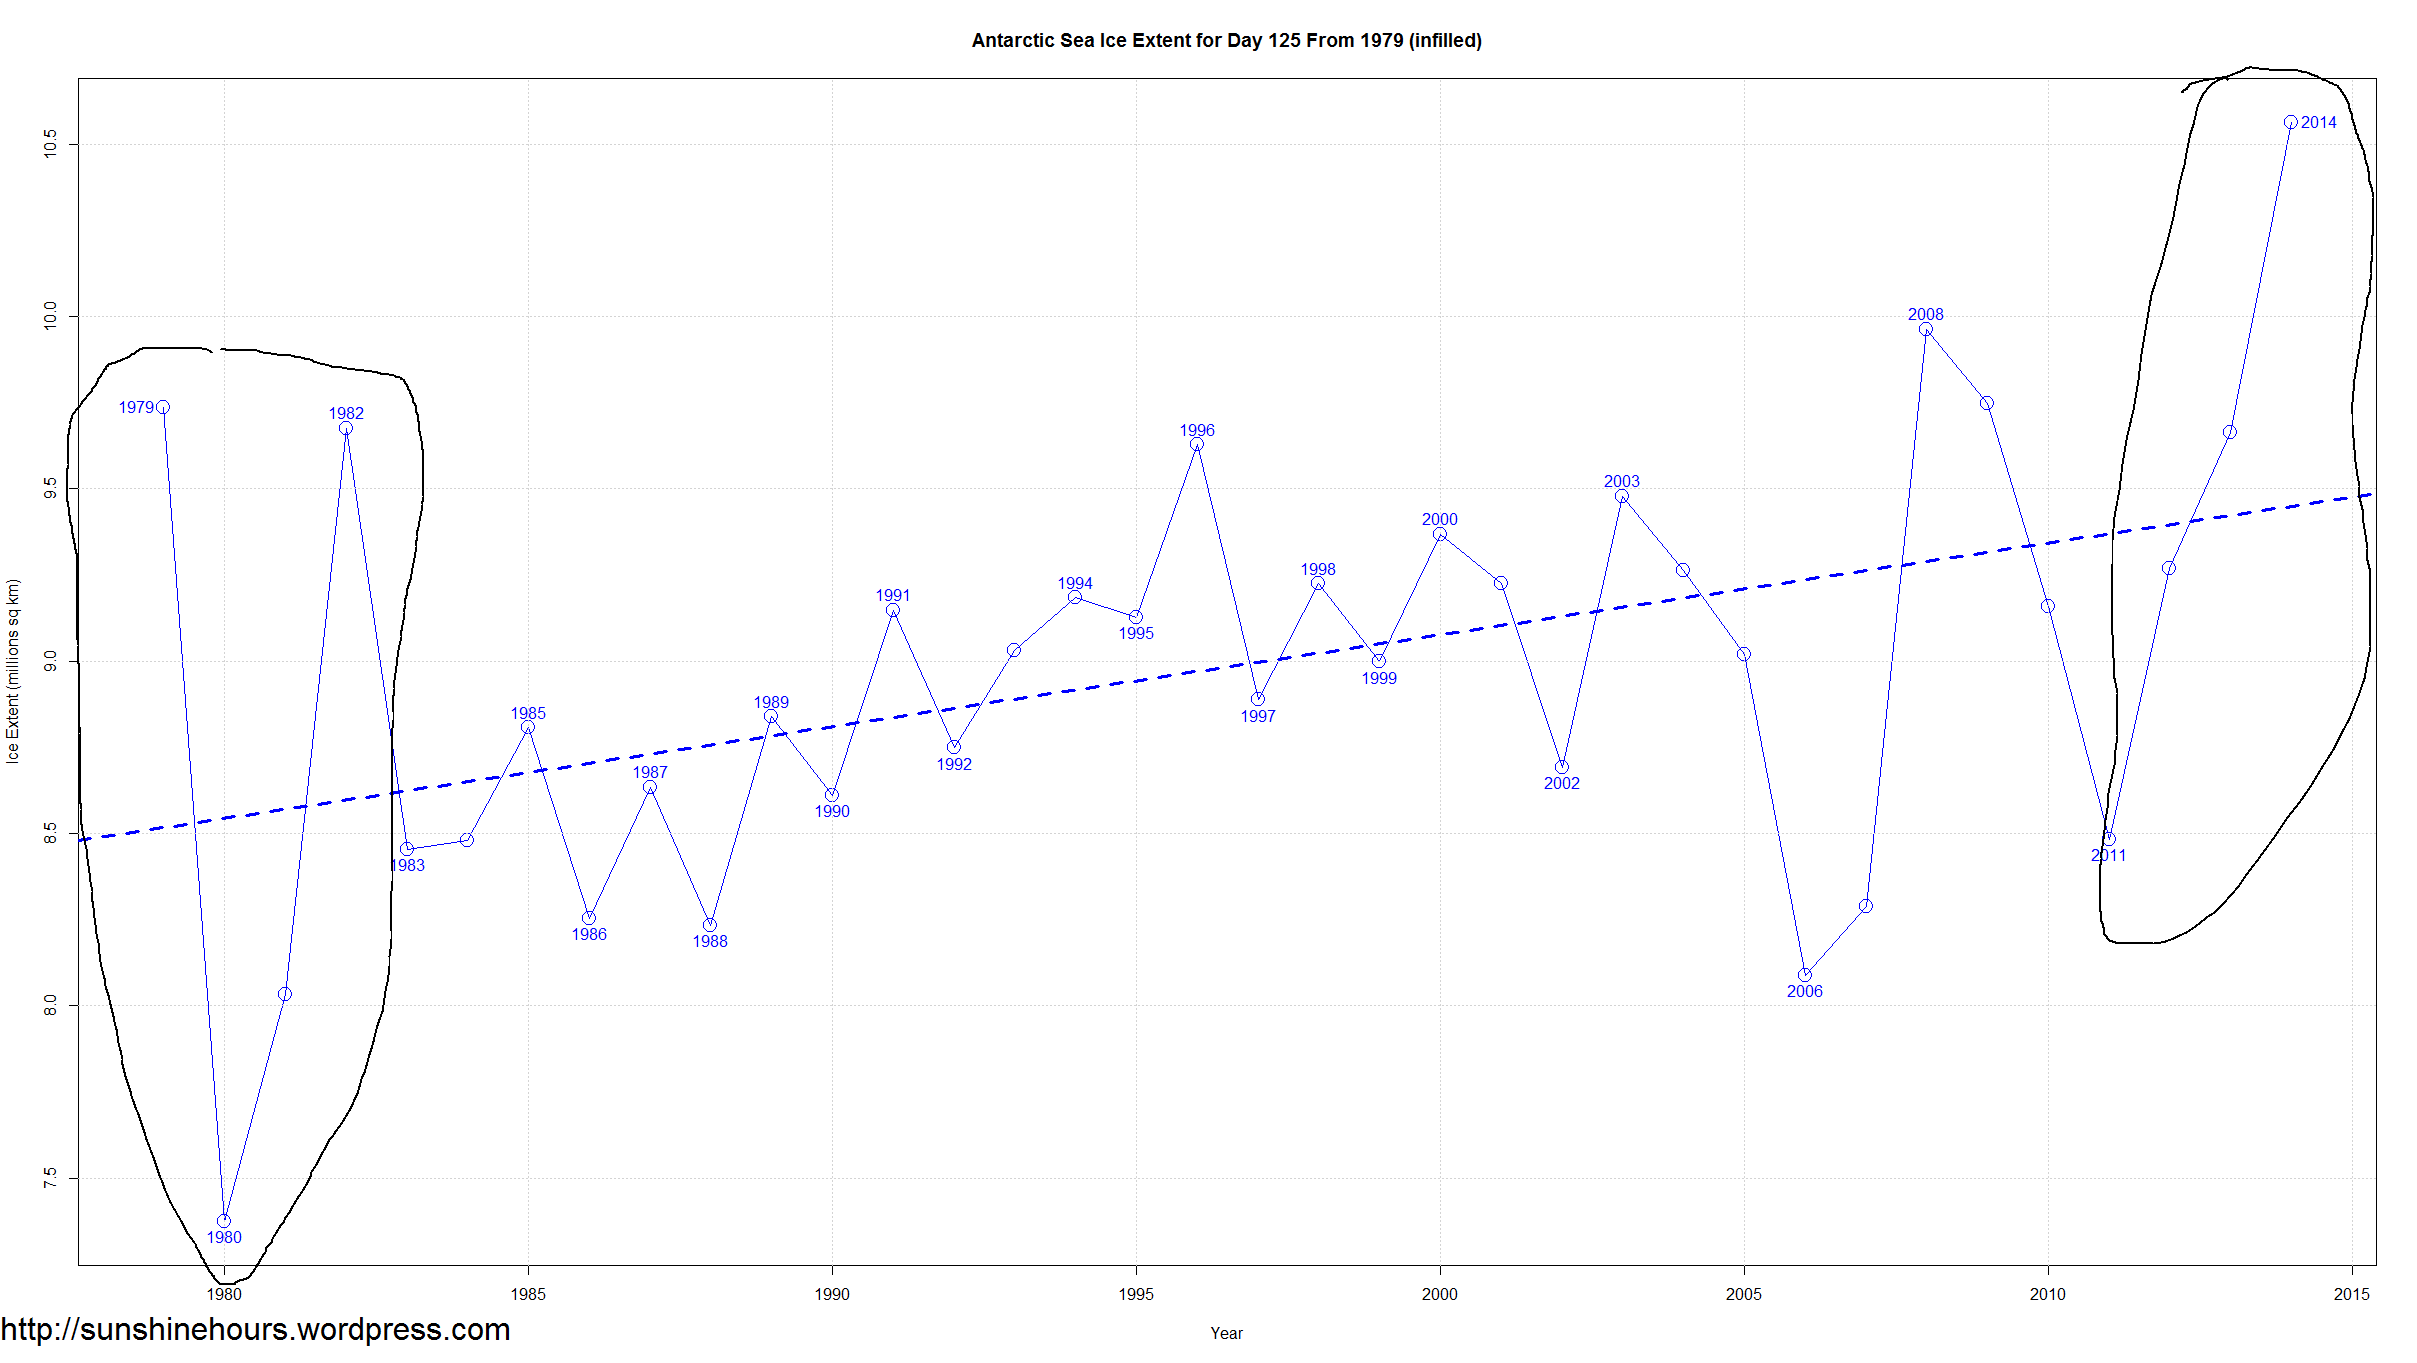
I don’t know what it means, but I’ve been aware of an oscillation pattern in Antarctic Sea Ice Extent for some time.
A while ago I noted the time between oscillations. Today I am just noting the size of the oscillations.
The current satellite record only started around 1978 (and only a partial years data exists). And until 1986, data only exists for alternating days.
Consider that the AMO is about 66 years long. And 1982 (the end of the big oscillations in the early part of the satellite record) is about 33 years ago I wonder if the big oscillation pattern will come to an end soon in the same way it came to an end after 1982? (Update: Or will it oscillate for 33 years?)
We don’t what happened off to the left of the graph (the pre-satellite era) with certainty. Or why these oscillations were once huge, and then settled down and then resumed their large oscillations again.
Click for larger.
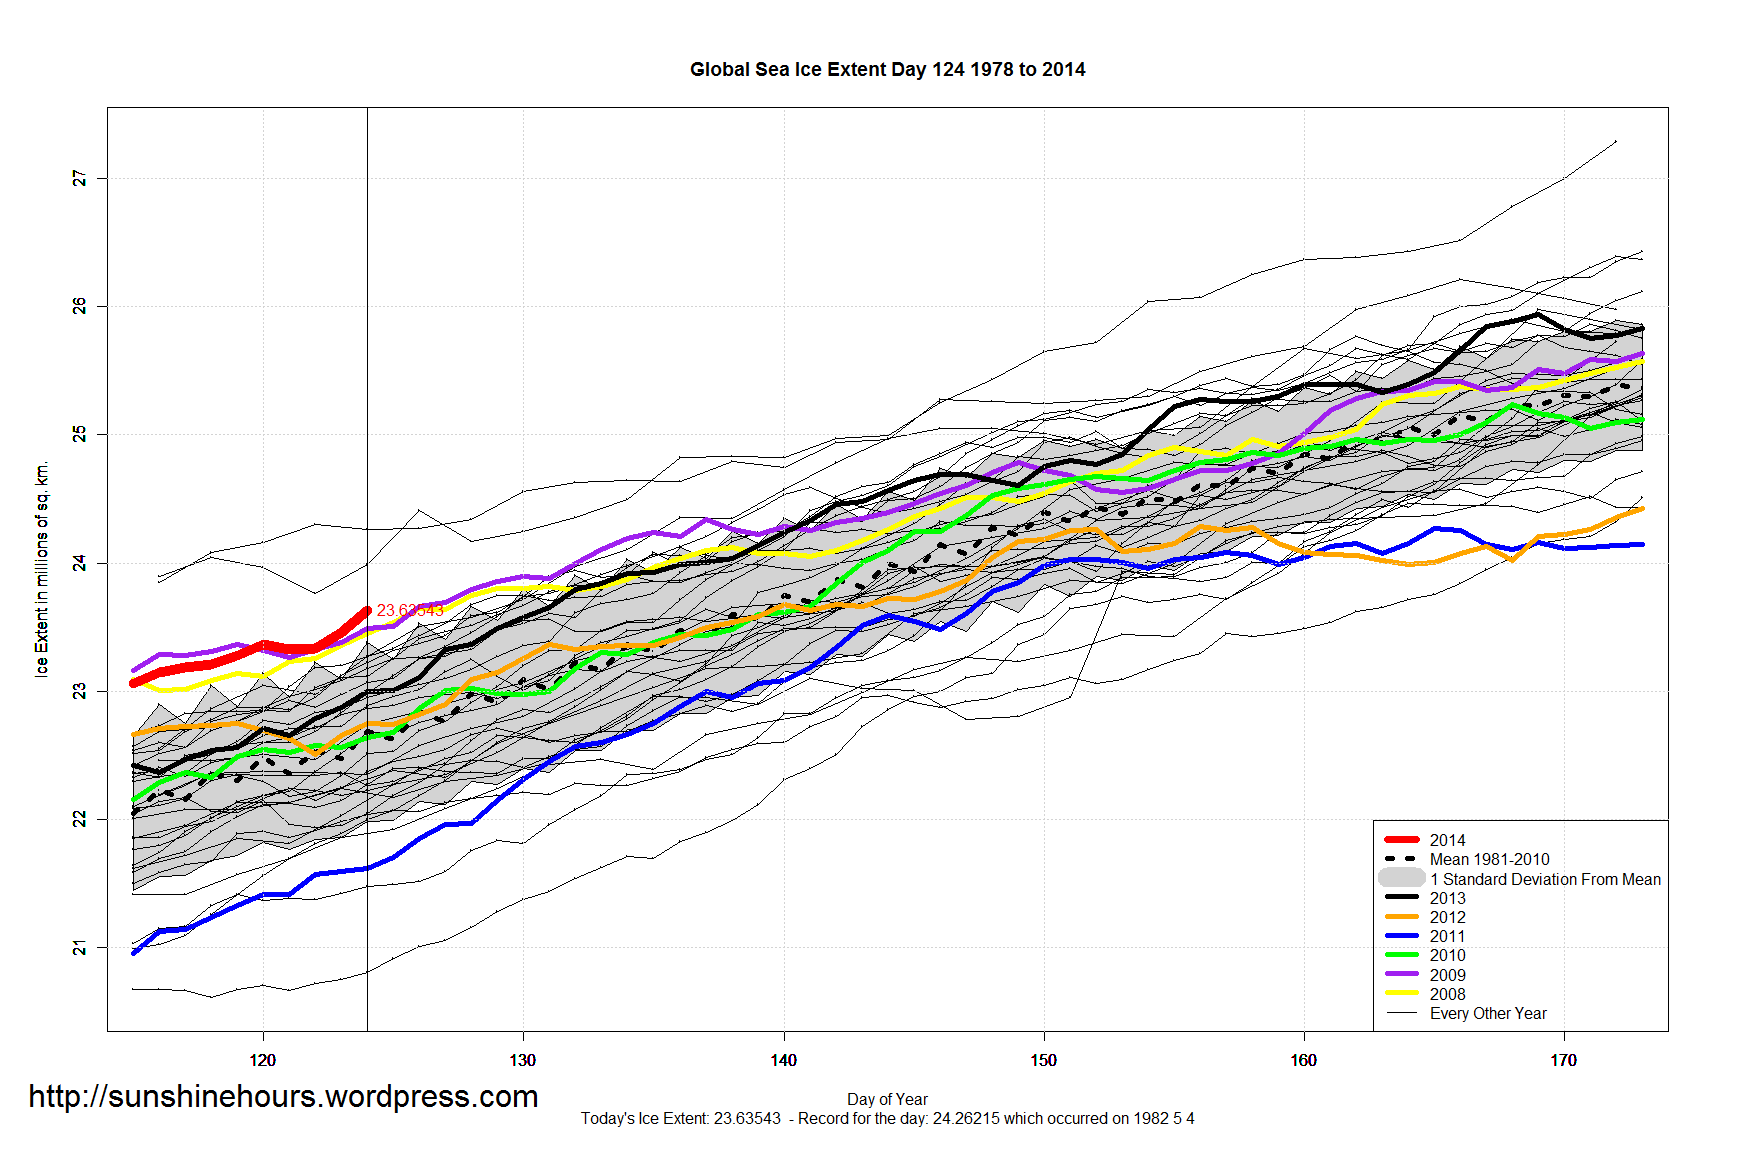
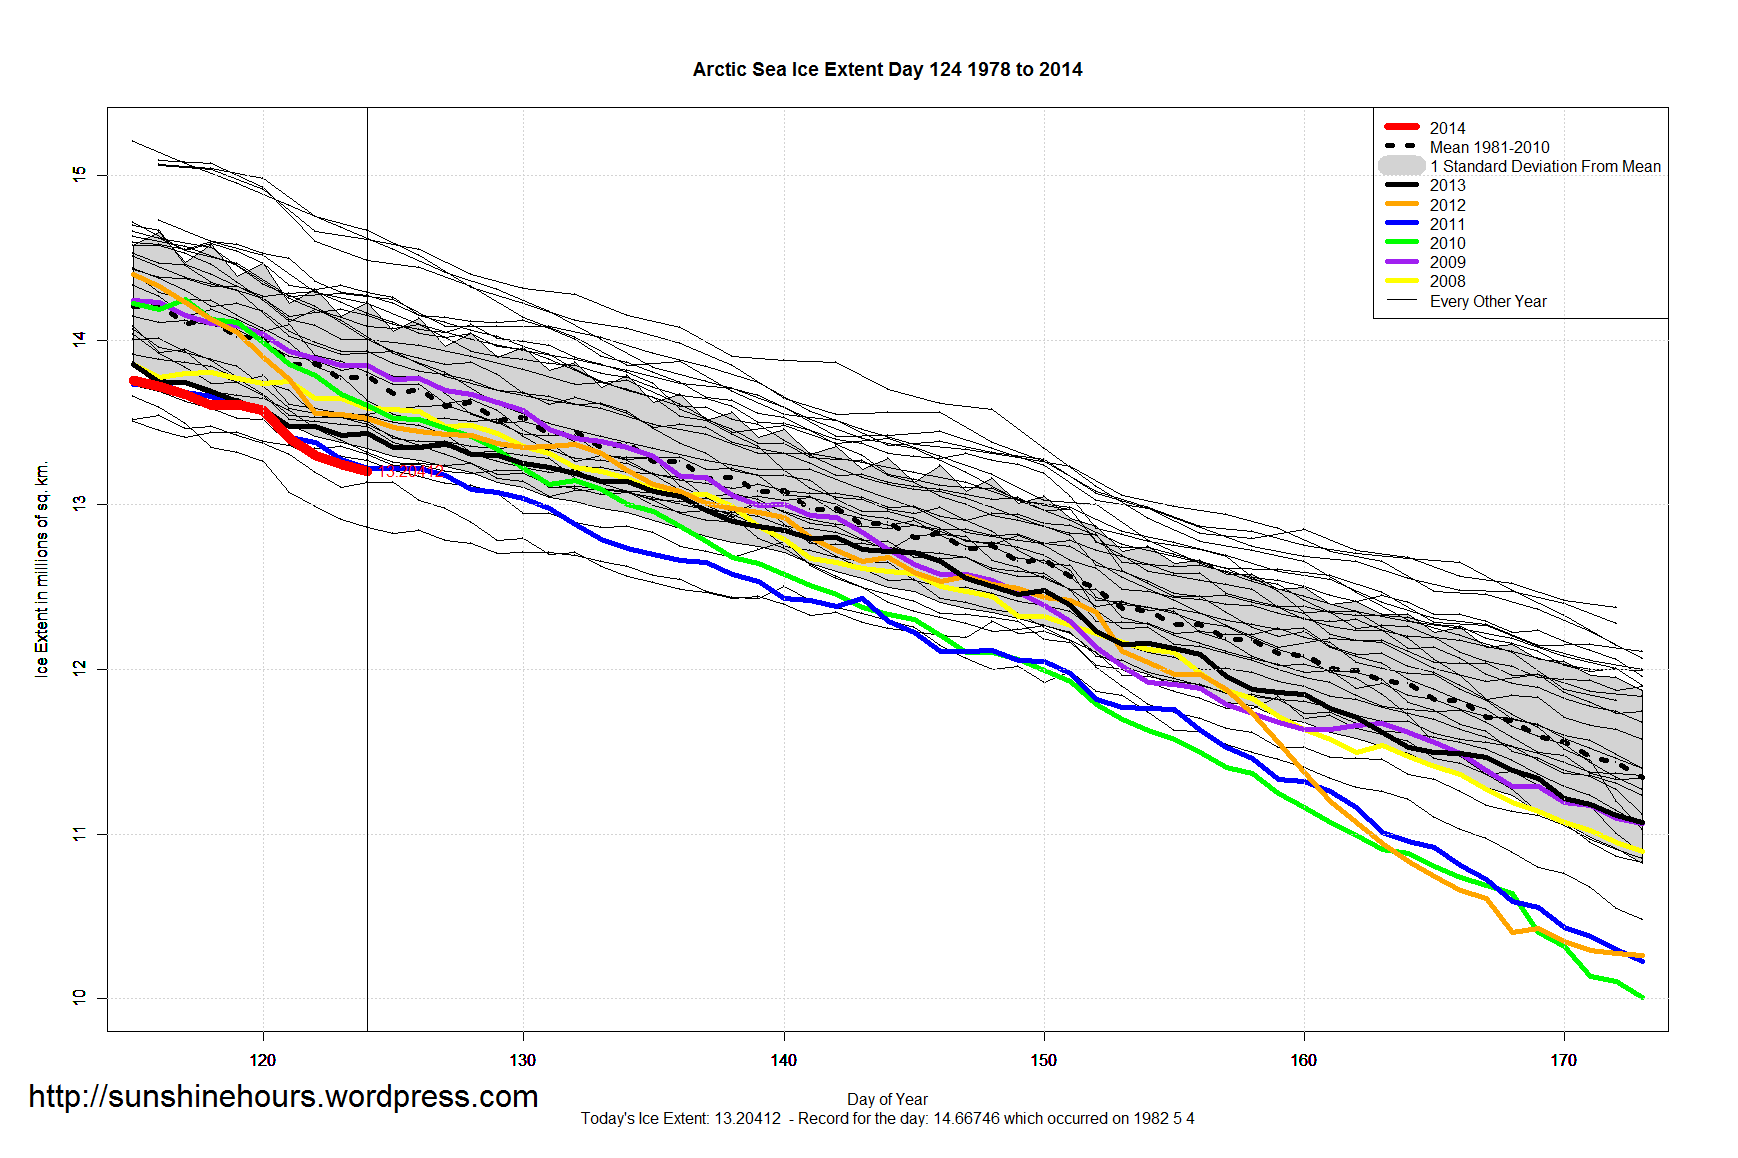
A quick update for sea ice extent for day 124 of 2014:
NOAA Data here and here here. Graphs below. Click for bigger.
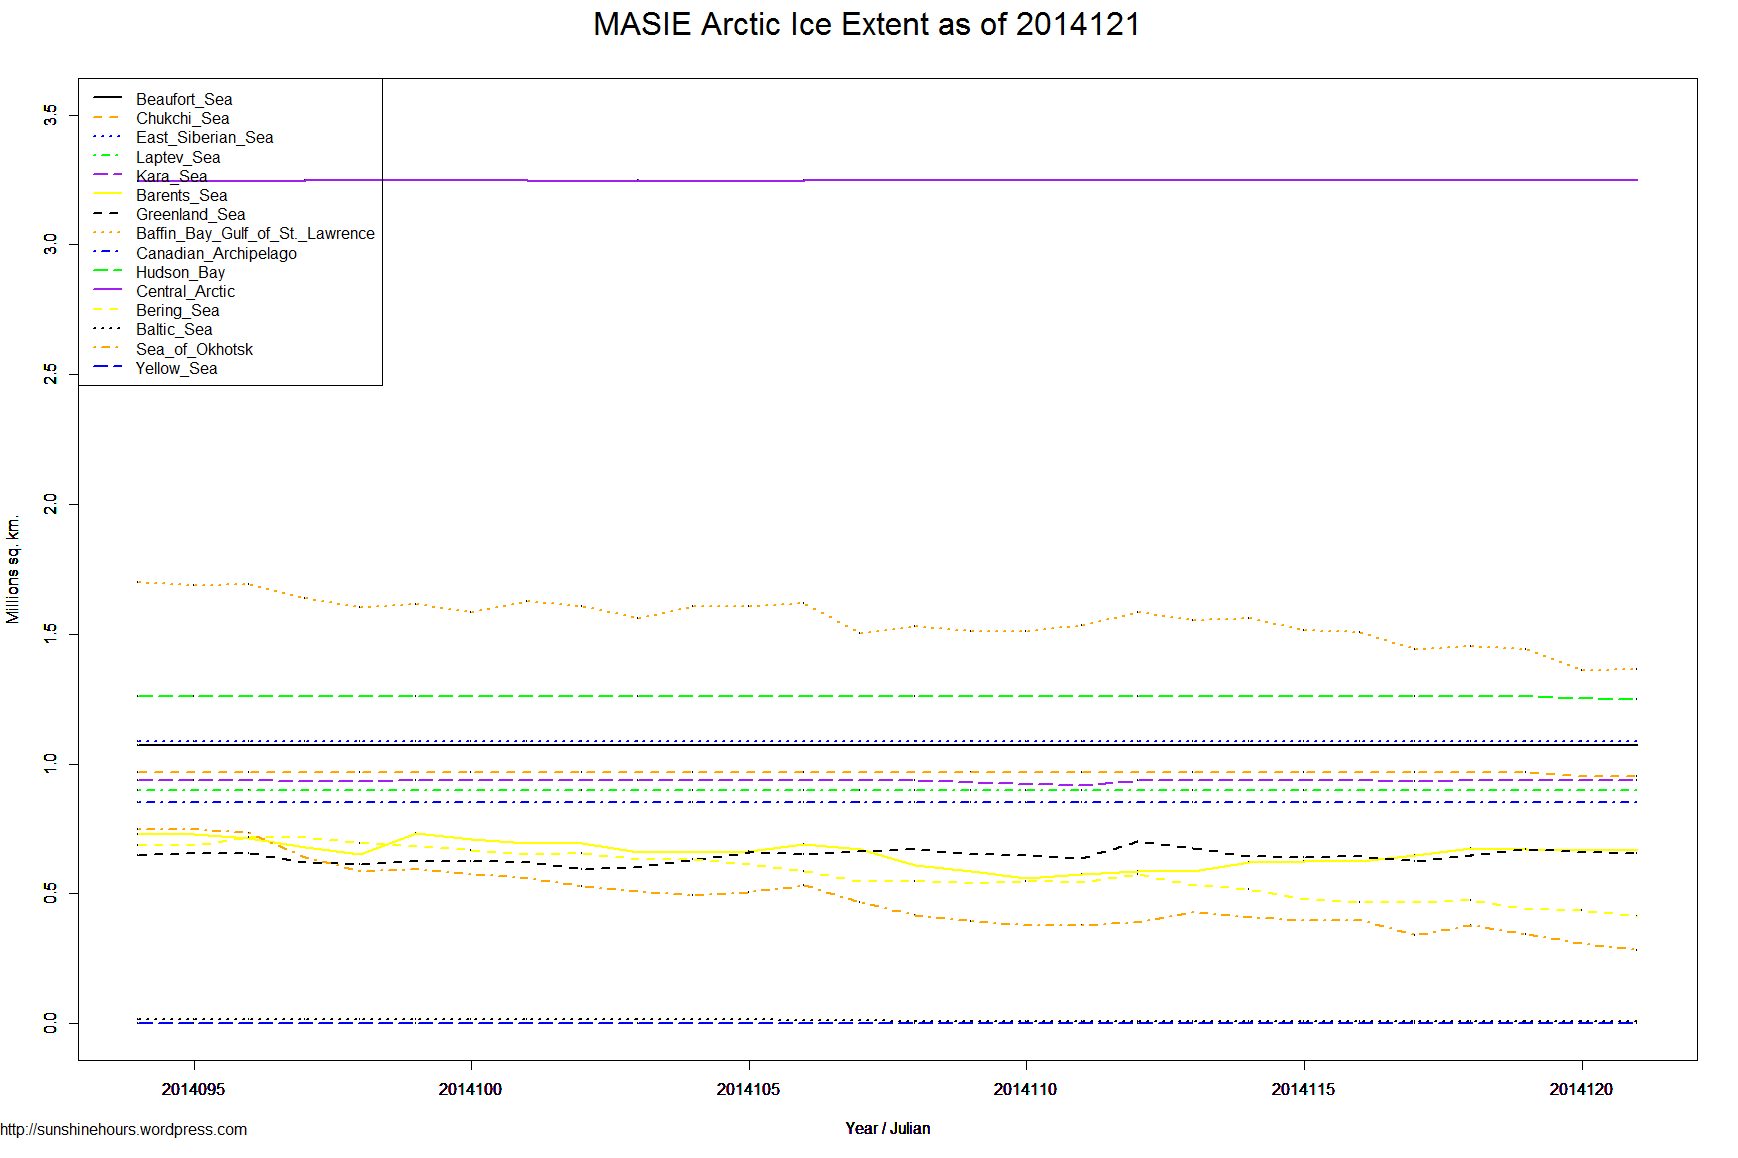
May 3 2014 MASIE Update (This Arctic Sea Ice dataset from MASIE only has 28 days of data.)
This is the gain/loss from day 94 to day 121. Negative = loss. Sorted with biggest loser in last 7 days at top. Northern Hemisphere is the grand total.
The bottom 3 have all gained in last 7 days. Including 44,747 in the Barents Sea.
I assume the Chukchi Sea and Hudson Bay only started melting in last few days since the 7 day melt is the same as the 28 day melt.
The melt has resumed in the last 7 days after a small pause in previous 7.
| Region | Start | End | Last 28 | Last 14 | Last 7 |
| Baffin Bay Gulf of St. Lawrence | 1,698,291 | 1,365,547 | -332,744 | -138,260 | -194,971 |
| Sea of Okhotsk | 749,260 | 282,058 | -467,202 | -184,740 | -128,456 |
| Bering Sea | 685,870 | 412,911 | -272,959 | -134,551 | -103,860 |
| Chukchi Sea | 966,006 | 954,145 | -11,861 | -11,861 | -11,861 |
| Hudson Bay | 1,260,903 | 1,249,193 | -11,710 | -11,710 | -11,710 |
| Beaufort Sea | 1,070,445 | 1,070,445 | 0 | 0 | 0 |
| East Siberian Sea | 1,087,137 | 1,087,137 | 0 | 0 | 0 |
| Laptev Sea | 897,845 | 897,845 | 0 | 0 | 0 |
| Kara Sea | 935,023 | 935,023 | 0 | 0 | 0 |
| Canadian Archipelago | 853,214 | 853,214 | 0 | 0 | 0 |
| Central Arctic | 3,245,697 | 3,248,013 | 2,316 | 0 | 0 |
| Yellow Sea | 0 | 0 | 0 | 0 | 0 |
| Baltic Sea | 16,117 | 8,455 | -7,662 | -2,813 | 99 |
| Greenland Sea | 648,293 | 656,357 | 8,064 | -7,499 | 12,608 |
| Barents Sea | 729,360 | 666,212 | -63,148 | -6,169 | 44,747 |
| Northern Hemisphere (Total) | 14,852,534 | 13,688,761 | -1,163,772 | -497,603 | -393,405 |
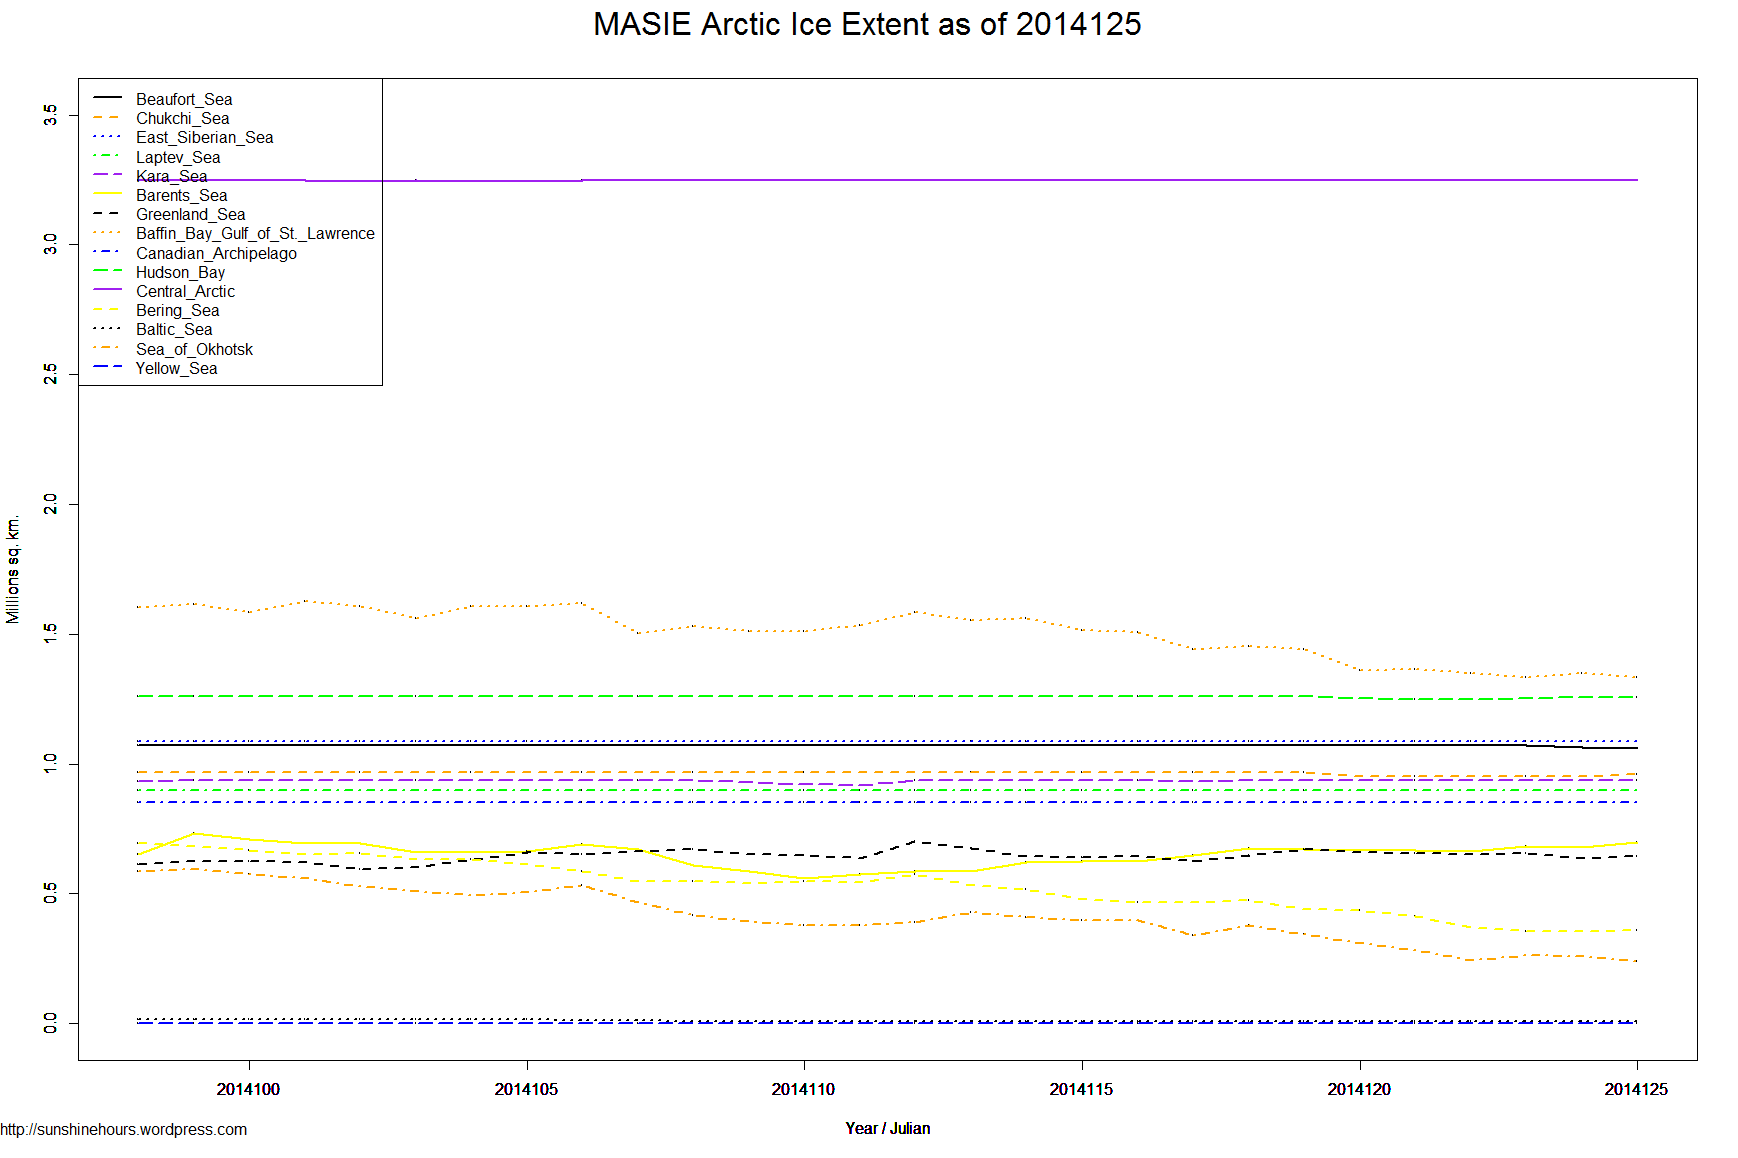
Here is the MASIE graph. The flat lines at the bottom are regions that have melted and are now ice free. The completely flat lines elsewhere indicate no melting at all yet. The changing lines indicate melting regions.
Click for bigger.