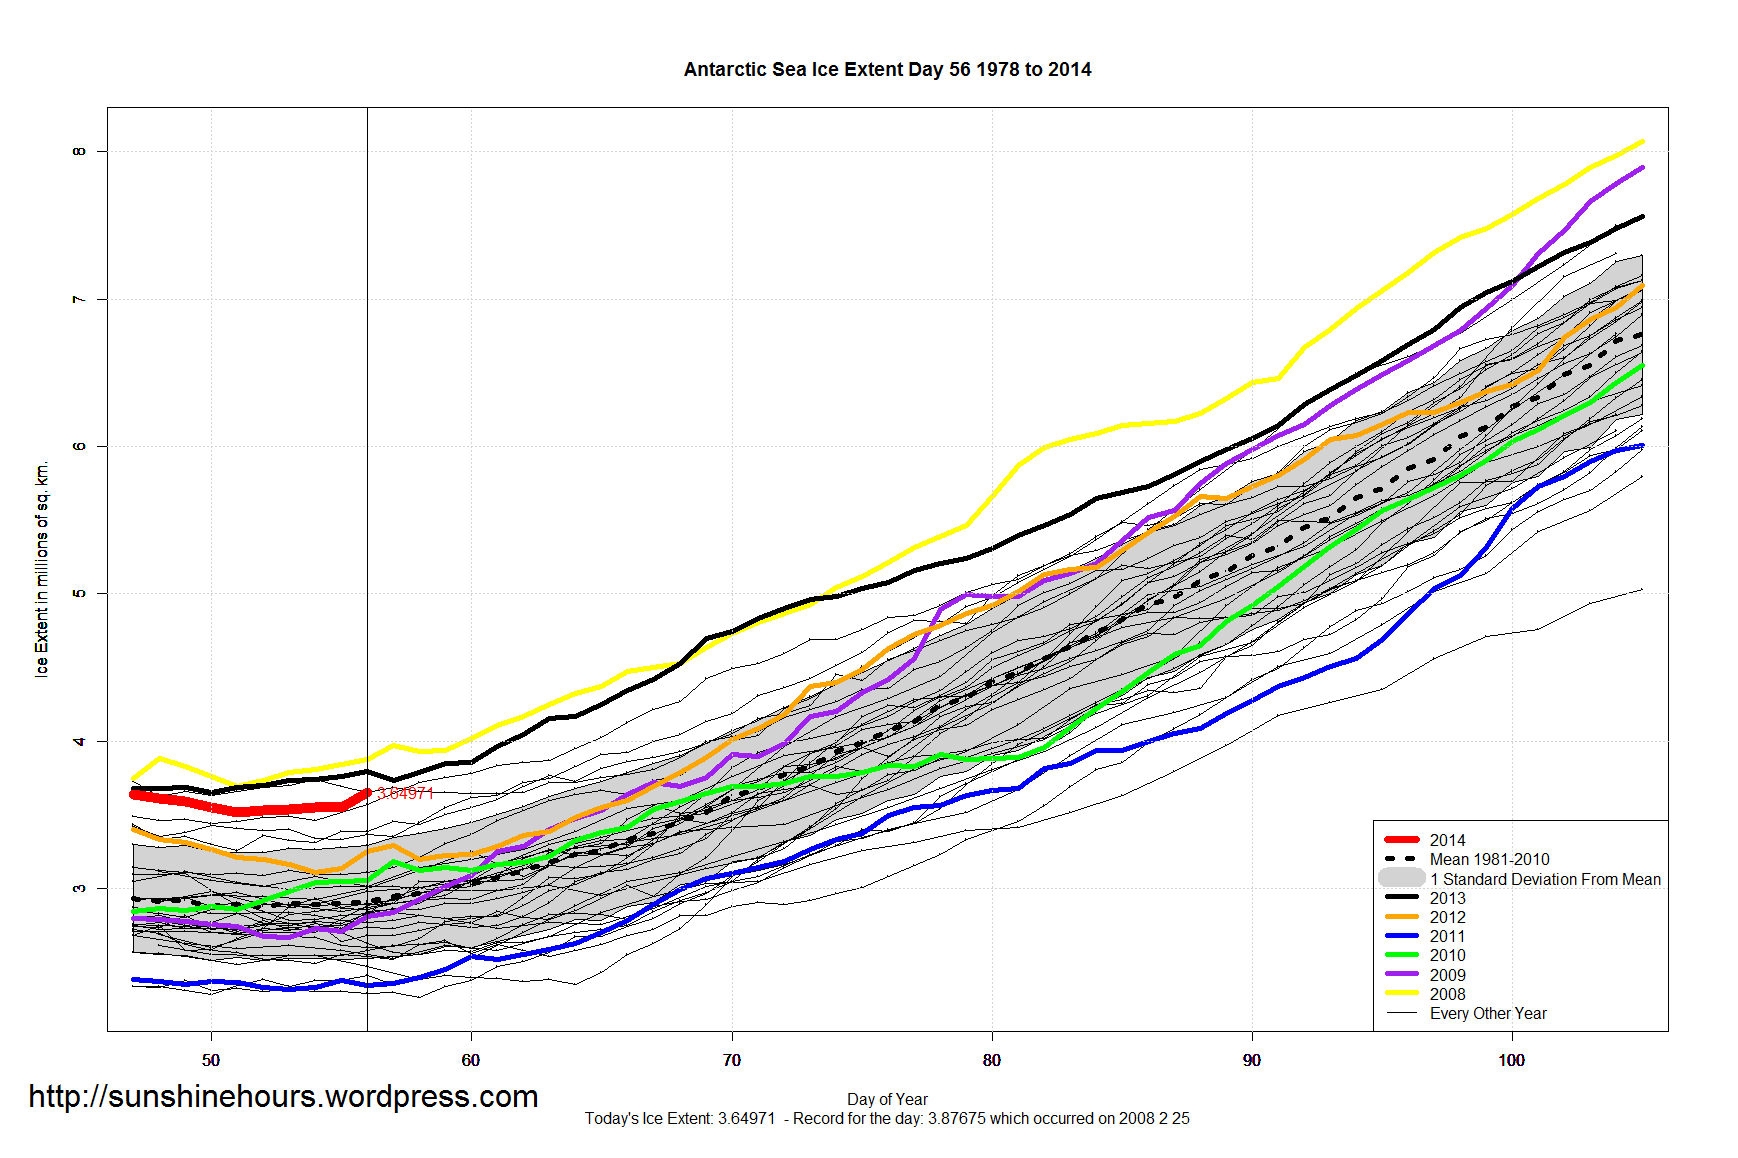
Antarctic Sea Ice Extent has risen for five days in a row, and is now 130,000 sq km above where it was on day 51 (which will probably be the minimum).
Extent is 739,000 sq km above the 1981-2010 mean which is 25%.
Click for bigger.
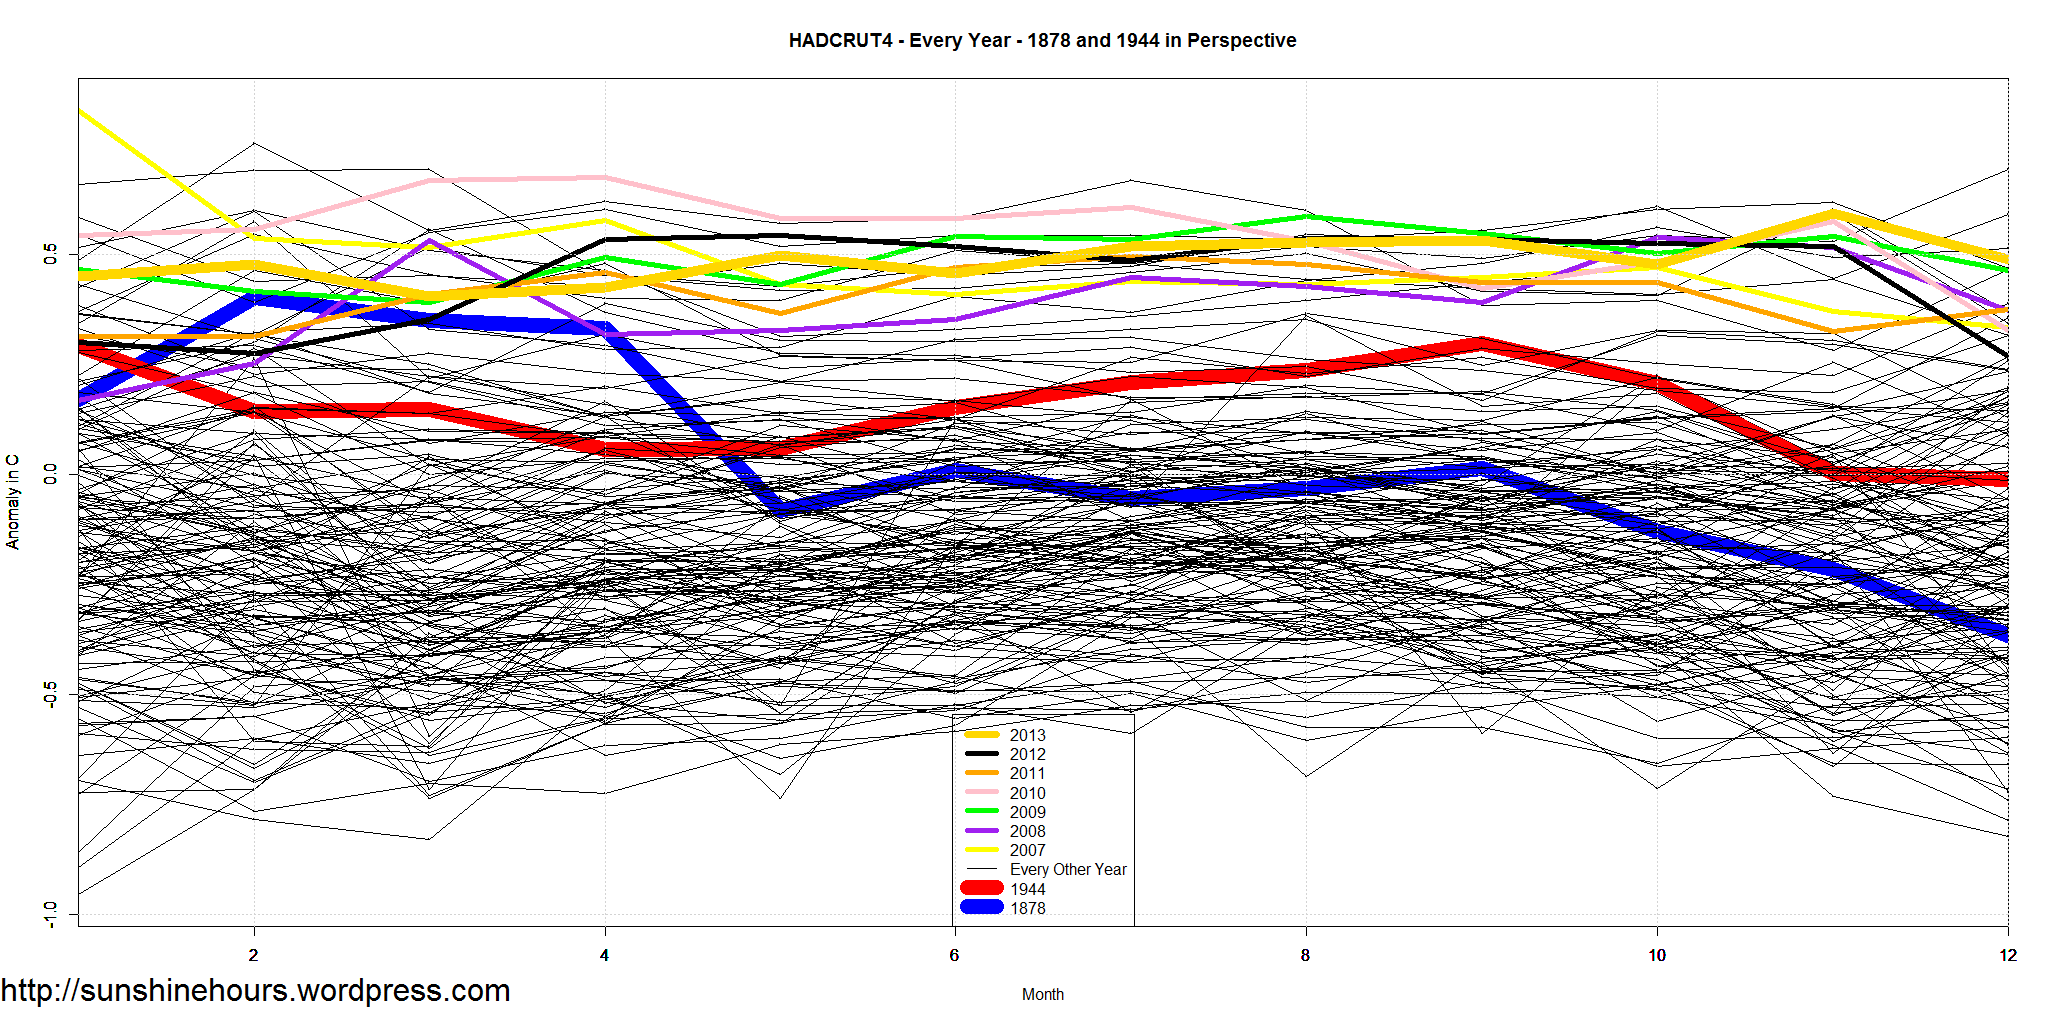
1878 to 1944 is 66 years. 1944 to 2010 is also 66 years. Let us put those peaks in temperature (using HADCRUT4 Global) in perspective.
1944 is red. 1878 is blue. Every year of HADCRUT4 is on the graph. The temperature is the anomaly from the 1961-1990 mean in Celsius. Click for bigger.
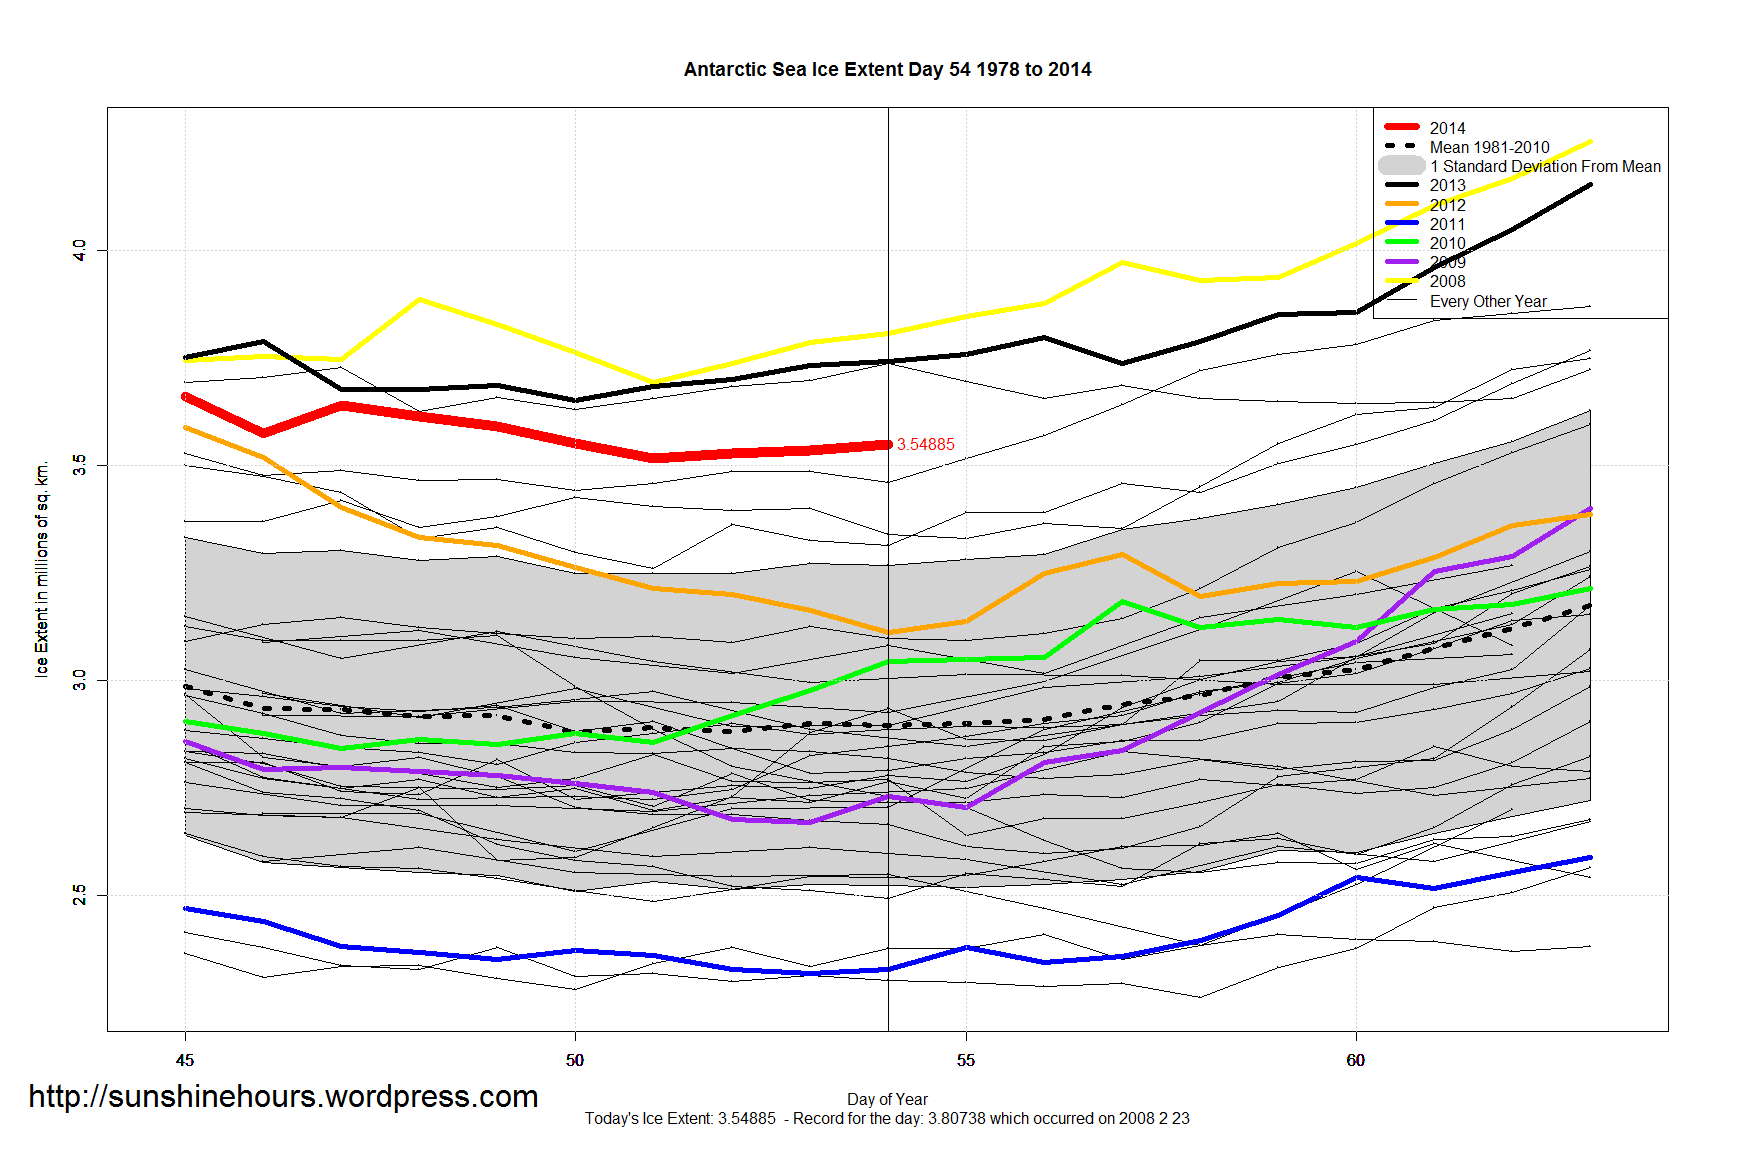
Antarctic Sea Ice Extent has risen for three days in a row. It rose 13,000 sq km and then 7,000 sq km and then 13,000 sq km. Day 51 is potentially to be the minimum, but is still too early to call.
Extent is 653,000 sq km above the 1981-2010 mean which is 22.5%.
A slightly different view today. Only 10 days on each size of Day 54. Click for bigger.
Antarctic Sea Ice Extent has risen for two days in a row. It rose 13,000 sq km and then 7,000 sq km. So day 51 is now potentially the minimum.
Extent is 636,000 sq km above the 1981-201 mean which is 22%.
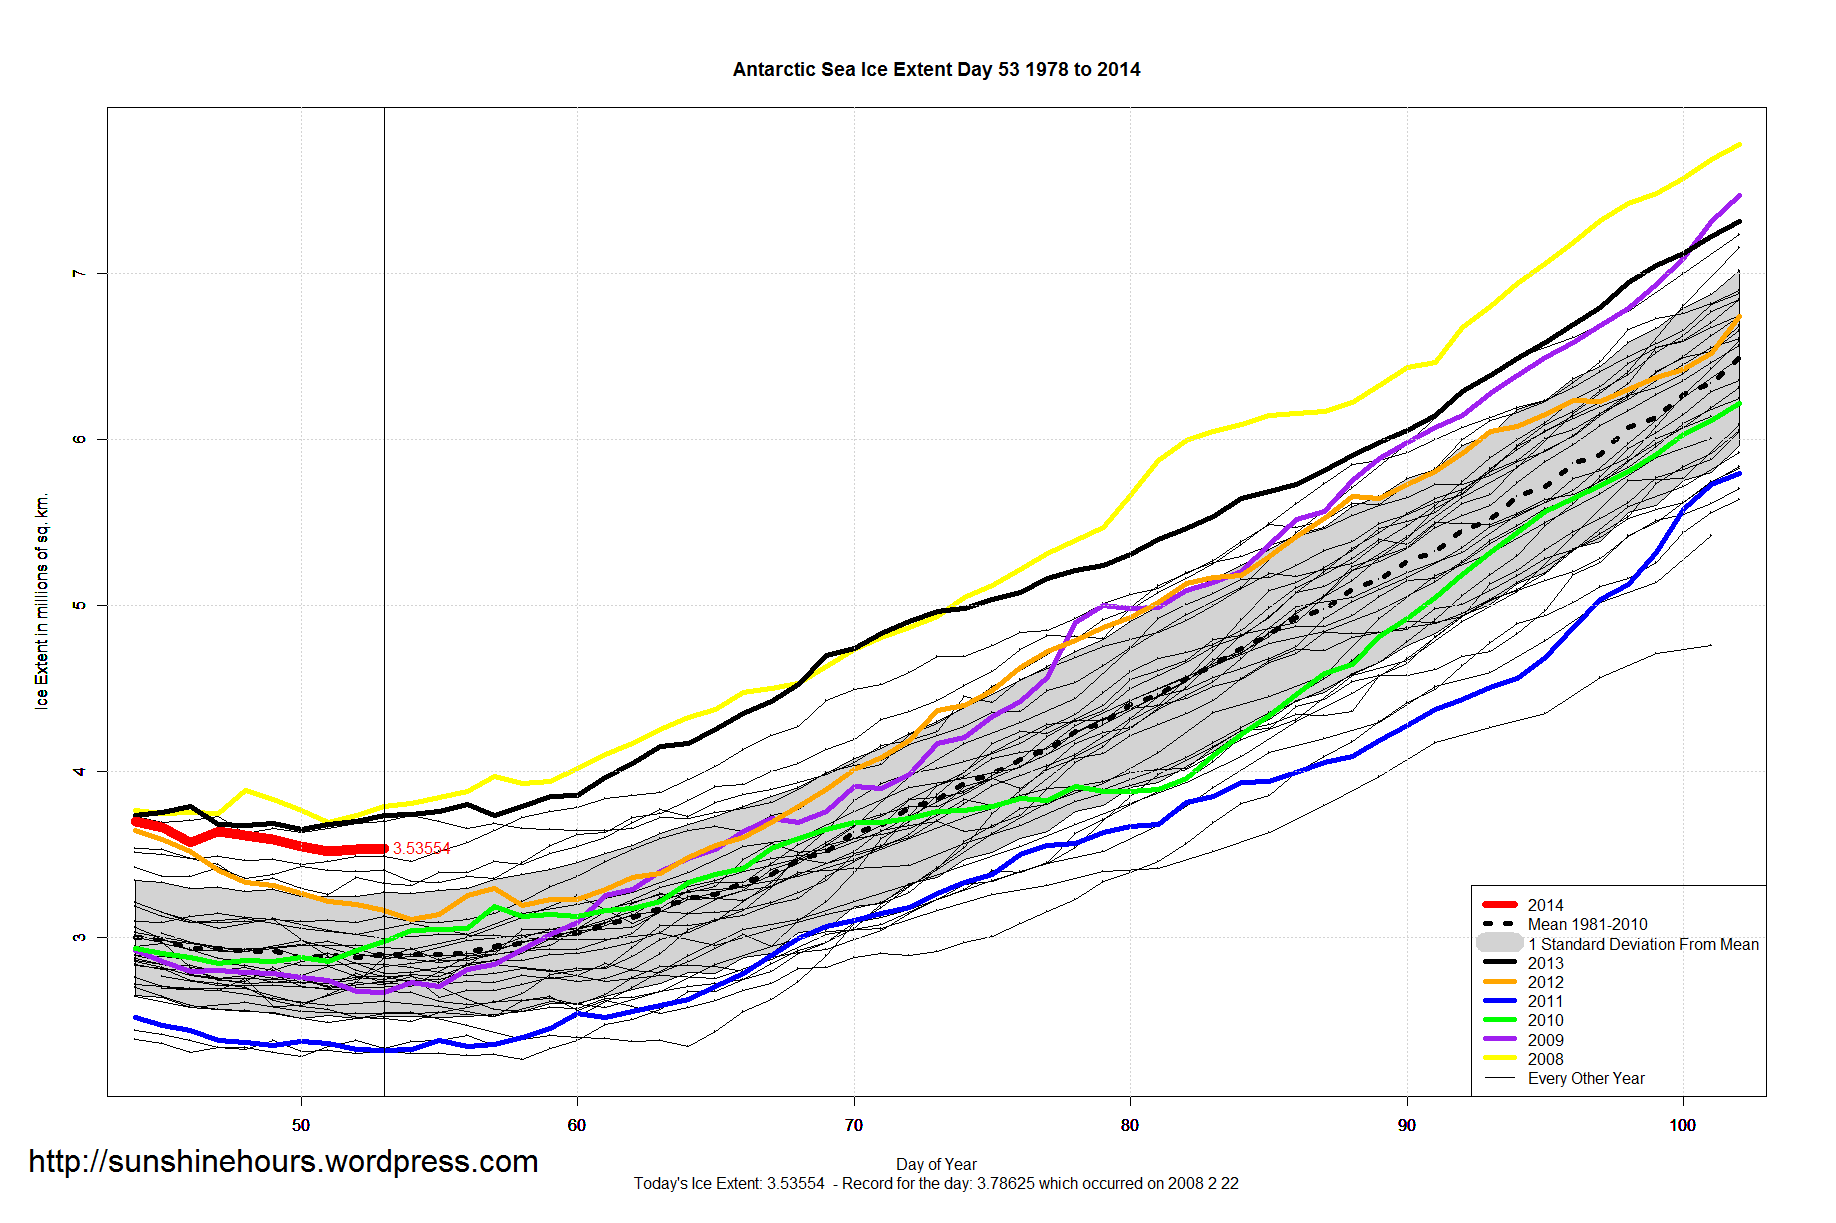

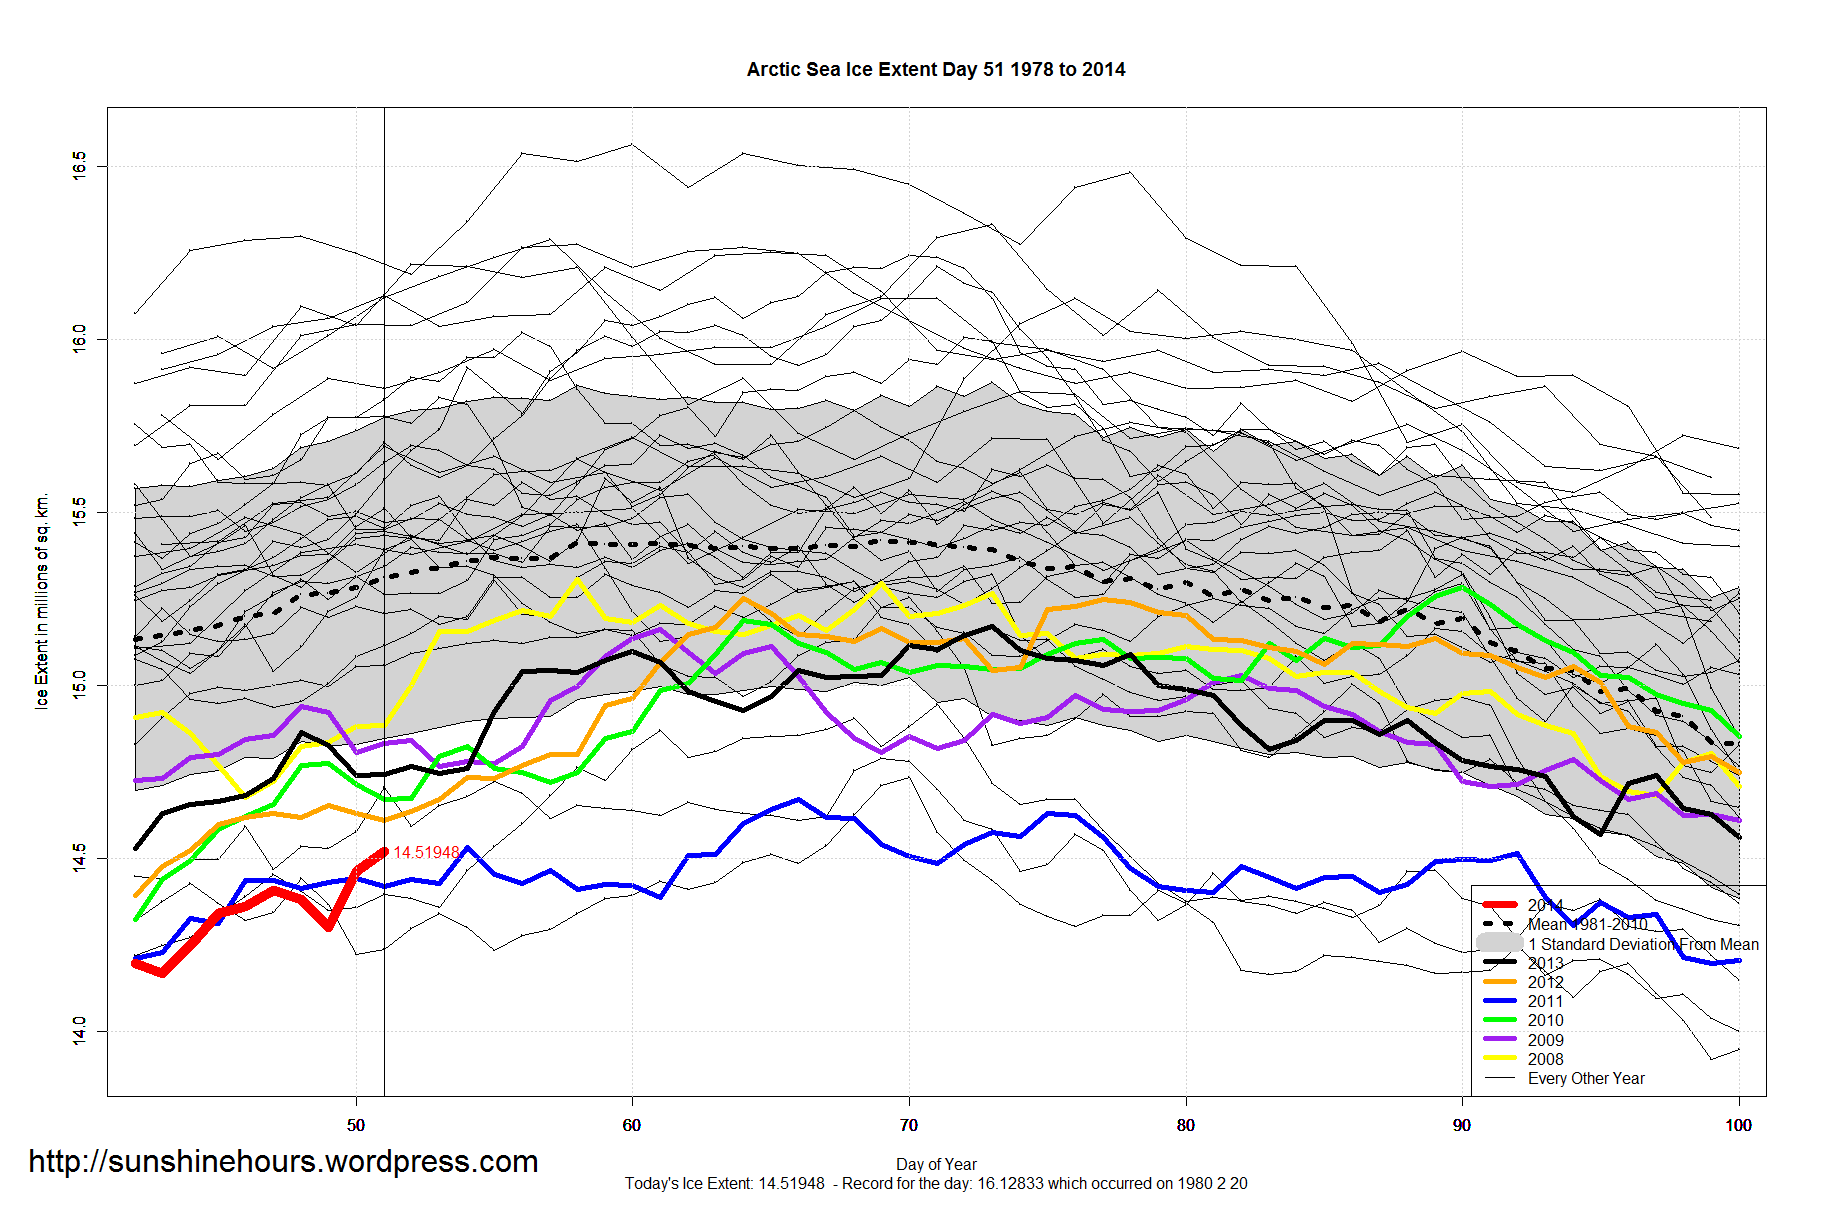
A quick update for sea ice extent:
Data here. Graphs below. Click for bigger.


The AGW Cult loved the word “unprecedented”. They claim the warming that stopped in 1998 was unprecedented.
It turned out that was not true. Another nail in the coffin for “unprecedented” is this paper.
“Pine Island Glacier, a major outlet of the West Antarctic Ice Sheet, has been undergoing rapid thinning and retreat for the past two decades. Here we demonstrate, using glacial-geological and geochronological data, that Pine Island Glacier also experienced rapid thinning during the early Holocene, around 8,000 years ago. Cosmogenic 10Be concentrations in glacially-transported rocks show that this thinning was sustained for decades to centuries at an average rate of more than 100 cm yr−1, comparable to contemporary thinning rates. The most likely mechanism was a reduction in ice shelf buttressing. Our findings reveal that Pine Island Glacier has experienced rapid thinning at least once in the past, and that, once set in motion, rapid ice sheet changes in this region can persist for centuries.”
DMI says it is getting colder in the Arctic. 15C colder. Yes, it is still higher than average. (Green is the mean)
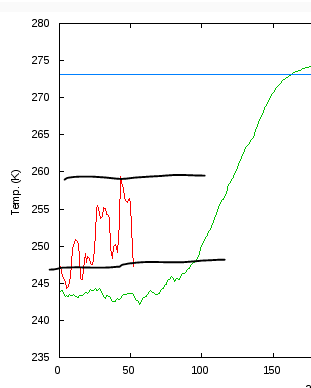
A few days ago the Arctic was lowest for the day. Now it is 4th lowest.
I love a happy story (and a burning wind turbine picture).
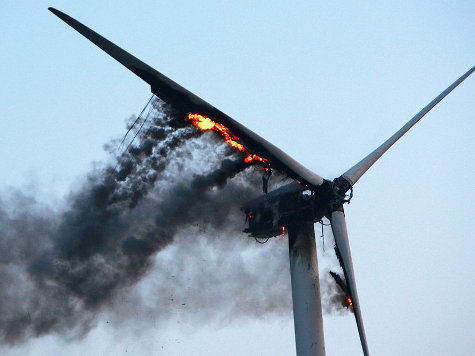
“Plans for a huge expansion of the world’s largest windfarm, the London Array in the Thames Estuary, have been scrapped. The consortium running the project blame the abandonment of an additional 65 giant turbines on “various factors”, but especially the requirement for a 3-year study on the potential impact on birds. The Thames estuary site is a designated environmental Special Protection Area.”
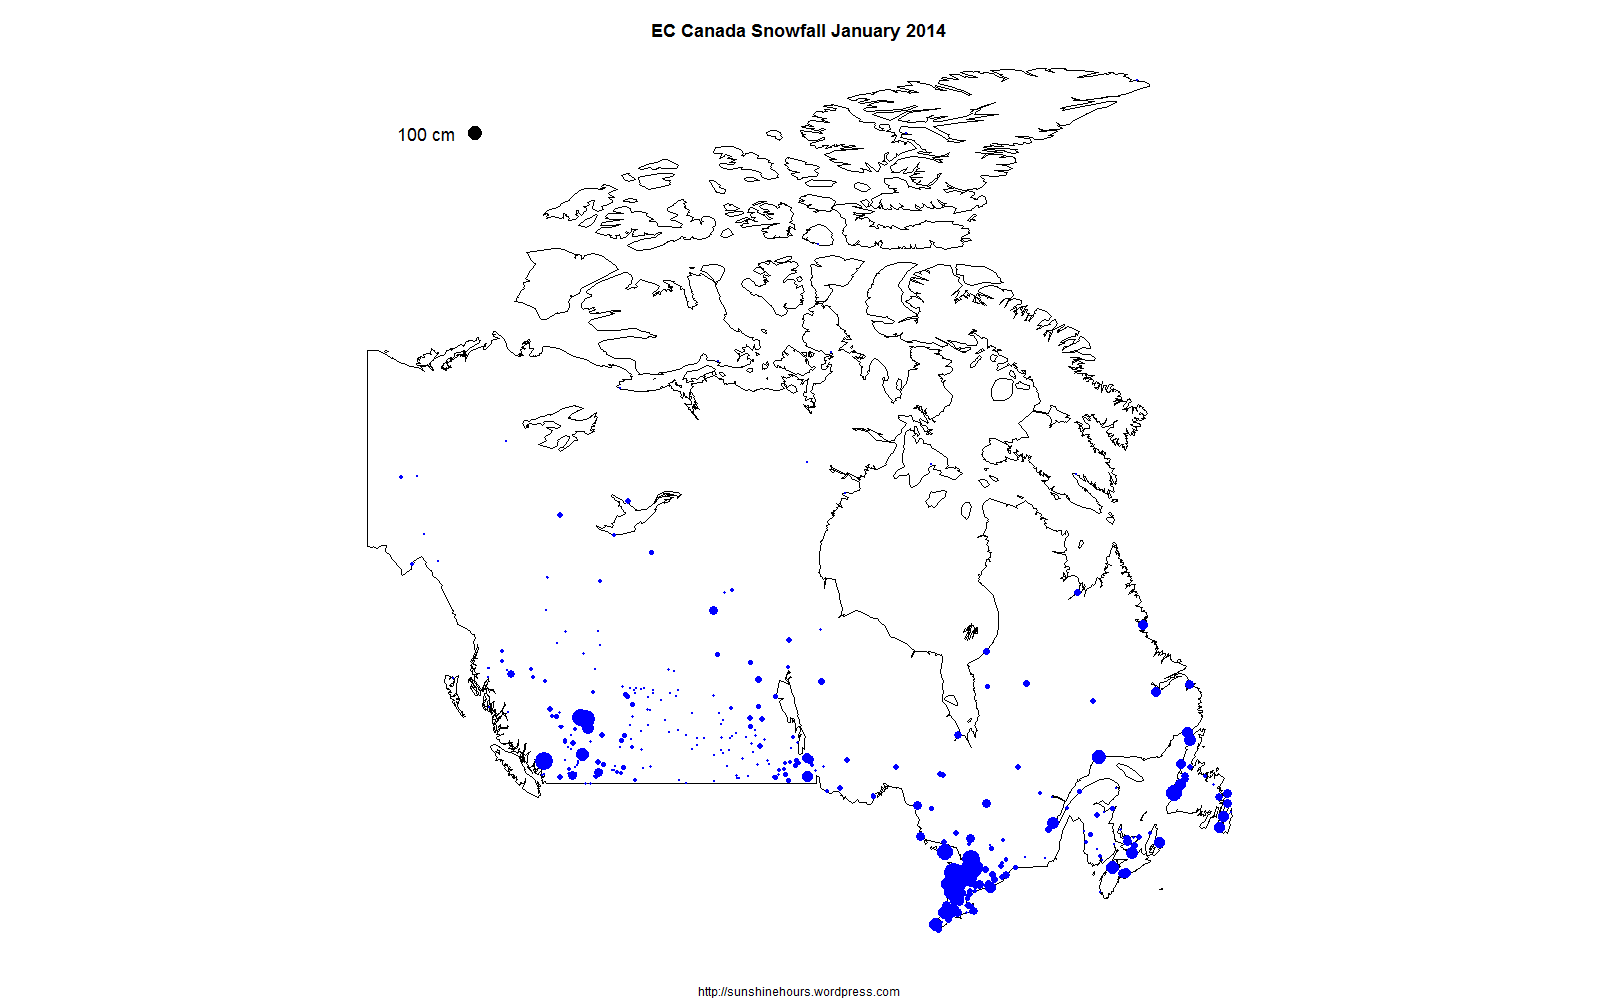
Yesterday I did a post looking at Snowfall in Canada for January 2014. After that I wondered what was the snowiest month in Canadian history?
I chose two semi-arbitrary criteria. Lots of weather stations so after 1940. And the largest average snowfall for all stations combined.
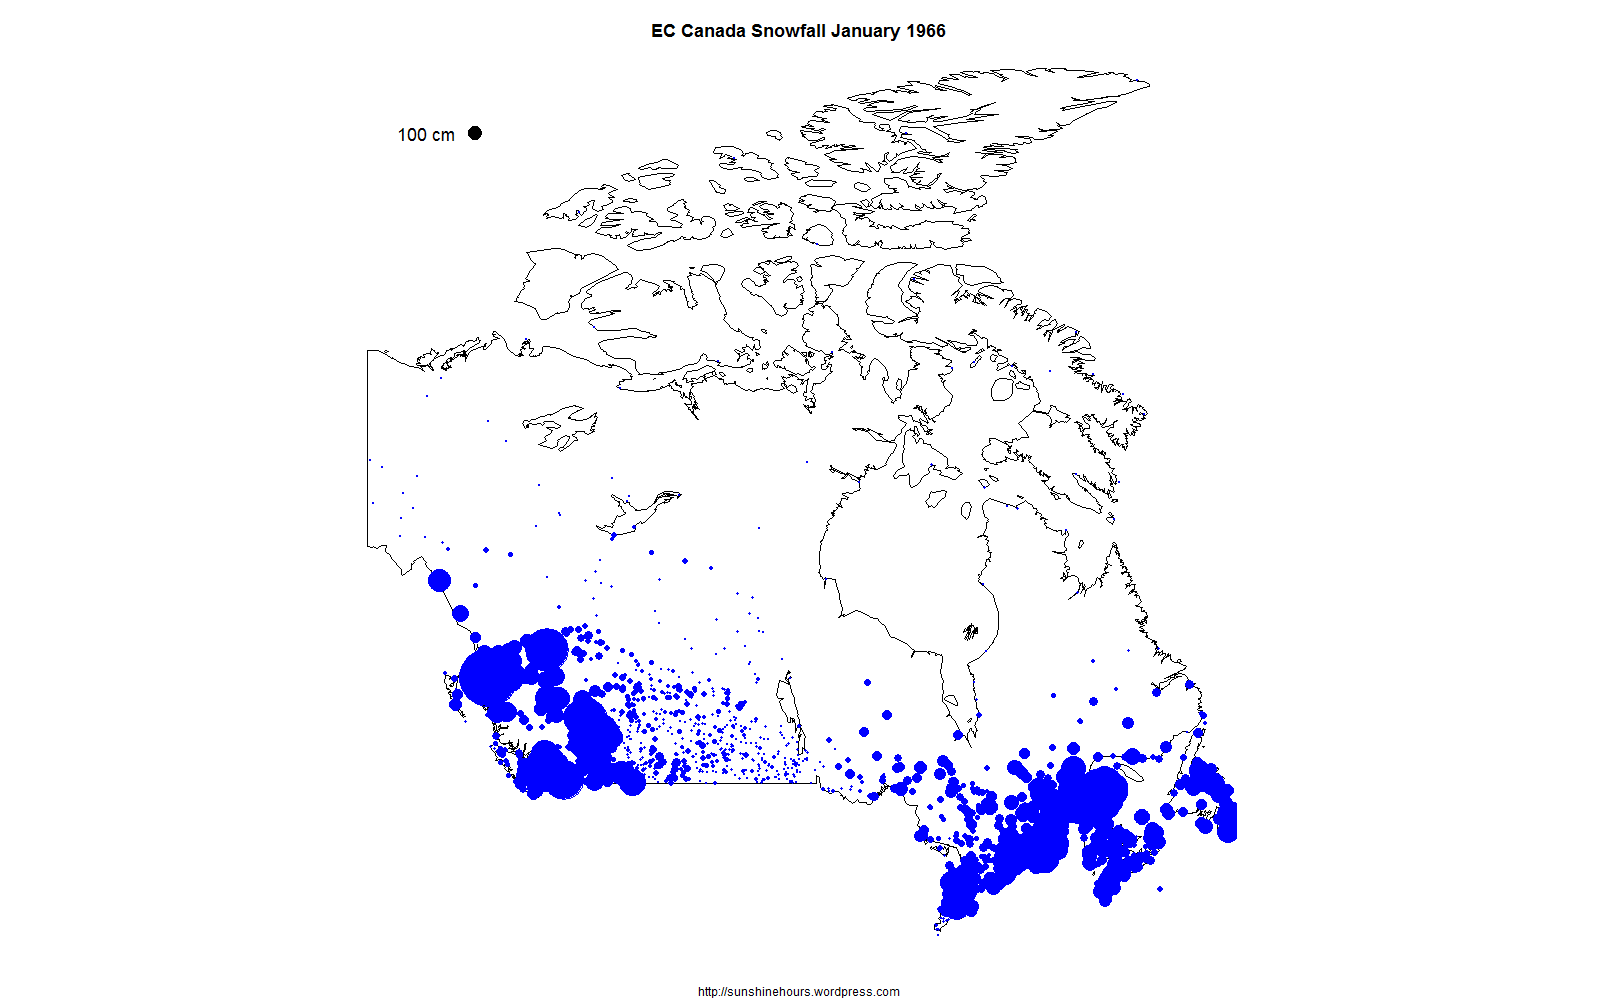
January 1966 was at the top of that list. Map of snowfall in Canada for January 1966 from Environment Canada’s monthly summaries.
The size of the black dot in the top left corner represents 100cm of snow. KITIMAT TOWNSITE got 436.9cm in January 1966. For the non-metric, that is 172 inches.
Click for bigger.
25 Snowiest Location in Canada January 1966 (Not Snow on the ground – Snowfall falling in one month)
| Prov | Stn_Name | Snowfall in cm |
| BC | KITIMAT TOWNSITE | 436.9 |
| BC | GLACIER NP ROGERS PASS | 343.1 |
| BC | PINE PASS | 327.3 |
| BC | MICA DAM | 322.2 |
| BC | REVELSTOKE | 300.4 |
| BC | ALLISON PASS | 294.6 |
| BC | HOLLYBURN RIDGE | 268.5 |
| BC | TAHTSA LAKE WEST | 267 |
| BC | KITIMAT | 261.5 |
| BC | BLUE RIVER NORTH | 259.9 |
| BC | TUNNEL CAMP | 232.1 |
| BC | GARIBALDI | 224.6 |
| BC | FALLS RIVER | 220.8 |
| QUE | MONT-JOLI A | 212.8 |
| BC | MOUNT SEYMOUR | 212.7 |
| BC | ALTA LAKE 2 | 212.3 |
| BC | KEMANO | 210.2 |
| QUE | ST OCTAVE DE L’AVENIR | 208.8 |
| ALTA | WATERTON PARK HQ | 203.6 |
| BC | PEMBERTON MEADOWS | 198.1 |
| NFLD | ST JOHN’S WEST CDA | 193.6 |
| BC | QUESNEL MOOSE HEIGHTS | 193.3 |
| BC | MALAKWA EAGLE R HATCHERY | 193.2 |
| QUE | FORESTVILLE | 192.8 |
| QUE | MURDOCHVILLE | 191.1 |
