Does “Climate Change” Bring More Crime?

Marc Morano posted a link to this LA Times Story.

“Between 2010 and 2099, climate change can be expected to cause an additional 22,000 murders” …. blah blah blah.

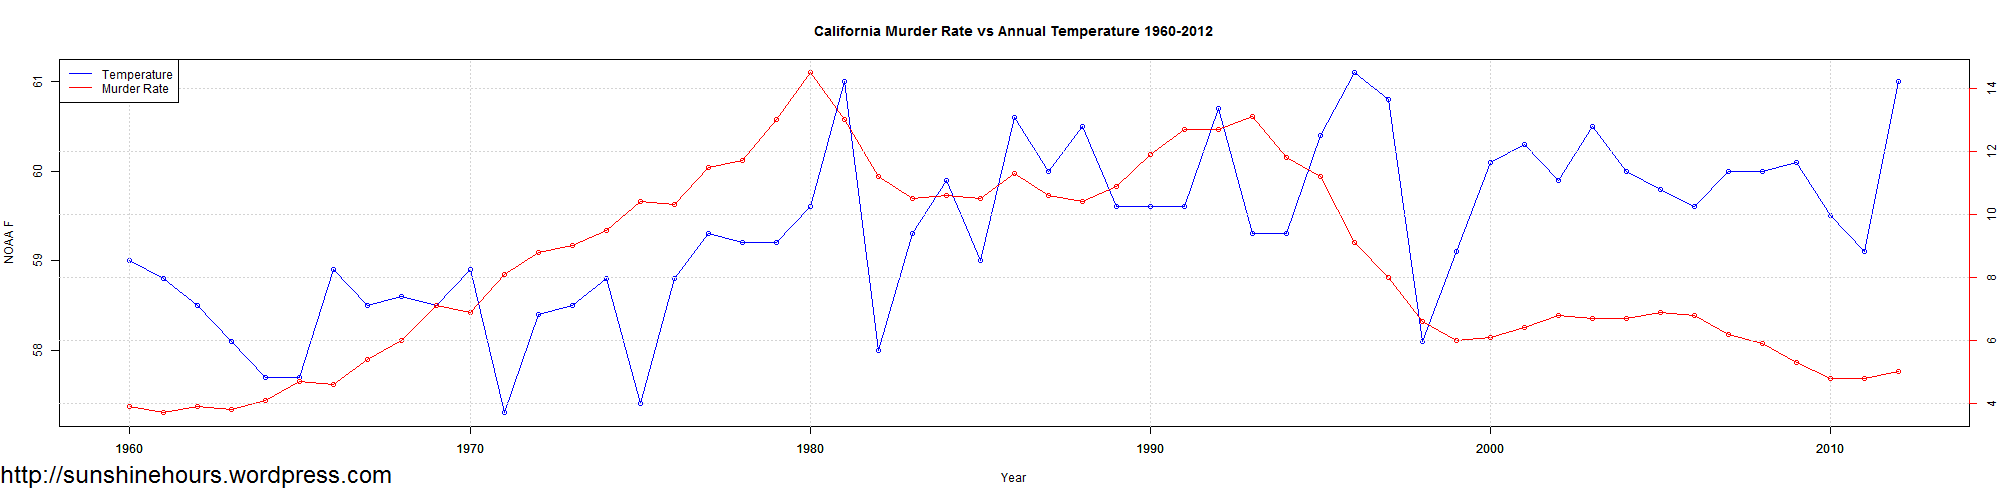
So I grabbed California’s murder rate from 1960-2012 and grabbed California’s annual temperature from the NOAA.

Once upon a time you could maybe argue there was a correlation.  But not anymore.

California Murder Rate vs Annual Temperature 1960-2012

Sea Ice Update February 20 2014 – Antarctic Sea Ice Extent Still 23% above normal

A quick update for sea ice extent:

  • Global Sea Ice is 149,000 sq km below the 1981-2010 mean.  That is 0.8% below the mean.
  • Antarctic Sea Ice is  671,000 sq km above the 1981-2010 mean. That is 23% above the mean.  Antarctic Sea Ice Extent fell 40,000 sq km. and hast not reach minimum yet.
  • Arctic Sea Ice is 820,000 sq km below the 1981-2010 mean.  That is 5.4% below the mean . That is 4th lowest for this day.

Data here. Graphs below. Click for bigger.

Global_Sea_Ice_Extent_2014_Day_50_1981-2010 Global_Sea_Ice_Extent_Zoomed_2014_Day_50_1981-2010 Antarctic_Sea_Ice_Extent_2014_Day_50_1981-2010 Antarctic_Sea_Ice_Extent_Zoomed_2014_Day_50_1981-2010 Arctic_Sea_Ice_Extent_2014_Day_50_1981-2010 Arctic_Sea_Ice_Extent_Zoomed_2014_Day_50_1981-2010

Snowfall in Canada January 2014

Map of snowfall in Canada for January 2014 from Environment Canada’s monthly summaries.

The size of the black dot in the top left corner represents 100cm of snow. Muskoka got 158cm in January. For the non-metric, that is 62 inches.

Click for bigger.

EC MonthlyNormalsSnowfall2014-01

25 Snowiest Location in Canada January 2014

Prov Stn_Name Snow in cm
ONT MUSKOKA A 158
ONT BALACLAVA 147
ONT WIARTON A 139.9
ONT MARKDALE 138.6
BC MICA DAM 136.4
ONT RAVENSCLIFFE 135.6
ONT COLDWATER WARMINSTER 130.4
BC WHISTLER ROUNDHOUSE 130.1
BC BLUE RIVER A 129.4
NFLD STEPHENVILLE A 121.4
ONT JAMESTOWN 121.3
ONT THORNBURY 3 120
ONT SANDFIELD 118
ONT KINCARDINE 105.4
QUE SEPT-ILES UA 105.3
ONT PETROLIA ROKEBY 96.8
ONT WINDSOR A 93.6
BC VERNON SILVER STAR LODGE 93
NS GREENWOOD A 92.9
NS LYONS BROOK 88
QUE MONT STE-ANNE 87.5
NFLD PLUM POINT 87.1
BC GOLDSTREAM RIVER 86.5
ONT SHANTY BAY 86.1
NFLD BRANCH 84

Antarctic Sea Ice Update February 19 2014 – 672,000 sq km Above The Mean – Day 49

Antarctic Sea Ice Extent is 672,000 sq km above the 1981-2010 mean. Which is 23% above the mean.

From day 48 to day 49 extent fell by 22,000 sq km. Extent is still 16,000 sq km higher than day 46.

So day 46 could still turn out to be the day of the minimum Antarctic Sea Ice Extent for 2014. But it could still fall below that.

Data is here. Click for bigger.

Antarctic_Sea_Ice_Extent_Zoomed_2014_Day_49_1981-2010


Between 46 and 64 golden eagles would likely be killed every year by one wind farm

Between 46 and 64 golden eagles would likely be killed every year by one wind farm

hawk-raptor-100153132

“Two conservation groups are urging federal regulators to slow down on approval of what would be the nation’s largest wind farm until more efforts are made to mitigate the impact on eagles.

The groups—the American Bird Conservancy and the Biodiversity Conservation Alliance—told the U.S. Fish and Wildlife Service in a 15-page letter released Wednesday that between 46 and 64 golden eagles would likely be killed every year by the spinning blades of 1,000 wind turbines planned by the Power Company of Wyoming.”

“But a recent Fish and Wildlife Service rule-making exempts wind generators from prosecution for causing eagle deaths for up to 30 years“.


Winter Rainfall UK 1910 to Jan 2014

Because of the floods, they are arguing about the amount of rainfall due to “climate change” over in the UK. Looking at the data from the UK Met for winter rainfall, it appears rainfall goes up and down.

I wonder if the usual AGW alarmist media blamed climate change for the dry period 2009 to 2011? Do I have to ask? Of course they did!

Guardian 17 November 2011: As well as the recent dry weather, water companies and environment regulators are expecting the UK to have more frequent dry winters as a result of climate change.

The graph below is Dec/Jan/Feb anomalies from the 1981-2010 mean. Click for a bigger version.

UK WINTER Rainfall Anomaly From 1981-2010 Mean

Are energy efficient homes making us ILL?

Are energy efficient homes making us ILL?

Yes.

“Energy efficient buildings are an important part of tackling the world’s energy crisis.

But while these structures can keep draughts out, they also have a hidden threat lurking within.

Deep within their crevices and corners, green buildings are susceptible to trapping humid air in which toxic mould can spread.”

Mould

Personally, I’ve been there, done that, got the T-Shirt and nearly died.

The Sad State of Environment Canada’s Sunshine Data

Once up a time (June of 1978 to be precise)  if you downloaded Environment Canada’s monthly summaries, you would have found 313 stations with “Bright Sunshine” hours.

As of January 2014, there is only one. (Ignore the title. Those are hours , not anomalies. I’m just depressed about the loss of data. How do we know whats going on if we don’t collect sunshine data???)

EC MonthlyNormalsSunshine1978-06

EC MonthlyNormalsSunshine2014-01

Antarctic Sea Ice Update February 18 2014 – 697,000 sq km Above The Mean – Day 48

Antarctic Sea Ice Extent is 697,000 sq km above the 1981-2010 mean. Which is 23.9% above the mean. (Lots of people hate me using the term “normal”).

The mean for day 48 is 2.91 million sq km. Sea Ice Extent for day 48 is 3.61 million sq km.

From day 47 to day 48 extent fell by 27,000 sq km. From day 46 to 47 extent actually rose by 64,000 sq km (I mistakenly said 38,000 yesterday).

So day 46 could turn out to be the day of the minimum Antarctic Sea Ice Extent for 2014. But it could still fall below that. No predictions from me.

Data is here. Click for bigger.

Antarctic_Sea_Ice_Extent_Zoomed_2014_Day_48_1981-2010


Whatever The Cause – Blame Global Warming – So Says The NY Times

The NY Times is beclowning itself again in this article on drought in California.

Despite the fact that a cool PDO and warm AMO brings drought to California as shown by this post (referencing an article by Roger Pielke Sr. from 2012).

“What may be different about this drought is that, whatever the cause, the effects appear to have been made worse by climatic warming. And in making that case last week, scientists said, the administration was on solid ground.”


What clowns.