31st Daily Record of Year for Antarctic Sea Ice Extent (8th in a row)

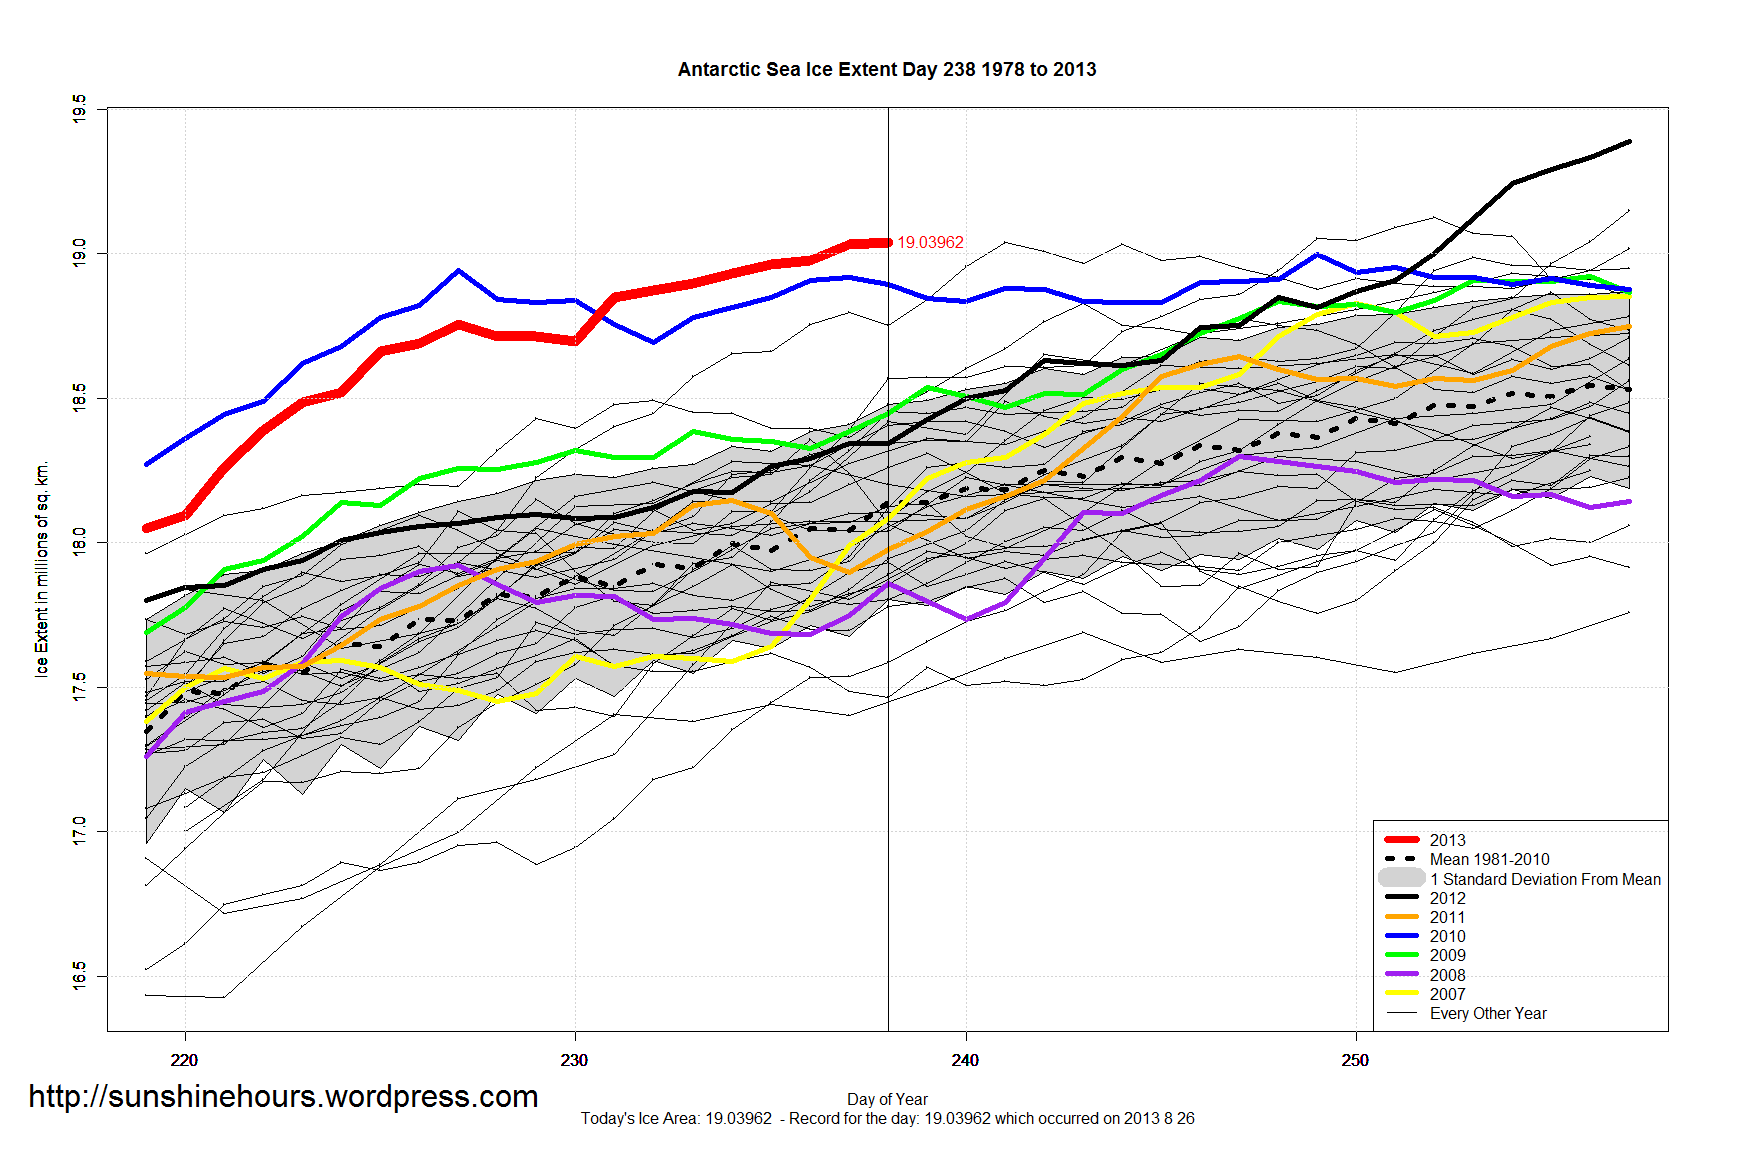
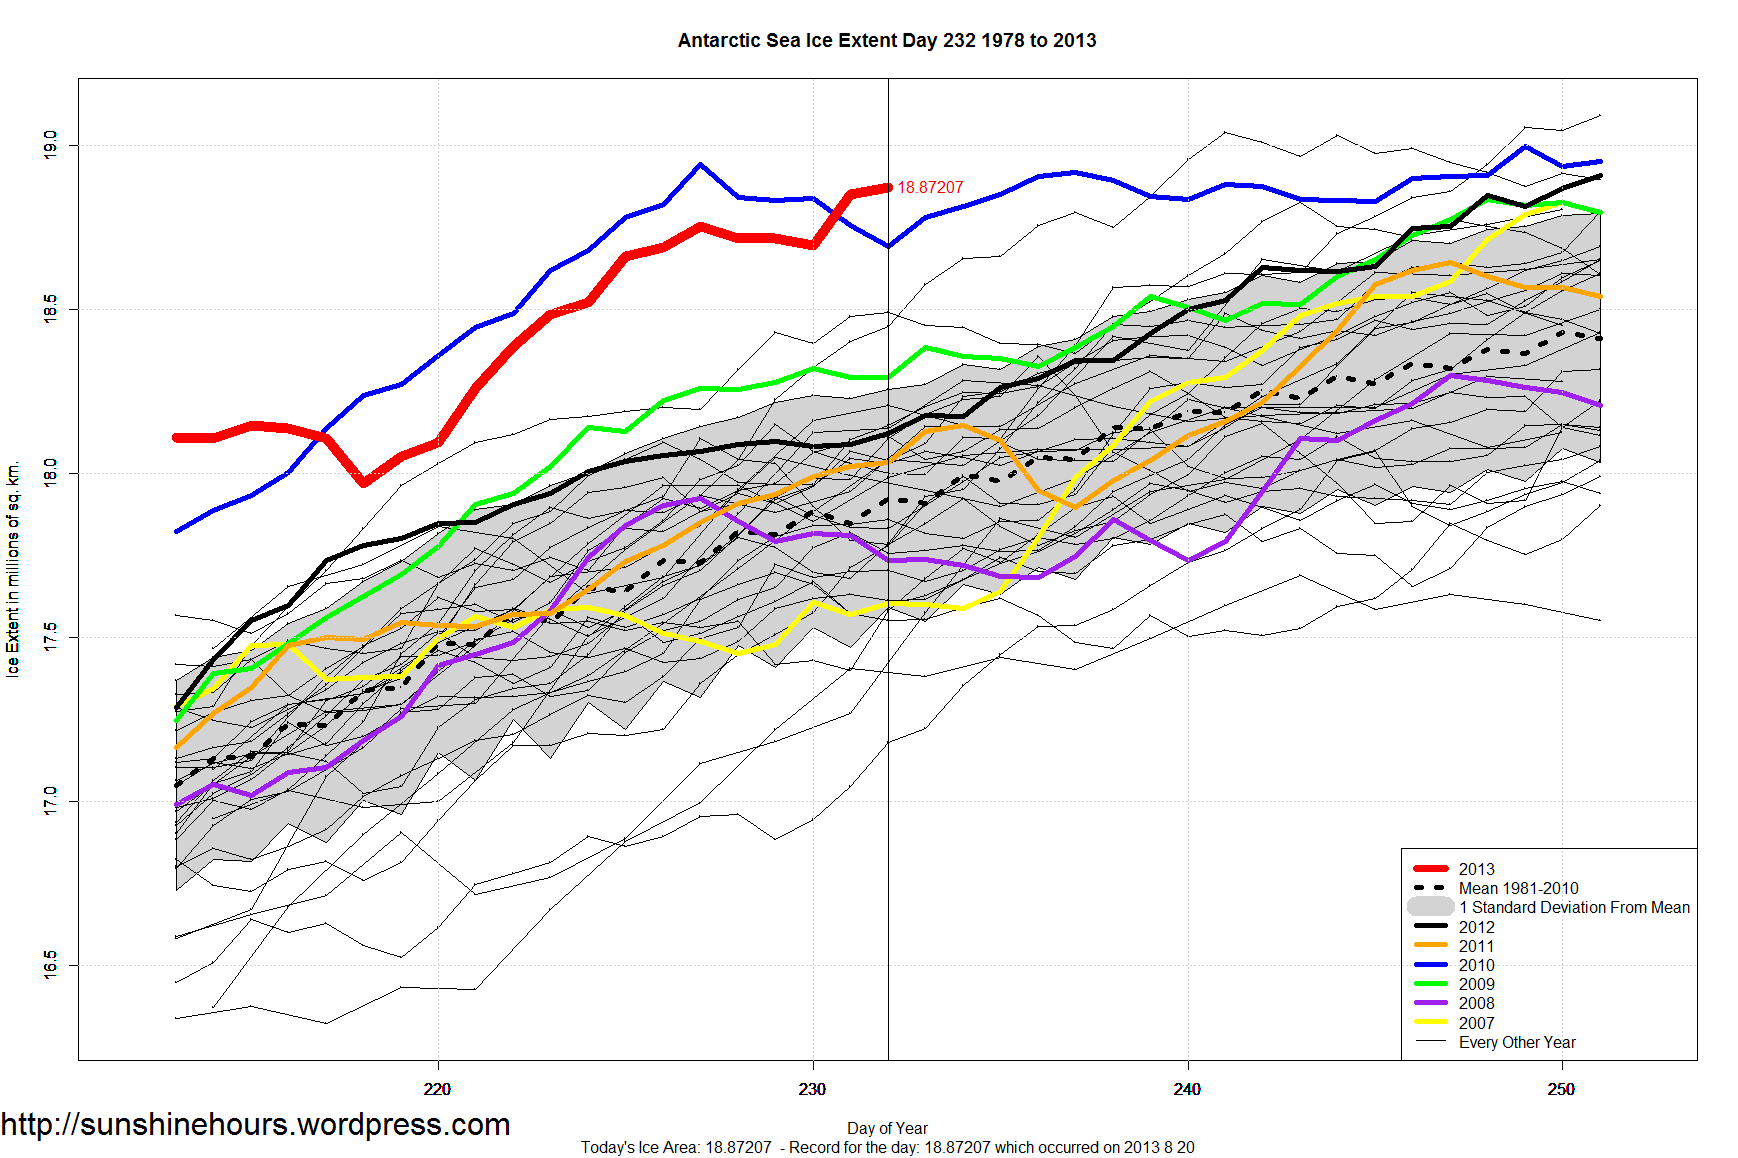
August 26 (Day 238) saw the 31st Daily Record of the Year for Antarctic Sea Ice Extent. This was the 8th record in a row.

Antarctic Sea Ice Extent is 19.03962 million sq km.  That is 1,000,000 sq km higher than the 30 year mean.

With still 2 – 4 weeks left in the Antarctic Freeze Season, 2013 Sea Ice Extent has already surpassed 25 years yearly maximums.

Only the following years have had more ice: 1980, 1998, 2000, 2004, 2005, 2006, 2007, 2009, 2012.

Click graph for bigger. Data is here.

Antarctic_Sea_Ice_Extent_Zoomed_2013_Day_238_1981-2010

Antarctic Sea Ice – Earliest to 19,000,000 sq km

Antarctic Sea Ice Extent (NSIDC) broke 19,000,000 sq km on August 25th (day 237). That was the earliest ever.

The previous earliest to break 19 million was August 29 2006 (day 241).

Yesterday was also the 30th daily record of the year.  And 7th in a row.

The record for most ice ever is day 266 in 2012 when the ice extent was 19.47713 million sq km.

Antarctic_Sea_Ice_Extent_Zoomed_2013_Day_237_1981-2010

29th Daily Record of Year for Antarctic Sea Ice Extent (6th in a row)

August 24 (Day 236) saw the 29th Daily Record of the Year for Antarctic Sea Ice Extent. This was the 6th record in a row.

Antarctic Sea Ice Extent is 18.97784 million sq km. The earliest the Antarctic reached 19 million sql km was in 2006 when it happened on day 241.

The most days over 19 million sq km was in 2006 and 2012 when there were 30 days each.

Click graph for bigger. Data is here.

Antarctic_Sea_Ice_Extent_Zoomed_2013_Day_236_1981-2010

28th Daily Record of Year for Antarctic Sea Ice Extent (5th in a row)

August 23 (Day 235) saw the 28th Daily Record of the Year for Antarctic Sea Ice Extent. This was the 5th record in a row.

2013 now holds 3rd place for the Number of Daily Records in a year. (It was tied yesterday)

Year No of Records
2008 125
2010 111
2013 28
2006 27
2012 27
2007 21
2009 8
2004 5
1998 4
2000 4
2005 3
1979 2
1980 1

Click graph for bigger. Data is here.

Antarctic_Sea_Ice_Extent_Zoomed_2013_Day_235_1981-2010

27th Daily Record of Year for Antarctic Sea Ice Extent (4th in a row)

August 22 (Day 234) saw the 27th Daily Record of the Year for Antarctic Sea Ice Extent. This was the 4th record in a row.

It also ties 2013 with 2006 and 2012 for the Number of Daily Records in a year.

Year No of Records
2008 125
2010 112
2013 27
2006 27
2012 27
2007 21
2009 8
2004 5
1998 4
2000 4
2005 3
1979 2
1980 1

Click graph for bigger. Data is here.

Antarctic_Sea_Ice_Extent_Zoomed_2013_Day_234_1981-2010


Undertakers Business Dead Due To Warm Winter

Tim Blair: “Global warming is killing the death industry

“Sydney’s unseasonably mild winter, the warmest on record, might be a joy for most of us but it’s making life tough for funeral directors, who are experiencing their slowest season in 25 years.

‘’We’ve seen the biggest drop in business in a generation,’’ said Andrew Smith, chief executive of InvoCare, the largest private funeral, cemetery and crematorium operator in the Asia-Pacific region. ‘’Winter is usually our busiest time, but there’s been no real flu season this year and no real cold snaps, and that’s being reflected in a big drop in business.’’

We’ve had a 10 to 15 per cent drop in the death rate. Talking to other people in the industry, suppliers and coffin makers, they are all saying they have been affected.”

Read it all here.

NASA Misleads About “Warming Hole” in SouthEast

NASA is telling lies about the southeast USA. They claim that sulphates were causing the Southeast to stay cooler and masking AGW. For some reason they use the term “warming hole”.

Read about it here.

How do they explain that it was warmer in the southeast in the 20s and 30s than now?

Here is the big lie that jumped out at me.

“As a response to the declining sulfate levels, Leibensperger’s modeling shows temperatures over the central and eastern United States have increased by 0.3°Celsius between 1980 and 2010.”

The trend from 1980 to 2010 (using NASA’s own data) is indeed .2C per decade.

But the trend from 1990 to 2010 is in fact negative.  It is -.2C per decade.

And the trend from 1895 to 2010 is FLAT!

All 3 graphs below:

southeast_1895-2010

southeast_1980-2010

southeast_1990-2010