Most of the reservoir’s in California are well above the historical average percent.
But, if the Pineapple Express dumps a lot of rain it could be flood time.

Most of the reservoir’s in California are well above the historical average percent.
But, if the Pineapple Express dumps a lot of rain it could be flood time.
It was the second coldest February in Nanaimo , BC , Canada (data from 1948) in terms of average temperature. The average was 0.05C .
The coldest was 1989 when it averaged-0.03C.

2019

1989
The warmest February was 2015 and it looked like:

Data courtesy weatherstats.ca and Environment and Climate Change Canada


From DMI
Just an addendum to the post I made about Ferries and Killer Whales. The key paragraph is here.
The study stated “that ferries undoubtedly contribute a large amount of noise due to their size, the large number of monthly ferry trips, and because their routes are widely distributed throughout” the pod’s habitat. To make matters worse, B.C.’s provincial government plans to increase the number of ferry trips in B.C. coastal waters by an enormous 2,700 trips per year — or 225 more trips per month.
TMX will result in 1 extra tanker sailing per day.
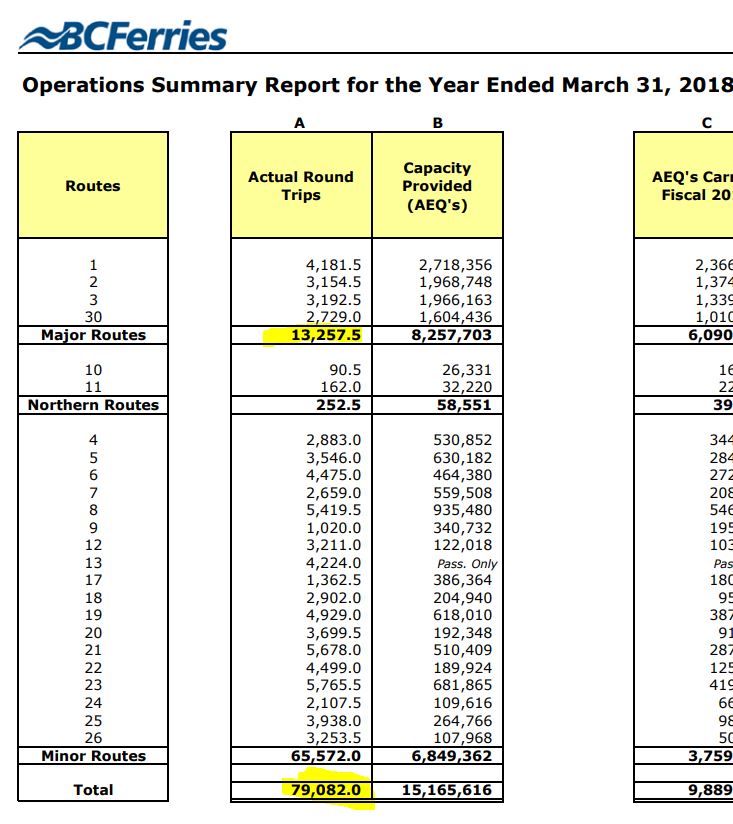
BC Ferries make over 26,000 sailings a year (13,000 round trips) on the 4 major routes (which go right through the feeding grounds)
Thats works out to 71 daily trips.
And there are a grand total of 79,000 round trips (156,000 sailings) on all routes.


From DMI
So far in February 884 minimum daily temperature records have been broken (Seems low to me)

But the difference! 2 x -18 , 4 x -17 , 3 x -16 … and so on
Here is a sample

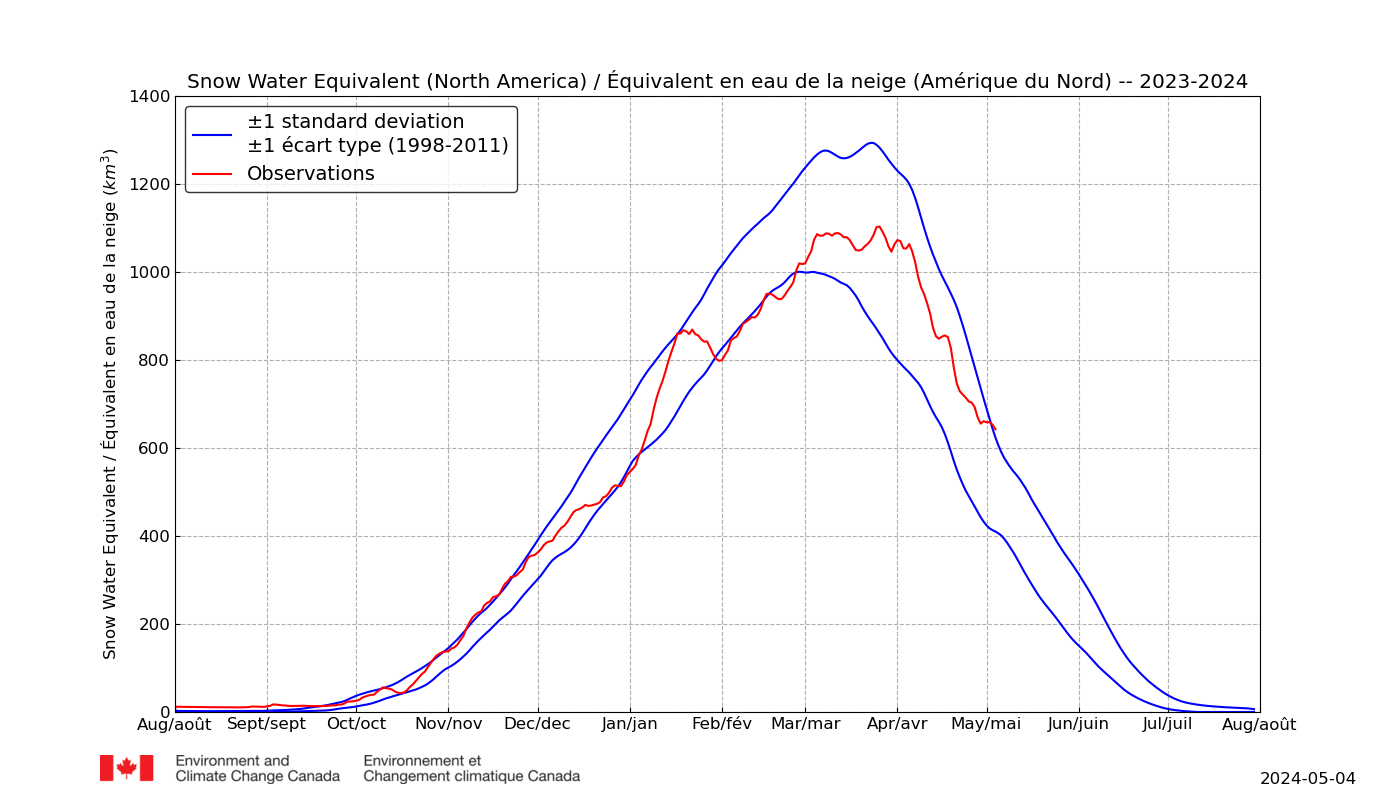
I usually post Northern Hemisphere. But here is North America Snow Water Equivalent.
March 2000: According to Dr David Viner, a senior research scientist at the climatic research unit (CRU) of the University of East Anglia,within a few years winter snowfall will become “a very rare and exciting event”.
“Children just aren’t going to know what snow is,” he said.
Snow seems to be ignoring David Viner.


