1.5C of Warming in 27 years – Mar 1917 to Jan 1944 – Northern Hemisphere

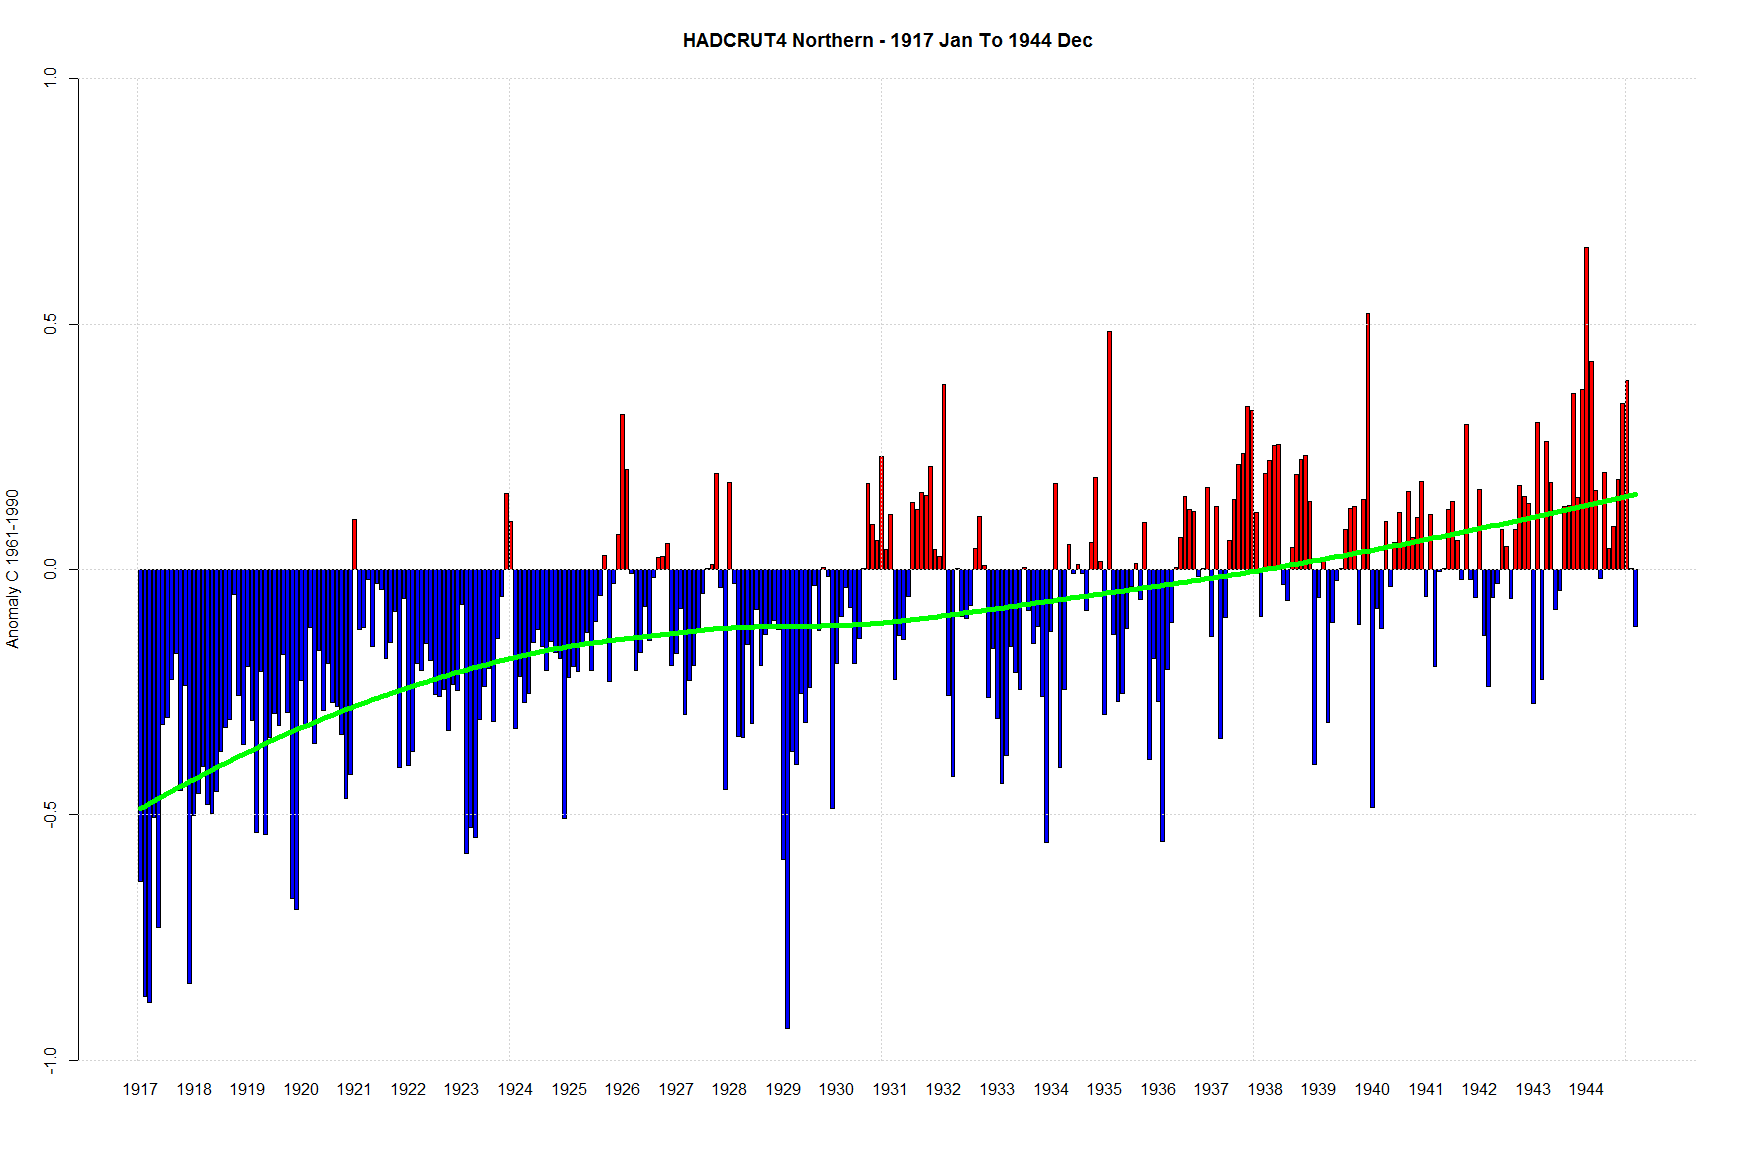
1.5C of Warming in 27 years – Mar 1917 to Jan 1944 – Northern Hemisphere (data here)

Jan 1944 Northern Hemisphere Anomaly = 0.656

Jan 2013 Northern Hemisphere Anomaly = 0.545

It was .111C warmer in Jan 1944 than Jan 2013 in the Northern Hemisphere.

Why does the AGW cult ignore this?

HADCRUT4 Northern - 1917 Jan To 1944 Dec


Canada May 2013 – Daily Mean Temperature Anomaly Map

Update: See bottom map for fun.

Using the stations in Canada with Environment Canada calculated anomalies, here is the month of May visualized using the mean temperature for each station for each day.

You might have to click on the image or refresh the page to restart it.

The black circle in the top left corner represents a 5 Celsius anomaly from the 1971-2000 average.

Blue are below normal. Red above.

DailyNormals_2013-05

I thought I would map just the stations that were exactly average just for fun:

DailyNormals0_2013-05