If you take Environment Canada’s monthly summaries from 1998 to April 2015.
Use only the station with pre-calculated Normals (anomalies from 1981-2010 avg).
Average them on a 1×1 grid and then graph the data:

If you take Environment Canada’s monthly summaries from 1998 to April 2015.
Use only the station with pre-calculated Normals (anomalies from 1981-2010 avg).
Average them on a 1×1 grid and then graph the data:
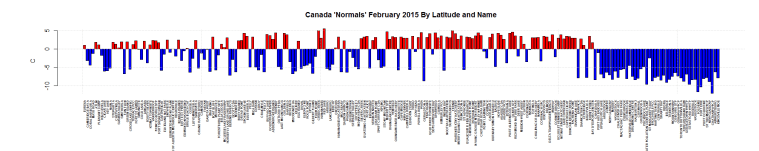
These are just the stations deemed ‘Normals” by Environment Canada. The temperature is the departure from the 1971-2000 average in Celsius. I’m using monthly summary.
This graphs data is sorted by Longitude (West to East) and By Name. Click for bigger.

This graphs data is sorted by Latitude (North to South) and By Name. Click for bigger.
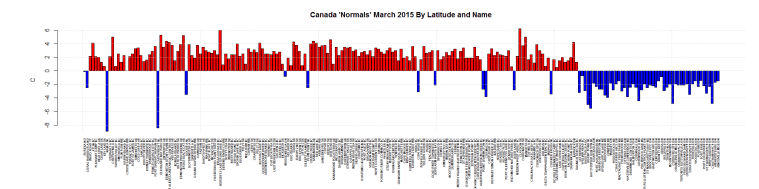
Using November Tmin data from Environment Canada’s monthly summaries.
I used the following filter. There had to be 25 years of data. And there had to be data in 2014.
420 stations fit that criteria.
For 122 of those stations, November 2014 was in the top 5 coldest.
So, for example. 108 MILE HOUSE ABEL LAKE has 27 rows of data, and 2014 is ranked as the 4th coldest.
| Prov | Stn | Rows | Last Year | Nov 2014 Monthly Tmin | Nov 2014 Monthly Rank | Coldest 10 Novembers (In order) |
| BC | 108 MILE HOUSE ABEL LAKE | 27 | 2014 | -28.5 | 4 | 1996,2006,1993,2014,2001,1995,1994,2005,2010,2003 |
| BC | ADDENBROKE ISLAND | 35 | 2014 | -7 | 3 | 1985,2006,2014,1993,2010,2003,2011,1982,1990,2001 |
| MB | ARBORG | 55 | 2014 | -31.5 | 5 | 1978,1985,1989,1995,2014,1964,1971,1976,1991,1997 |
| BC | ASHCROFT | 25 | 2014 | -21.1 | 1 | 1959,2014,1978,1977,2010,2011,1963,1958,2013,1979 |
| MB | BALDUR | 52 | 2014 | -27.5 | 4 | 1985,1964,1978,2007,2013,2014,1977,1976,1986,2012 |
| MB | BERENS RIVER CS | 30 | 2014 | -36 | 2 | 1985,2014,1986,1993,1995,1997,1989,1991,1996,2012 |
| ON | BIG TROUT LAKE | 57 | 2014 | -32 | 5 | 1989,1949,1968,1976,2012,2014,1958,1978,2012,1957 |
| BC | BILLINGS | 30 | 2014 | -17 | 5 | 1985,2006,2010,1993,2014,1996,2007,1991,1986,2003 |
| BC | BLUE RIVER A | 45 | 2014 | -30.6 | 3 | 1985,2006,2014,1975,1993,2010,1984,1978,1996,1970 |
| BC | BOAT BLUFF | 37 | 2014 | -5.5 | 5 | 1985,2006,1996,2010,2014,1993,2001,1978,1982,1990 |
| AB | BRETON | 29 | 2014 | -34 | 1 | 2014,1996,2006,2010,2013,2003,1993,1990,2011,1975 |
| AB | BROOKS | 37 | 2014 | -30.3 | 3 | 1975,1978,2014,1996,2003,2010,1973,1990,2006,1977 |
| AB | BRULE BLACK CAT | 28 | 2014 | -39.5 | 1 | 2014,1996,2010,2006,1990,1993,1995,2001,2003,1991 |
| BC | BURNS LAKE DECKER LAKE | 35 | 2014 | -31.4 | 3 | 1955,2006,2014,1970,1963,2010,1964,2011,1965,1966 |
| BC | CAPE ST JAMES | 48 | 2014 | -3.4 | 4 | 1985,1946,1955,2014,1963,1959,1970,1973,1950,1945 |
| AB | CARDSTON | 99 | 2014 | -32 | 5 | 1955,1996,1946,1985,1996,2014,1950,1959,1963,1993 |
| MB | CARMAN | 25 | 2014 | -28 | 1 | 2014,1996,2005,1995,2007,2013,2010,1991,1990,2003 |
| ON | CHAPLEAU A | 37 | 2014 | -31.5 | 1 | 2014,1989,1983,2007,1995,1978,1992,1993,1986,2000 |
| NL | CHURCHILL FALLS A | 27 | 2014 | -29.9 | 3 | 1986,1972,2014,1978,1989,1992,1977,1980,1991,2013 |
| QC | CHUTE-DES-PASSES | 37 | 2014 | -23.8 | 5 | 1964,1968,1997,2002,2014,1971,2005,1962,1975,2013 |
| SK | CIGAR LAKE | 28 | 2014 | -36 | 3 | 1988,1990,2014,2004,1995,2007,2012,1994,2001,2006 |
| AB | CLARESHOLM | 29 | 2014 | -35.3 | 2 | 2010,2014,1996,2006,2003,1955,2012,2007,1993,1995 |
| SK | CLAYDON | 44 | 2014 | -28 | 2 | 1985,1996,2014,2010,1982,1973,1975,1976,1986,2006 |
| SK | COLLINS BAY | 39 | 2014 | -35.8 | 2 | 1988,2014,1975,1978,1976,2004,1985,1982,1972,1977 |
| SK | CORONACH | 48 | 2014 | -30.5 | 4 | 1996,1985,1946,2006,2014,1993,2010,1977,1978,1945 |
| SK | CORONACH SPC | 33 | 2014 | -28.6 | 3 | 1996,1985,2010,2014,1991,1993,2003,2006,2000,1990 |
| MB | COWAN | 29 | 2014 | -33 | 2 | 1985,2010,2014,1991,1989,1984,2006,1996,1995,2000 |
| BC | CRISS CREEK | 25 | 2014 | -31.5 | 2 | 2006,2014,1993,2010,1996,2013,2011,1990,1994,2003 |
| MB | DAUPHIN | 41 | 2014 | -31.5 | 2 | 1919,2014,1905,1921,1907,2013,1935,1940,1914,1926 |
| BC | DAWSON CREEK A | 47 | 2014 | -37.1 | 5 | 1985,2006,1990,1970,2014,1993,1982,2013,1973,2001 |
| BC | DELTA TSAWWASSEN BEACH | 27 | 2014 | -7.5 | 2 | 2006,2014,1993,2010,1996,2011,1994,2003,2013,1992 |
| BC | DRYAD POINT | 37 | 2014 | -6 | 5 | 1985,2006,1996,2010,2011,2014,1993,1982,1990,1978 |
| BC | DUNCAN KELVIN CREEK | 27 | 2014 | -6 | 5 | 2010,1993,2006,1996,2003,2014,1994,1995,2002,2000 |
| SK | DUVAL | 52 | 2014 | -28 | 5 | 1985,1978,1996,2013,2014,1966,1970,1977,1965,1991 |
| AB | EDMONTON STONY PLAIN | 49 | 2014 | -31 | 3 | 1985,1970,2014,2010,1996,2006,2003,1990,1973,1984 |
| AB | EDSON | 58 | 2014 | -36 | 4 | 1963,1919,1950,2014,1955,1940,1946,2013,2010,1921 |
| AB | EGG ISLAND | 61 | 2014 | -25.6 | 2 | 2012,2014,2013,2001,2002,2003,2004,1985,2006,2007 |
| MB | ELKHORN 2 EAST | 26 | 2014 | -27 | 5 | 2013,1996,2006,2007,2014,1995,1990,1991,2010,1989 |
| BC | ENTRANCE ISLAND | 28 | 2014 | -2 | 3 | 2006,2010,2014,1996,2014,1916,2003,2005,2007,2011 |
| AB | ENTWISTLE | 28 | 2014 | -33 | 2 | 2010,2006,2014,1996,2003,1990,2013,1993,1991,2012 |
| BC | EQUITY SILVER | 32 | 2014 | -29.5 | 3 | 1985,1982,1996,2014,2010,2001,2013,1984,2003,1986 |
| SK | ESTEVAN | 26 | 2014 | -27.7 | 5 | 1919,1905,1900,1914,2014,1903,2013,1910,1911,1924 |
| SK | ESTEVAN A | 71 | 2014 | -28.5 | 4 | 1996,1985,1964,1990,2014,1978,1946,1955,2006,2010 |
| AB | FABYAN | 34 | 2014 | -31.5 | 4 | 1985,1996,2010,2014,1990,1986,2006,1982,1993,2013 |
| BC | FERNIE | 96 | 2014 | -29 | 5 | 1959,1985,1982,1993,2014,1946,1970,2006,1940,2003 |
| ON | FOLDENS | 52 | 2014 | -13 | 5 | 1987,2013,1986,2000,2014,1976,1996,2005,1964,1967 |
| AB | FORT VERMILION | 26 | 2014 | -34.9 | 3 | 2006,2012,2014,2013,1915,1963,2011,1908,2007,1914 |
| ON | GERALDTON A | 34 | 2014 | -32.1 | 4 | 1985,1989,1995,2014,2007,1986,1997,1992,2013,2005 |
| MB | GILBERT PLAINS | 55 | 2014 | -34 | 3 | 1958,1985,2014,1964,1991,1996,1978,2010,1995,1971 |
| BC | GOLDSTREAM RIVER | 31 | 2014 | -22 | 3 | 1985,2006,1993,2014,1982,1984,2007,1995,1996,2013 |
| MB | GRAND RAPIDS HYDRO | 46 | 2014 | -30 | 3 | 2004,1985,2014,1978,1989,1966,1970,2010,1993,1971 |
| AB | GRANDE PRAIRIE A | 73 | 2014 | -38 | 4 | 1963,1985,1955,2014,1970,2006,1950,1990,1961,1965 |
| MB | GRETNA (AUT) | 34 | 2014 | -27.2 | 4 | 1958,1996,1964,2014,1955,2013,2007,1995,1993,2006 |
| ON | HAMILTON A | 55 | 2014 | -13.2 | 2 | 2000,2014,1987,1959,2013,1986,1976,1996,1967,2005 |
| BC | HOPE A | 60 | 2014 | -10.1 | 4 | 1985,1955,1959,2014,1993,1945,1946,1970,1940,1977 |
| BC | HORSEFLY LAKE GRUHS LAKE | 37 | 2014 | -30.5 | 3 | 1955,2006,2014,2010,1996,1959,2001,2013,1993,1994 |
| BC | IVORY ISLAND | 30 | 2014 | -6 | 3 | 2006,1996,2010,2014,1993,2011,1950,1990,2001,2005 |
| BC | KAMLOOPS PRATT ROAD | 26 | 2014 | -24 | 2 | 2006,2014,1996,2010,1993,1990,2013,2003,2011,1995 |
| ON | KAPUSKASING A | 78 | 2014 | -31.1 | 4 | 1938,1957,1975,2014,1940,1995,1976,2012,1964,1978 |
| BC | KELOWNA | 68 | 2014 | -19.4 | 4 | 1900,2010,1955,2014,1959,1911,2011,1921,1927,1903 |
| SK | KINDERSLEY A | 32 | 2014 | -28.5 | 5 | 1996,1985,2010,1991,2014,2011,1993,2006,2013,1984 |
| ON | KINGSVILLE MOE | 47 | 2014 | -11 | 3 | 1996,1976,1986,2014,1979,1991,2005,2013,1969,1977 |
| SK | LEROY | 35 | 2014 | -29 | 4 | 1985,1996,1990,1995,2007,2010,2014,1982,2003,2013 |
| BC | LILLOOET | 44 | 2014 | -19.2 | 2 | 1883,2014,1921,1940,2010,1927,1931,1881,1919,1924 |
| AB | LLOYDMINSTER A | 33 | 2014 | -28.3 | 5 | 1985,1996,2010,1990,2014,2003,2013,1995,2006,1986 |
| MB | MAFEKING | 25 | 2014 | -31 | 1 | 2014,1989,1991,1993,2007,1990,1996,2006,2010,2011 |
| SK | MANKOTA | 46 | 2014 | -32.5 | 3 | 1985,1996,2014,1978,2003,1975,1976,1984,1964,1977 |
| MB | MARQUETTE | 46 | 2014 | -27 | 5 | 1985,1978,1976,1977,1995,2014,1986,2007,1989,1996 |
| ON | MASSEY | 32 | 2014 | -24.5 | 2 | 1989,2014,1995,2000,1986,2005,2007,2013,1983,1991 |
| SK | MCKAGUE 2 | 30 | 2014 | -32.5 | 3 | 1985,1991,2014,1996,2007,1990,2010,1986,1993,1995 |
| BC | MCLEESE LAKE GRANITE MT | 39 | 2014 | -29 | 3 | 2006,1978,2014,1996,2010,2013,1993,1984,1995,1977 |
| SK | MEADOW LAKE | 28 | 2014 | -34.6 | 3 | 2013,1970,2014,2006,2003,1996,2007,2010,1975,1972 |
| SK | MEADOW LAKE A | 32 | 2014 | -34.4 | 5 | 1985,1982,1990,1978,2014,1986,2003,2006,1994,2007 |
| BC | MERRITT | 43 | 2014 | -24.7 | 1 | 2014,1924,1945,1921,1946,1931,1950,1919,1935,2011 |
| BC | MICA DAM | 52 | 2014 | -18.5 | 4 | 1985,2006,1970,2014,1963,1984,2010,1975,1993,1978 |
| AB | MILK RIVER | 40 | 2014 | -29.3 | 2 | 1996,2014,2006,2010,2003,1970,2007,2012,1964,1963 |
| BC | MISSION WEST ABBEY | 53 | 2014 | -9 | 4 | 1985,2006,2010,1993,2014,1978,1996,1970,1977,1963 |
| BC | MYRA CREEK | 32 | 2014 | -6 | 5 | 2010,2006,1982,1993,1996,2014,2003,1979,1981,1983 |
| BC | NEW DENVER | 45 | 2014 | -14 | 5 | 1985,2006,2010,1993,1977,2014,1970,1978,1975,1984 |
| BC | NORTH PENDER ISLAND | 32 | 2014 | -5 | 5 | 1985,2006,1993,2010,1982,2014,1996,1975,2011,1984 |
| BC | OKANAGAN CENTRE | 85 | 2014 | -14.5 | 5 | 1985,1955,1959,1996,2014,1946,1940,1970,1993,1977 |
| BC | OSOYOOS CS | 25 | 2014 | -13 | 4 | 2010,2006,1993,2014,1996,2003,2002,1995,1994,2013 |
| BC | PEACHLAND | 41 | 2014 | -16.5 | 3 | 1985,2006,2010,2014,1978,1993,1996,1977,2003,1975 |
| SK | PELLY | 60 | 2014 | -34 | 4 | 1958,1985,1970,1978,2014,1959,1991,1955,1951,1982 |
| AB | PICTURE BUTTE WEST | 26 | 2014 | -29.5 | 3 | 1996,2006,2014,2010,2012,2003,1991,1993,1990,2001 |
| MB | PINAWA | 58 | 2014 | -30 | 3 | 1929,1926,1919,2014,1940,1921,1930,1933,1996,1927 |
| ON | PORT COLBORNE | 50 | 2014 | -10 | 5 | 1987,1976,2000,2013,1986,2005,2008,2014,1989,1967 |
| BC | PRINCE GEORGE | 38 | 2014 | -32.3 | 3 | 1927,1940,2014,1919,2010,1935,1921,1931,2011,1924 |
| BC | PRINCE GEORGE STP | 39 | 2014 | -28 | 4 | 1985,2006,1996,2014,1978,2010,1982,1977,1986,1984 |
| BC | PRINCE RUPERT | 60 | 2014 | -8.7 | 4 | 1955,1911,1921,2014,1909,1910,1946,1950,2010,1959 |
| BC | PRINCETON A | 79 | 2014 | -27 | 5 | 1985,2006,1975,1955,2014,2010,1958,1959,1970,1982 |
| AB | QUEENSTOWN | 53 | 2014 | -29 | 4 | 1985,2010,2010,2006,2014,1993,1977,1996,1975,1978 |
| BC | QUESNEL | 83 | 2014 | -31.3 | 4 | 1896,1893,1955,2014,1897,1946,1959,1892,1911,1940 |
| BC | RED LAKE | 30 | 2014 | -25 | 4 | 1985,2006,2010,2014,1993,1996,1995,1986,2013,1974 |
| ON | RED LAKE A | 70 | 2014 | -31 | 5 | 1985,1978,1940,1995,2014,1964,1976,1986,1956,1955 |
| MB | RENNIE | 28 | 2014 | -32.5 | 2 | 1996,2014,1991,2007,1989,1995,1997,2013,1979,2003 |
| MB | ROBLIN | 42 | 2014 | -32.2 | 4 | 1985,1978,1996,2014,1991,2010,1996,1989,2013,1977 |
| SK | ROCK POINT | 40 | 2014 | -28.5 | 5 | 1985,1978,1996,1977,2014,1976,1982,1984,1975,2010 |
| SK | ROCKGLEN (AUT) | 30 | 2014 | -28.6 | 3 | 1978,1996,2014,1977,2010,1976,1975,2006,2003,1995 |
| ON | ROSEVILLE | 43 | 2014 | -17 | 1 | 2000,2014,2008,1987,1996,1982,1972,1999,2013,1976 |
| BC | SATURNA ISLAND CS | 28 | 2014 | -2.9 | 5 | 1985,2010,2006,1993,2014,1984,2011,1982,1983,2012 |
| ON | SAULT STE MARIE A | 57 | 2014 | -19.1 | 4 | 1975,1976,1995,2014,1989,1947,1964,2013,1997,1977 |
| BC | SILVER CREEK | 25 | 2014 | -21.5 | 3 | 2006,2010,1996,2014,1993,2003,1990,1994,2013,1991 |
| BC | SPARWOOD | 33 | 2014 | -33.5 | 2 | 1985,2014,2010,1993,2006,1996,1984,1991,1986,2003 |
| BC | SPOKIN LAKE 4E | 31 | 2014 | -36 | 2 | 1985,2014,2006,1996,2013,2010,1993,1986,1995,2001 |
| MB | ST ALPHONSE | 29 | 2014 | -27 | 4 | 2007,1996,2013,2014,1986,1989,2006,2000,2010,1991 |
| NL | ST ANTHONY | 60 | 2014 | -22.6 | 1 | 2014,1946,1993,1978,1989,2000,1994,1992,1986,1982 |
| SK | STEWART VALLEY | 30 | 2014 | -28 | 4 | 1985,1996,2013,2014,1991,2010,2006,1984,1993,1995 |
| ON | SUDBURY A | 61 | 2014 | -22.6 | 3 | 1958,1989,2014,1977,1956,1978,1982,1986,2013,1964 |
| BC | SUMMERLAND CS | 25 | 2014 | -16.8 | 3 | 2006,2010,2014,1993,1996,2003,1990,1994,2013,1992 |
| BC | SUSKWA VALLEY | 31 | 2014 | -24 | 4 | 1985,2006,1996,2014,2010,1982,1993,1990,2007,1986 |
| NU | TALOYOAK A | 31 | 2014 | -38.9 | 2 | 2004,2014,2002,1989,1993,1985,1987,1992,1994,2000 |
| ON | TIMMINS A | 41 | 2014 | -30.2 | 4 | 1975,1957,1964,2014,1989,1986,1959,1978,1976,1968 |
| AB | VEGREVILLE | 36 | 2014 | -34.6 | 4 | 1996,1985,2010,2014,1990,2006,2013,2003,1984,2011 |
| BC | VERNON SILVER STAR LODGE | 32 | 2014 | -26.5 | 5 | 2006,1985,2003,1993,2014,2009,2010,1970,1984,1994 |
| MB | WASAGAMING | 45 | 2014 | -32.3 | 5 | 1985,1978,1996,2013,2014,1986,2010,1967,1995,1971 |
| ON | WAWA A | 36 | 2014 | -25.9 | 2 | 1989,2014,2007,2013,1995,1997,1977,1986,1982,1993 |
| ON | WELCOME ISLAND (AUT) | 36 | 2014 | -20.2 | 3 | 1976,1978,2014,2007,1977,1979,1997,2013,2000,1967 |
| BC | WHISTLER ROUNDHOUSE | 35 | 2014 | -23 | 5 | 1985,1993,2006,2010,2014,1977,1975,1973,1986,1982 |
| AB | WHITECOURT | 52 | 2014 | -33.4 | 5 | 1955,1963,1950,1970,2014,1946,1964,2006,1961,1959 |
| AB | WHITECOURT A | 37 | 2014 | -32.9 | 3 | 1985,2006,2014,1996,2010,1984,1990,2003,1986,2013 |
| BC | WILLIAMS LAKE A | 54 | 2014 | -31 | 2 | 1985,2014,1996,2006,1970,1978,1993,1977,1963,2010 |
Map of snowfall in Canada for September 2014 from Environment Canada’s monthly summaries.
The size of the black dot in the top left corner represents 100cm of snow. MOUNTAIN VIEW VILLAGE got 80cm in September. Top 10 list is below.
Click for bigger.

| Prov | Stn_Name | Snow(cm) | Lat | Long |
| AB | MOUNTAIN VIEW VILLAGE | 80 | 49.132 | -113.594 |
| NU | ALERT UA | 77.8 | 82.5 | -62.333 |
| AB | KANANASKIS | 60.6 | 51.028 | -115.035 |
| AB | WILDCAT HILLS | 34 | 51.269 | -114.721 |
| AB | CALGARY INTL A | 28.2 | 51.123 | -114.013 |
| AB | OKOTOKS | 19.6 | 50.729 | -113.961 |
| NU | BAKER LAKE A | 17.8 | 64.299 | -96.078 |
| BC | FORT ST. JOHN A | 15.6 | 56.238 | -120.74 |
| NU | RANKIN INLET A | 15.4 | 62.811 | -92.115 |
| AB | BRULE BLACK CAT | 15.2 | 53.35 | -117.867 |
These are just the stations deemed ‘Normals” by Environment Canada. The temperature is the departure from the 1971-2000 average in Celsius. I’m using monthly summary.
This graphs data is sorted by Latitude (North to South) and By Name. Click for bigger.

This graphs data is sorted by Longitude (West to East) and By Name. Click for bigger.

These are just the stations deemed ‘Normals” by Environment Canada. The temperature is the departure from the 1971-2000 average in Celsius. I’m using monthly summary.
This graphs data is sorted by Longitude (West to East) and By Name. Click for bigger.

This graphs data is sorted by Latitude (North to South) and By Name. Click for bigger.

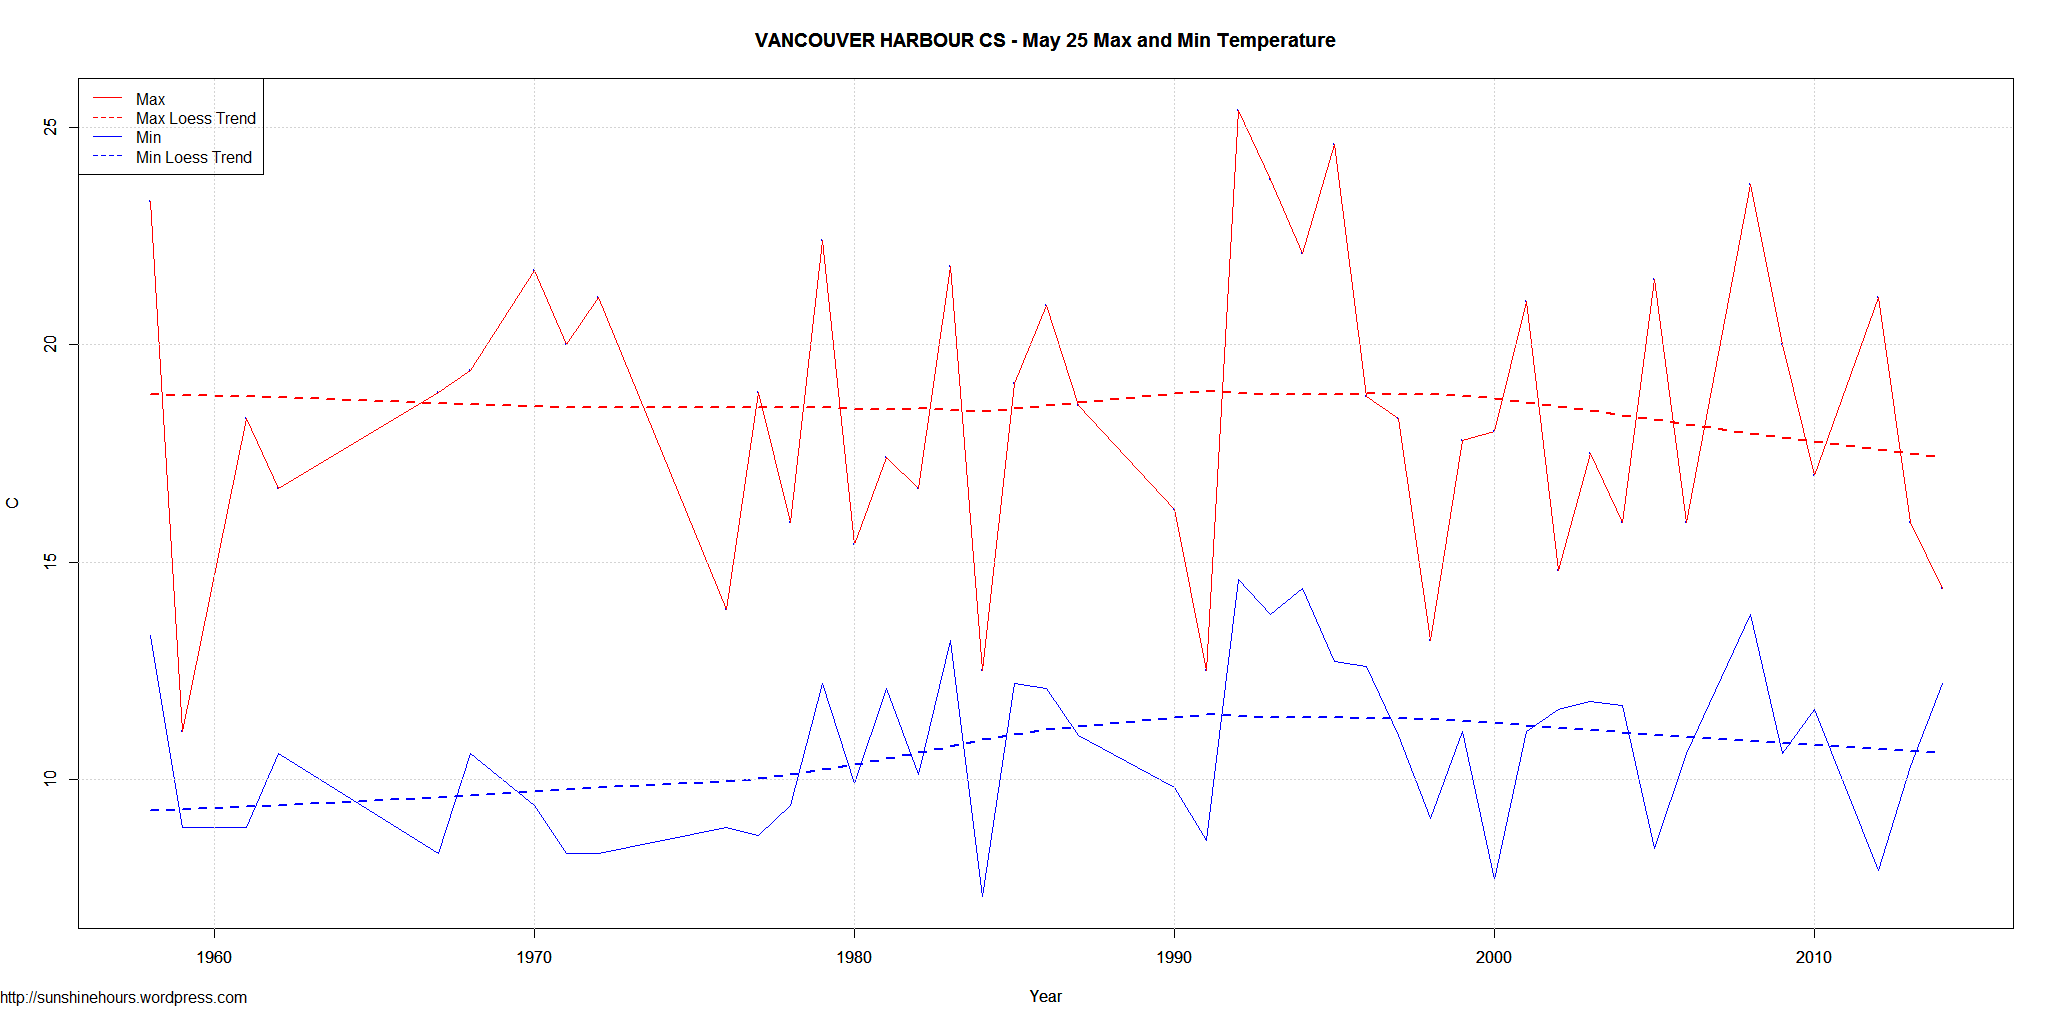
I thought it was a little cold on Sunday (May 25) so I thought I would take a look at the daily data for a weather station near me using Environment Canada’s web service.
I picked VANCOUVER HARBOUR CS which is in the harbour in Vancouver BC.
It turns out May 25 was the 6th coldest maximum temperature since 1958 (the start of the data) and the coldest since 1998. It was also the 9th warmest minimum.
Remember, this is just one day’s data for 56 years. But there isn’t much of a CO2 signal is there? (Click graph for larger)
The data is from the daily data put out by Environment Canada. (It is wrong sometimes)
These are ONLY the “Normals” stations (the stations EC calculates anomalies for from the 1971-2000 mean)
The black circle in the top left corner represents 5C divergence from the “Normals”. Blue is cold. Red is warm. Click for bigger. Refresh to make it start over.
There are 3 maps: TMean,TMin and TMax. Click on each for bigger.
TMean
TMin
TMax
Using the Environment Canada monthly summaries I have made up 2 gif movies that show which weather stations reported data for each year from 1841.
1974 with 2826 is tops for number of stations. In comparison, 2014 so far only has 1215 stations. There were more stations reporting in 1951 than 2014.
(I don’t know why a weather station in South Dakota shows up in the monthly summaries.)
The 1841 to 1864 part is kind of slow. Toronto is the only station. One gif has Station Names. Not terribly readable. But fun. Click for bigger.