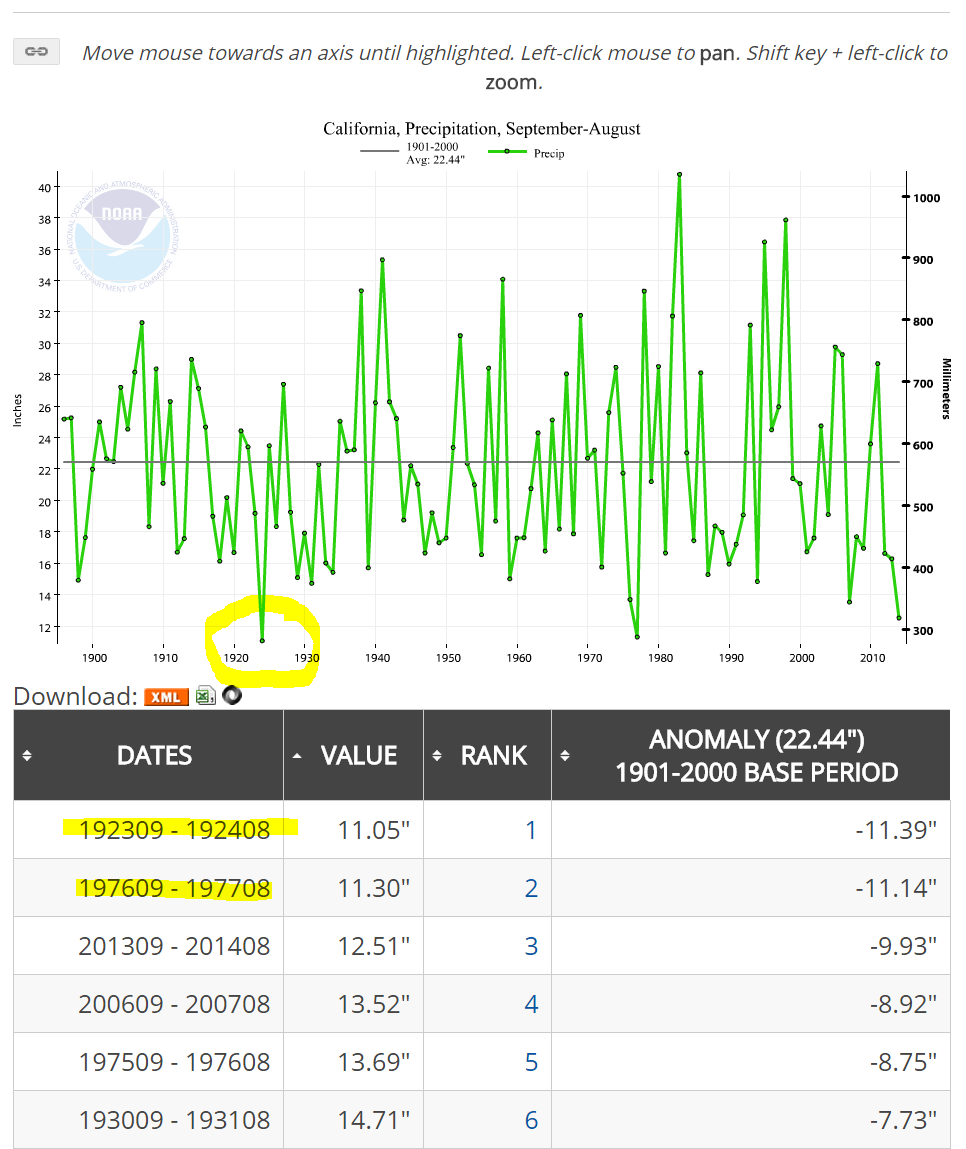
According to the NOAA, California Precipitation for Sept-Aug is the 3rd lowest of all time behind 1923/24 and 1976/77.
It must be “Global Warming” caused by CO2 if it is almost as dry as 1923.
According to the NOAA, California Precipitation for Sept-Aug is the 3rd lowest of all time behind 1923/24 and 1976/77.
It must be “Global Warming” caused by CO2 if it is almost as dry as 1923.
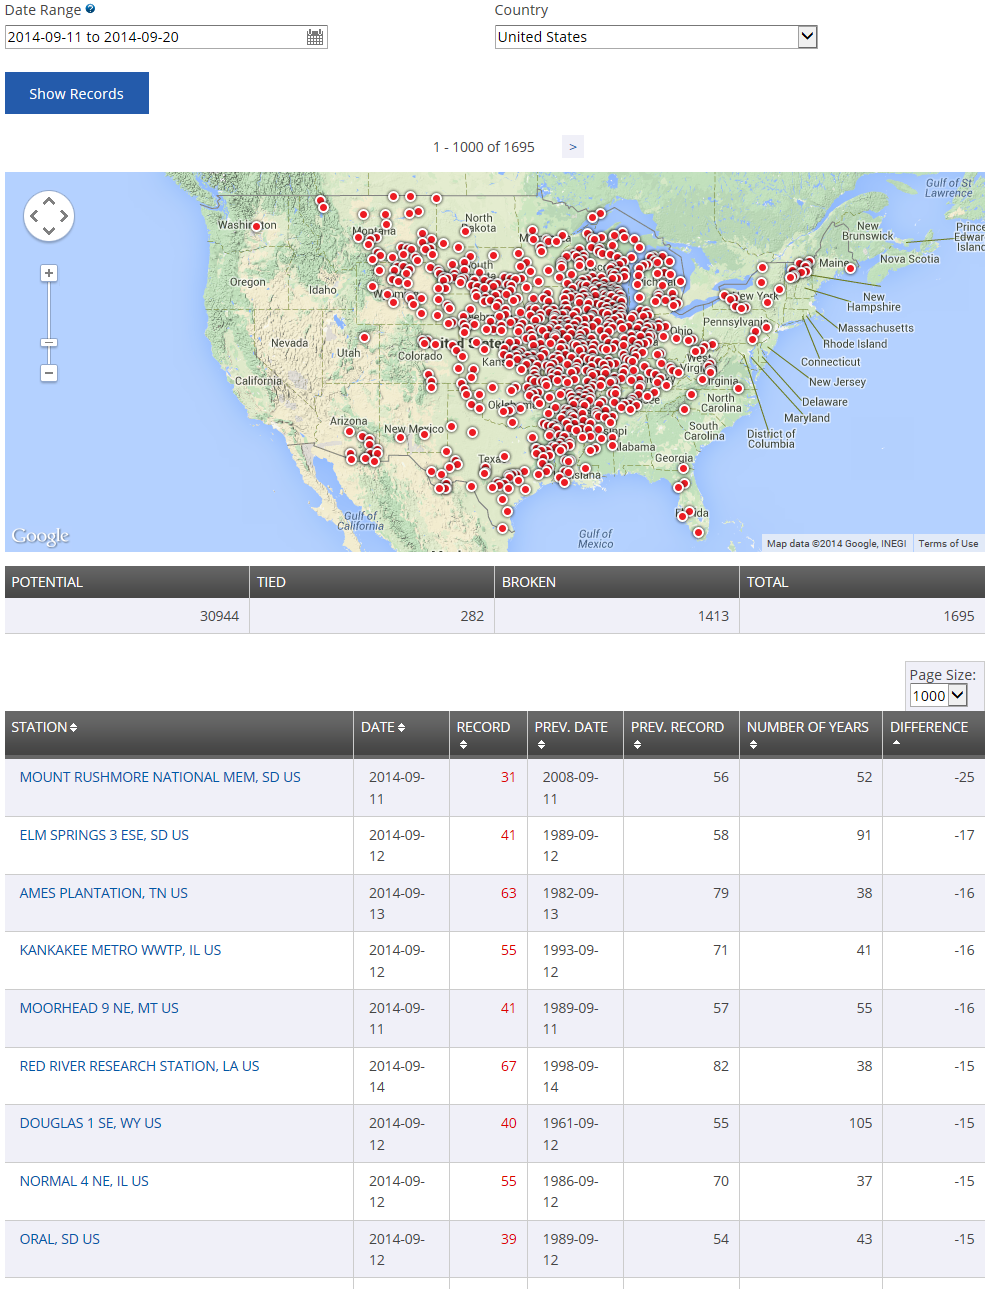
Wow. One record was broken by 25F!!!!
1695 Low Max Records Broken or Tied From Sept 11 to Sept 20 according to the NOAA.
A “Low Max” means that the maximum temperatures for the day was the lowest it has ever been. This indicates daytime cooling.
Below is a screenshot showing location and the biggest difference between old record and new record.
The list is just the ones I could capture in a screenshot.
Update: Antarctica is setting records for sea ice too.
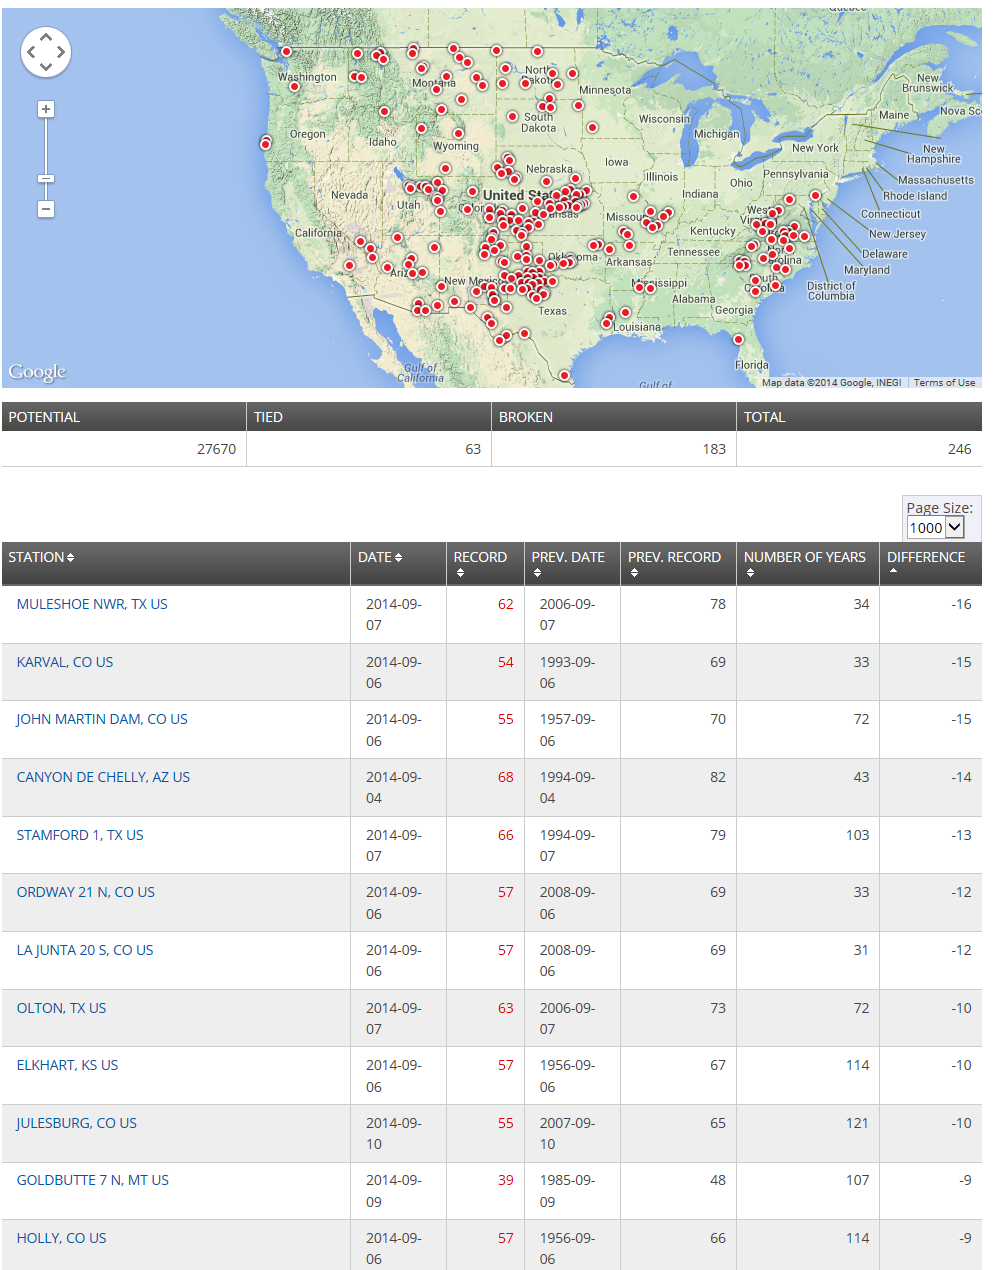
246 Low Max Records Broken or Tied From Sept 1 to Sept 10 according to the NOAA.
A “Low Max” means that the maximum temperatures for the day was the lowest it has ever been. This indicates daytime cooling.
Below is a screenshot showing location and the biggest difference between old record and new record.
The list is just the ones I could capture in a screenshot.
According to the NOAA, August 2014 ranked 110th wettest out of 120 (120 is wettest). 0.48″ above the 1901-2000 average.
The last August that was wetter was 1977.

According to the NOAA, August 2014 ranked 28th coldest out of 120 using the Maximum temperature. Average temperature is ranked 68th out of 120.

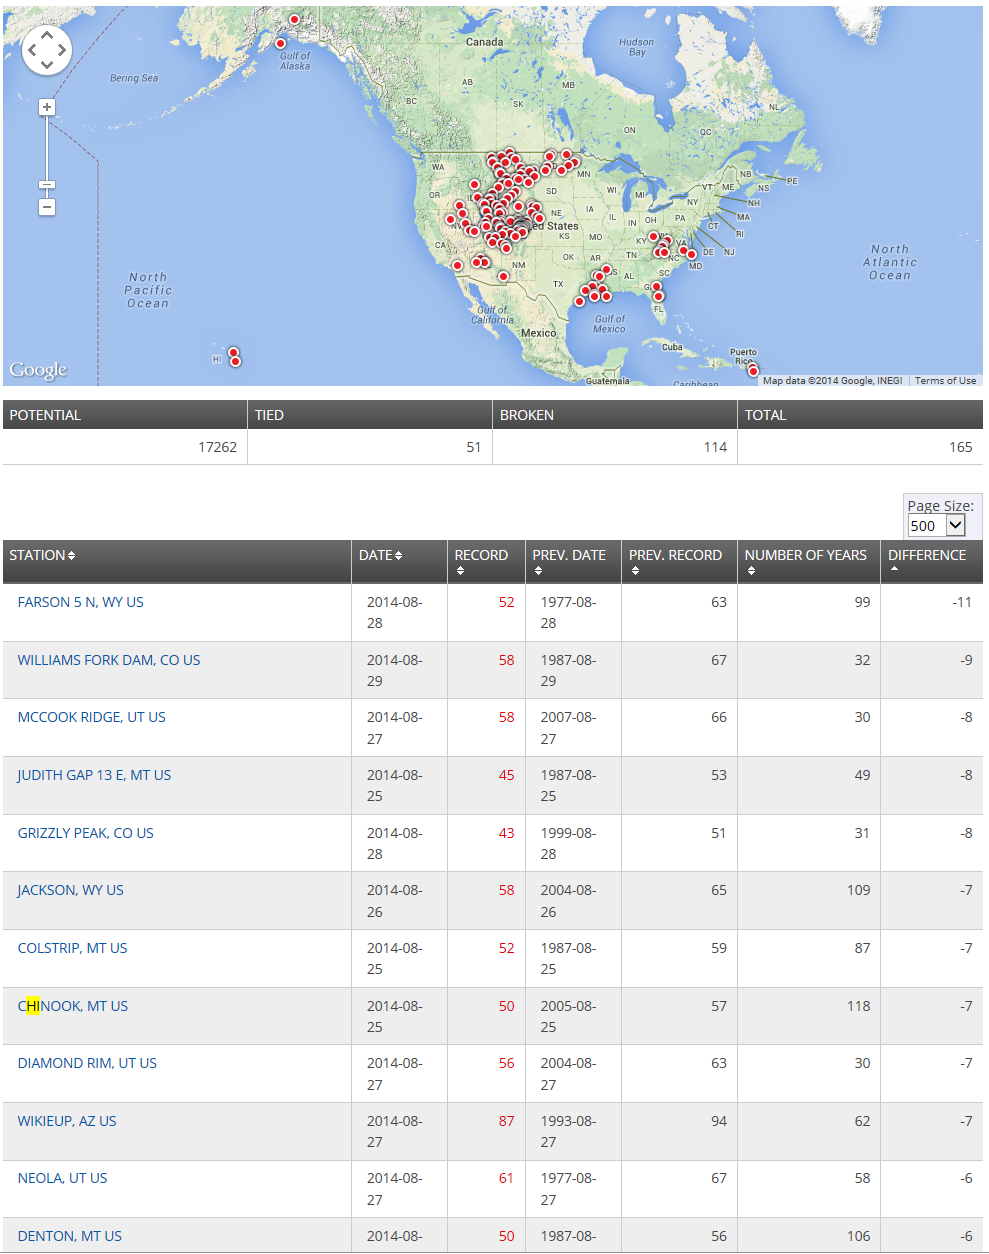
114 Low Max Records Broken and 51 Tied From Aug 25 to Aug 31 according to the NOAA.
A “Low Max” means that the maximum temperatures for the day was the lowest it has ever been. This indicates daytime cooling.
Below is a screenshot showing location and the biggest difference between old record and new record.
The list is just the ones I could capture in a screenshot.
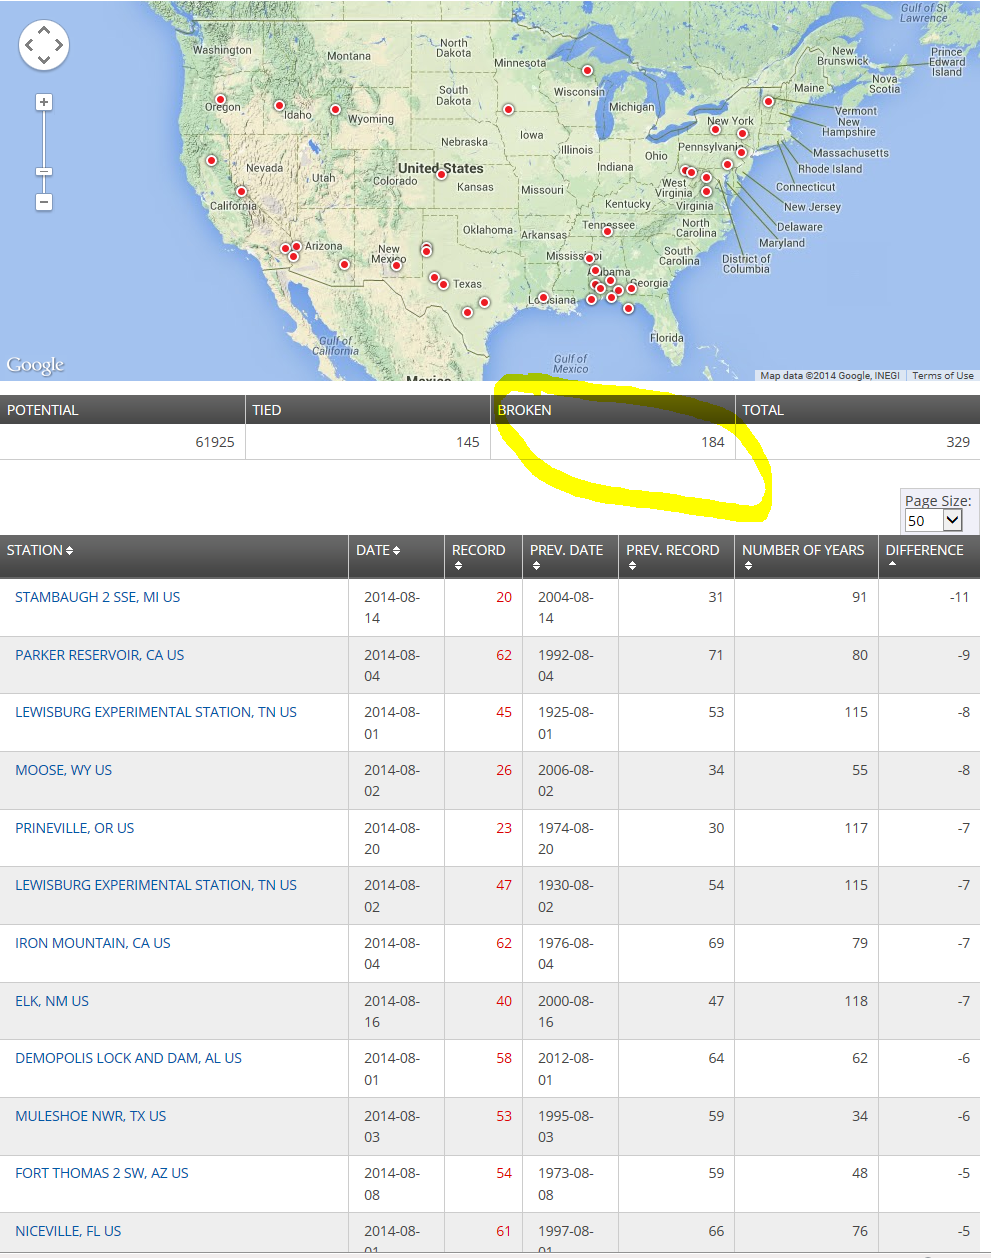
184 Low Min Records Broken From Aug 1 to Aug 21 according to the NOAA.
Below is a screenshot showing location and the biggest difference between old record and new record.
Note that Stambaugh MI has 91 years of data. And the record was demolished by 11F.
20F as a low on Aug 14. Wow.
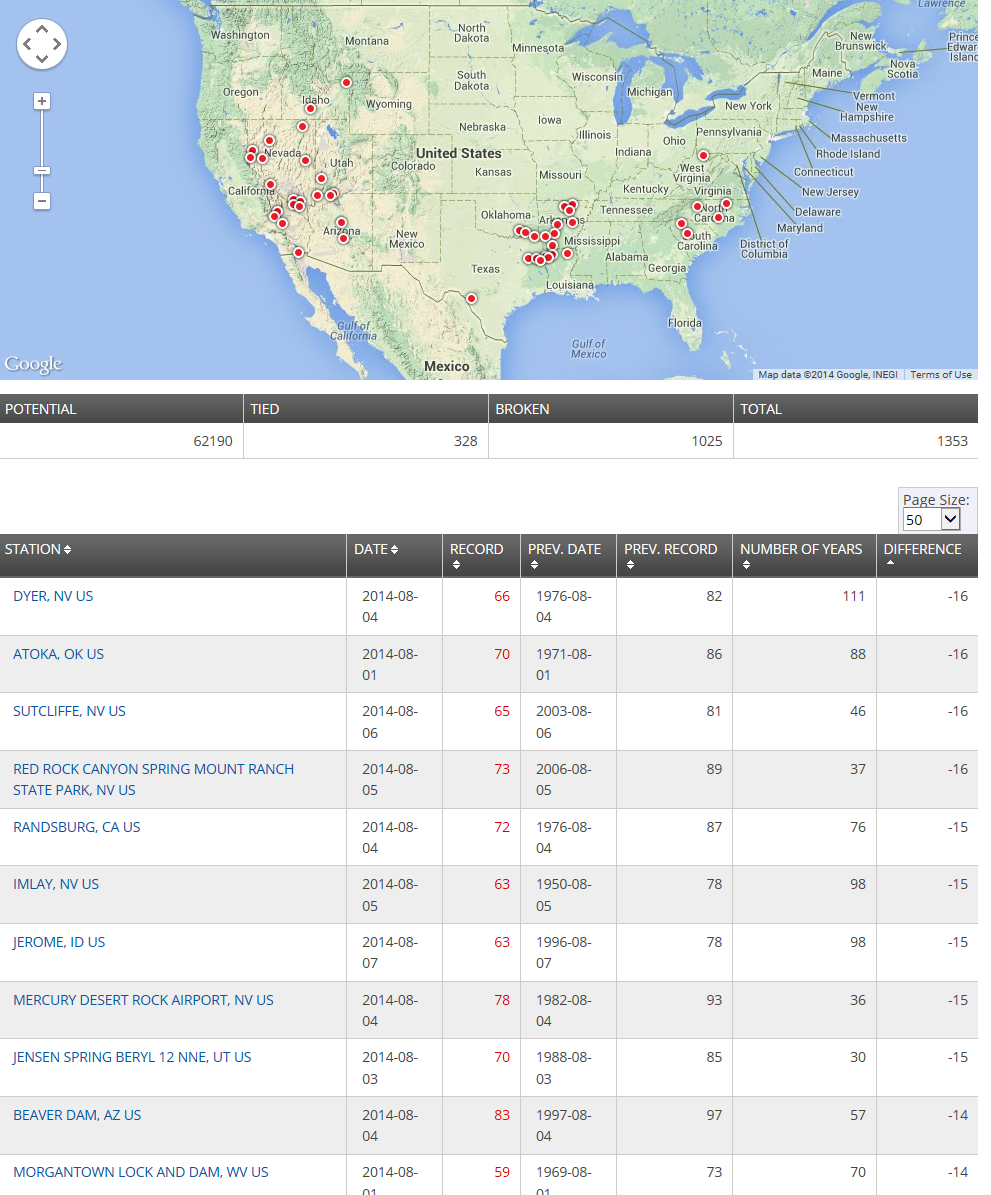
1025 Low Max Records Broken From Aug 1 to Aug 21 according to the NOAA.
A “Low Max” means that the maximum temperatures for the day was the lowest it has ever been.
This indicates daytime cooling.
Below is a screenshot showing location and the biggest difference between old record and new record.
Note that Dyer NV has 111 years of data. And the record was smashed by 16F.
According to the NOAA, for Illionois, July 2014 ranked 2nd coldest out of 120 using the Maximum temperature.
The average max in July 1936 was 97.2. In July 2014 it was 81F. That means it was 16.2F colder .

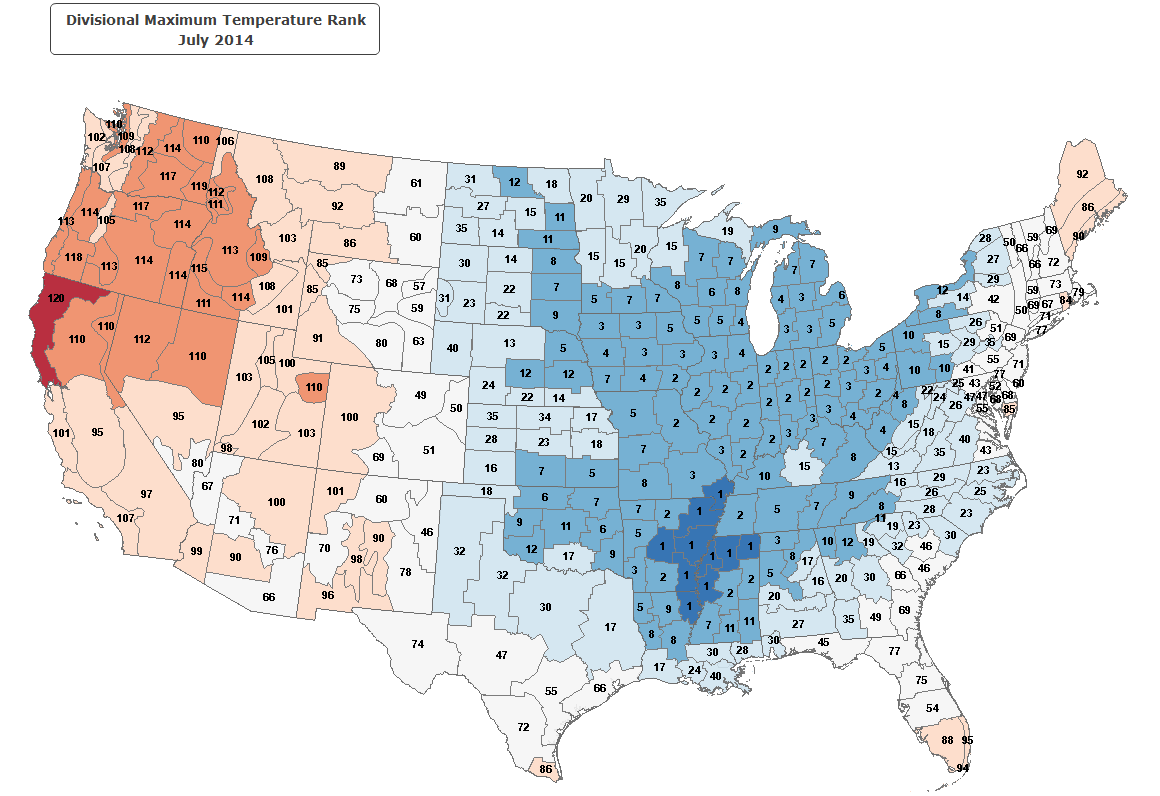
According to the NOAA, July 2014 ranked 29th coldest out of 120 using the Maximum temperature
Wow.
Take a look at the dark blue states. The number is the ranking out of 120. 1 would be the coldest. 120 would be warmest.
4 states were ranked 2nd coldest maximum temperatures since 1895.
1 was ranked 3rd, 2 were ranked 4th , 2 were ranked 5th, and there was 1 ranked 6, 1 ranked 8, 1 ranked 9 and 2 ranked 10th
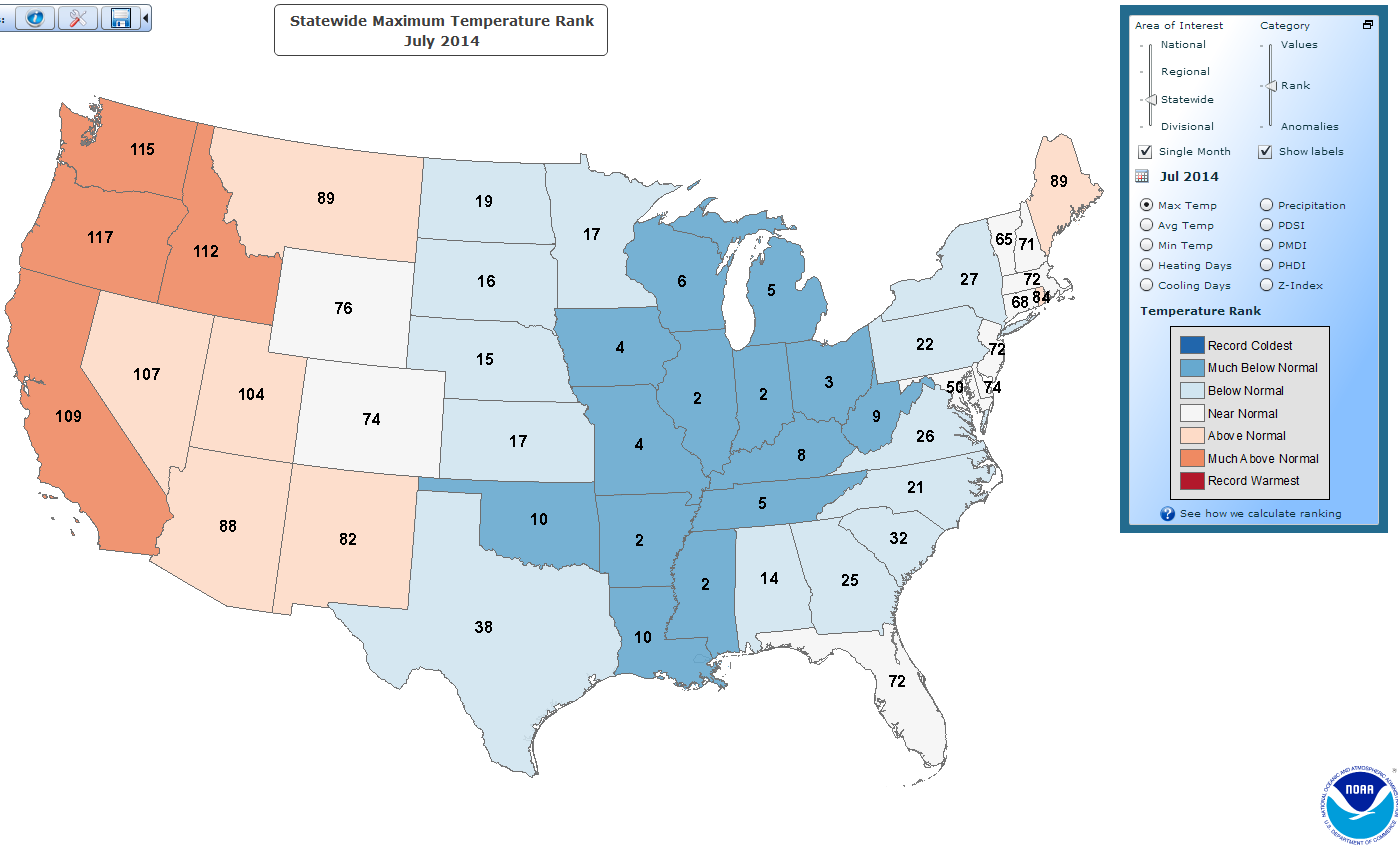
Here is the ranking by division. 10 divisions had the lowest maximum temperatures of all time. One division in northern California was ranked 120.