Every once in a while I visit the data for the Canada. Earlier today I looked at the station nearest me (NANAIMO A).
But since I have the code … I thought why not look at 10 random stations that have data in 1980 and 2015.
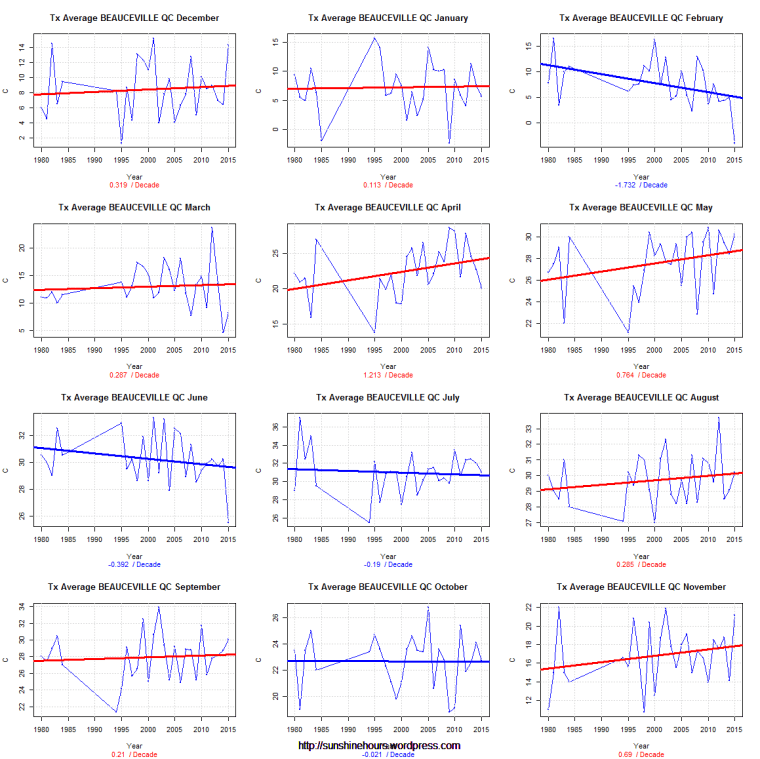
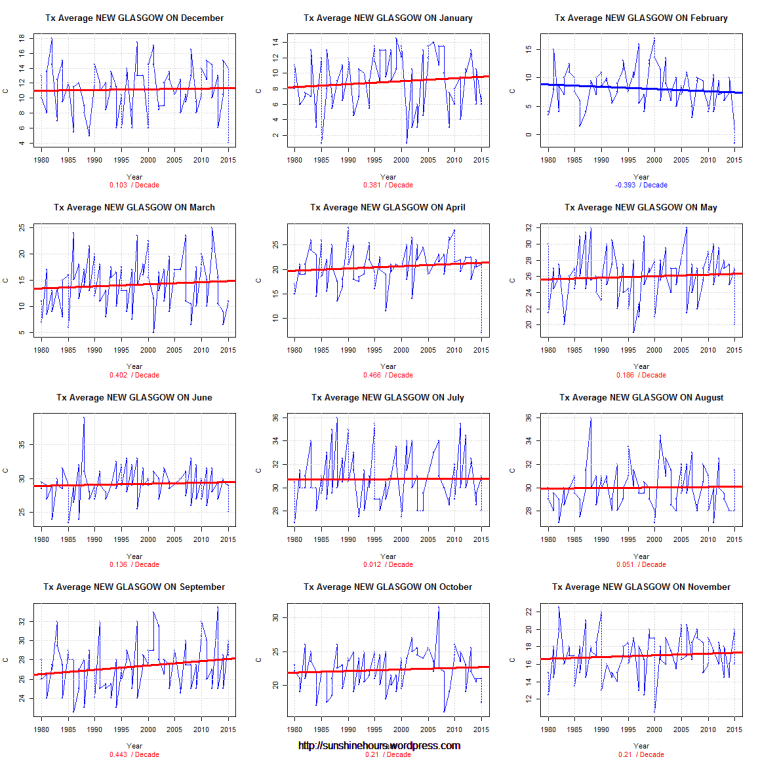
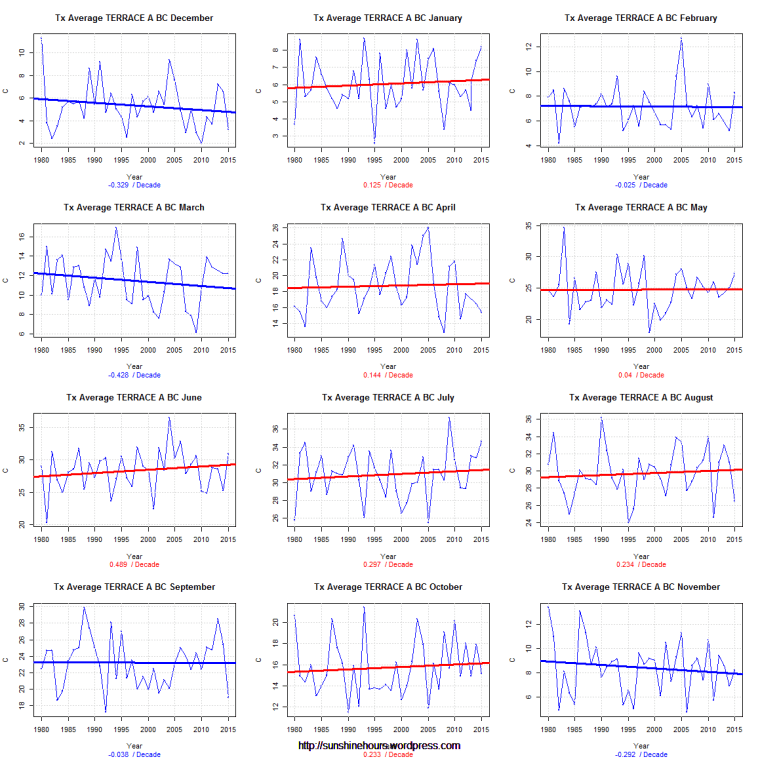
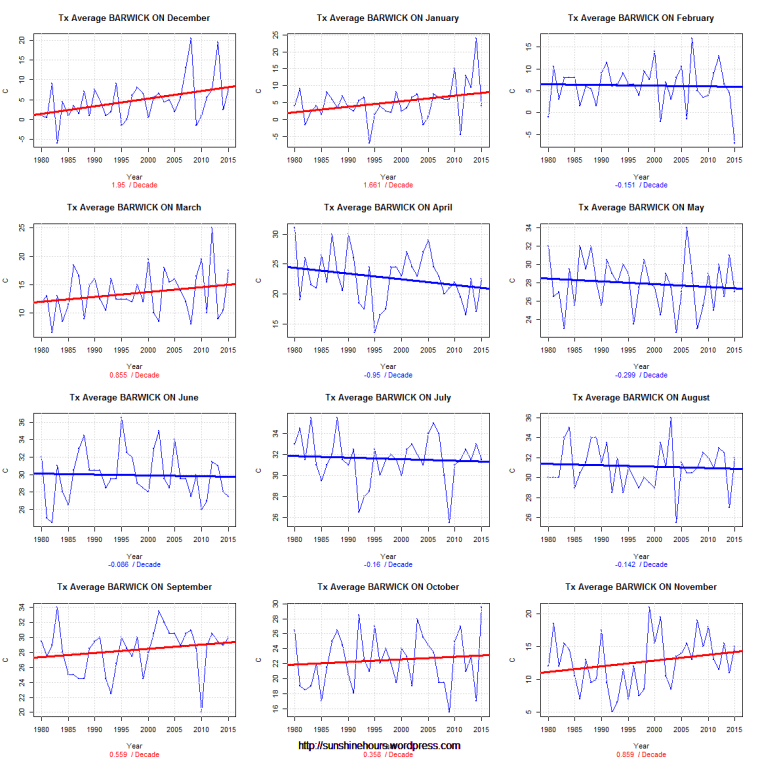
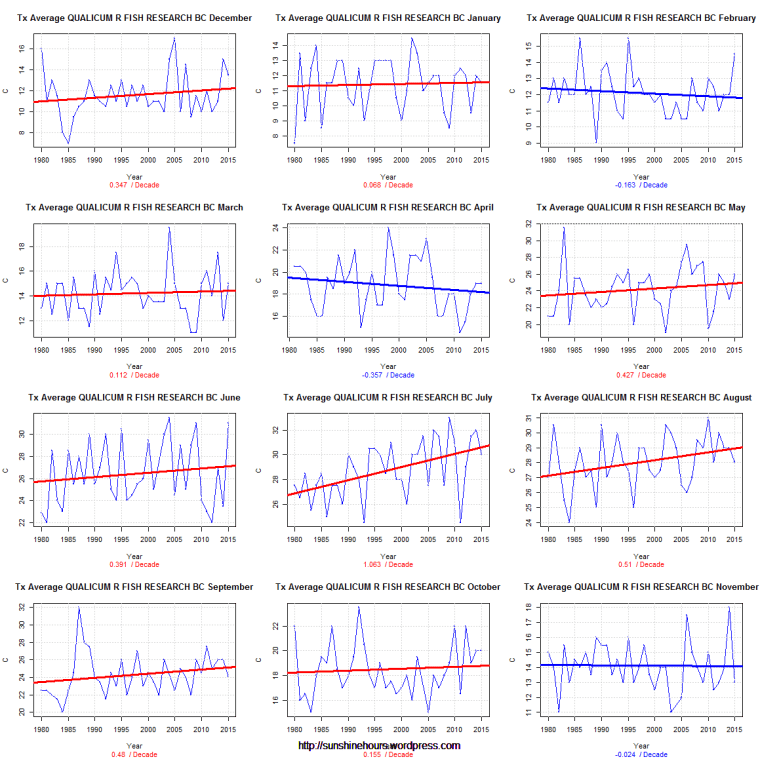
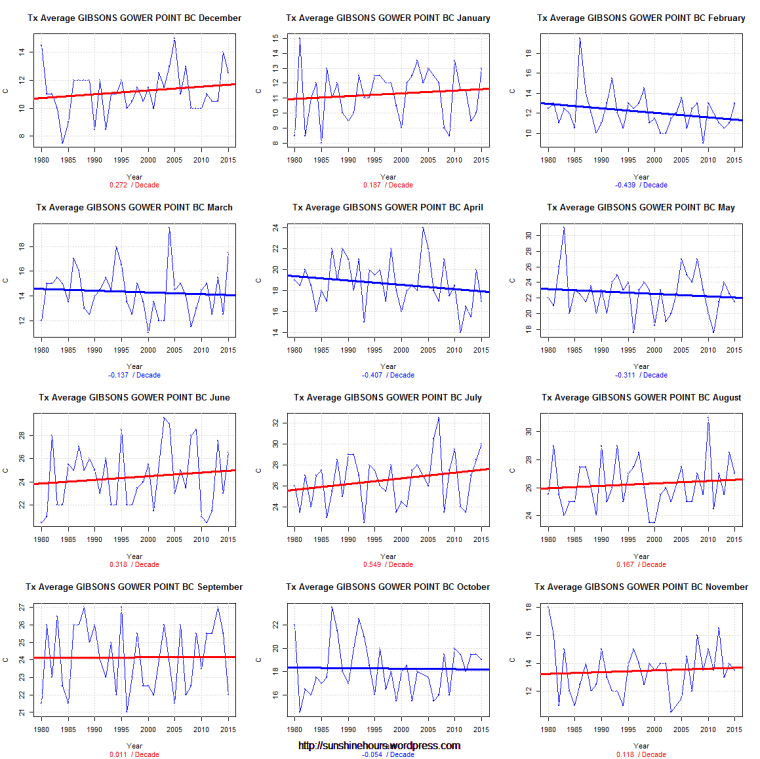
Today I am looking at TMAX monthly data (using Environment Canada monthly summaries) for 10 random stations from 1980.
Each line of graphs is a season – Dec/Jan/Feb …. etc.