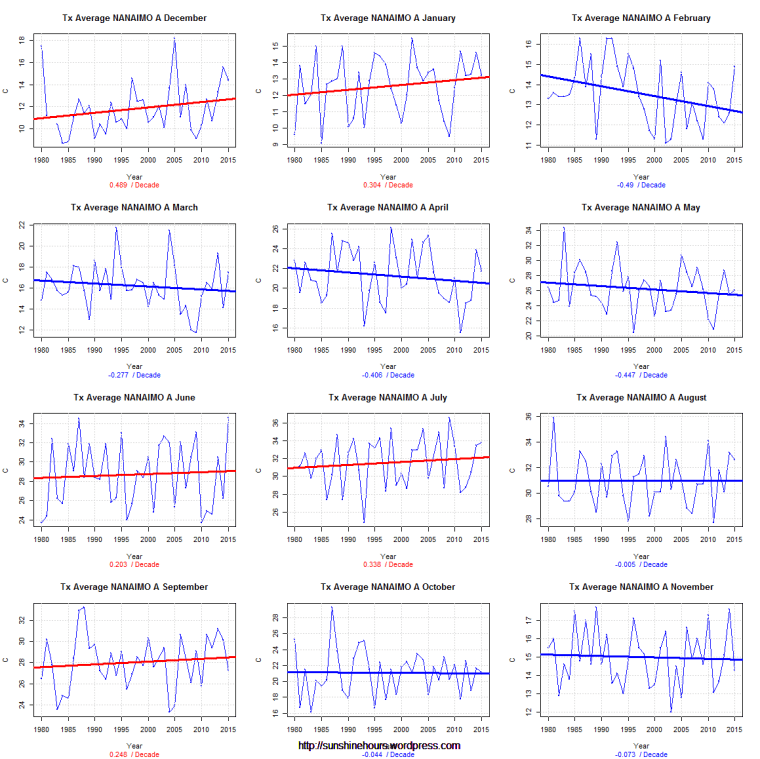
Every once in a while I visit the data for the weather station closest to my hometown on the west coast of Canada.
Today I am looking at TMAX monthly data (using Environment Canada monthly summaries) for NANAIMO A from 1980.
Each line of graphs is a season – Dec/Jan/Feb …. etc.
5 months are warming. 4 are cooling. 3 are cooling ever so slightly.
If there is a CO2 signal in there I am missing it.

One thought on “Nanaimo Tmax from 1980”