Save The Coal: High-Grade Wood Going Up In ‘Biomass’ Smoke

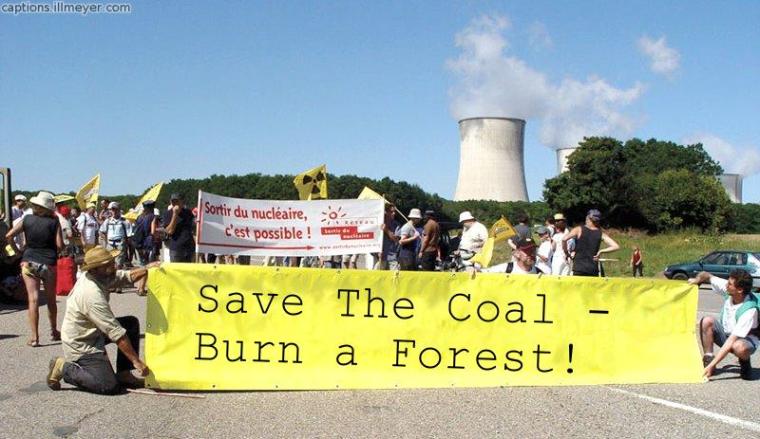
The green plan to destroy forests by burning them in power plants is moving forward. Luckily, all that coal is being saved from being turned into electricity by the brave Biomass Plant Operators.

“Business owners in Cape Breton who rely on the forest for a living say high-quality hardwoods are making their way into Nova Scotia Power’s biomass plant in Point Tupper, consuming a wood supply that instead should be available for value-added businesses such as flooring and lumber.

David Fraser of BA Fraser Lumber in Margaree Valley, Inverness County, says he is seeing fewer quality saw logs and he blames it on Nova Scotia Power’s policy of getting the most amount of biomass fuel for the cheapest price.

Fraser, who runs a sawmill and is also a contractor who supplies wood to customers, said contractors simply can’t afford to separate quality saw logs from lower-quality stands of wood intended for the biomass plant.”

http://thechronicleherald.ca/novascotia/1206909-high-grade-wood-going-to-point-tupper-biomass-plant-mill-owners

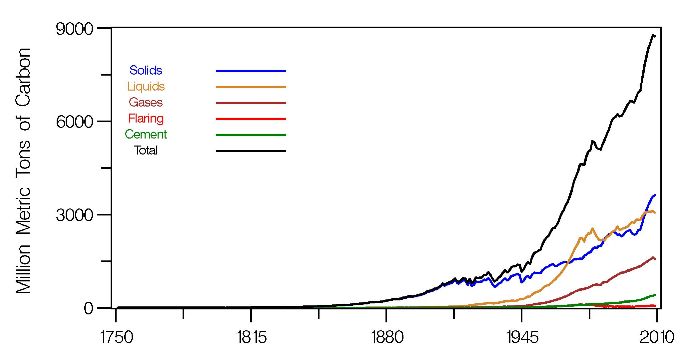
The plant requires 650,000 tonnes of trees per year for the $200 million power plant that only produces 60 Megawatts of power. Nova Scotia is closing coal power plants so they can burn trees instead.

Save The Endangered Coal! Trees are evil and must be burned instead.


Embed from Getty Images

Could CO2 have lowered the rate of natural warming in the oceans?

As a minor followup to my post “Could CO2 have lowered the rate of natural warming?” lets consider ocean warming.

From 1900 to 1945 oceans were warming at a rate of  0.0116188C per year.

After 1945 oceans were warming at a rate of 0.00654978C per year.

Which means the massive 1945 increase in CO2 after 1945 slowed the  rate of ocean warming by 0.00506902C per year. Which is a drop off 44%.

Could_CO2_SST

Woodfortrees Url is here.


Could CO2 have lowered the rate of natural warming?

Lets say you have a pot of water that is warming, but you can’t see underneath it. There is a thermometer in the pot, and intermittently you write down the temperature.

And at some point some people come up with a theory that suggests a 2nd candle is now adding its energy to the pot of water. So what are you going to do?

Well, one way is to take the temperature data and graph it and calculate the trend before and after the supposed appearance of the 2nd candle. The change in trend is possibly the extra energy added by the 2nd candle.

Of course the analogy is really about CO2. So lets pick say … 1945 as the supposed appearance of the 2nd candle (CO2).

Why 1945? That is when CO2 really took off. Here is the CDIAC data in million metric tons of CO2.

CDIAC-co2


And here is the data graphed. 1900 to 1945 in red. And 1945 to 2014 in blue. With trends.  I used Woodfortrees for the graph and here is the url.

Candle_1945_2014


So … what are the trends.

1900 to 1945 = 0.0110866C / Year

1945 to 2014 = 0.00954579 / Year


I conclude the 2nd candle actually changed the trend downward by 0.00154081C / Year.

Maybe it wasn’t a candle? Maybe it was an ice cube.

I think only conspiracy theorists could come up with a 2nd candle theory when the trend actually went down.


Biofuels do more harm than good, UN warns

Haven’t the “deniers” been saying this for a long time? Biofuels are a cruel joke on the poor. Driving up food prices and creating more CO2.

“The United Nations will officially warn that growing crops to make “green” biofuel harms the environment and drives up food prices, The Telegraph can disclose.

A leaked draft of a UN report condemns the widespread use of biofuels made from crops as a replacement for petrol and diesel. It says that biofuels, rather than combating the effects of global warming, could make them worse.

The draft report represents a dramatic about-turn for the UN’s Intergovernmental Panel on Climate Change (IPCC).”

Billions squandered by idiots.

http://www.telegraph.co.uk/earth/energy/10716756/Biofuels-do-more-harm-than-good-UN-warns.html


40 Years of Rising CO2 compared to Temperature

40 Years of Rising CO2 … 1940 to 1979. Officially CO2 measurements only started in the 50s, but I think one can extrapolate backwards.

CO2 didn’t have much effect. The Temperature trend over those 40 years was -0.026C per decade. About -0.1C for the 40 years.

40 Years of rising CO2 a

http://www.woodfortrees.org/plot/hadcrut4gl/from:1940/to:1979/plot/hadcrut4gl/from:1940/to:1979/trend/plot/esrl-co2/from:1940/to:1979/offset:-300/plot/esrl-co2/from:1940/to:1979/offset:-300/trend

Lets take a look at the same graph without the CO2 part.

40 Years of rising CO2 b

http://www.woodfortrees.org/plot/hadcrut4gl/from:1940/to:1979/plot/hadcrut4gl/from:1940/to:1979/trend

CO2 increases of 80ppm to 100ppm are normal

While CO2 has increased by 85 ppm from when measurements began  in 1958 and are estimated to have risen by 120 ppm since 1750, we should also realize that increases of 80 ppm to 100 pm occurred during the last 3 glaciations without humans burning fossil fuels.

” Air trapped in bubbles in polar ice cores constitutes an archive for the reconstruction of the global carbon cycle and the relation between greenhouse gases and climate in the past. High-resolution records from Antarctic ice cores show that carbon dioxide concentrations increased by 80 to 100 parts per million by volume 600 ± 400 years after the warming of the last three deglaciations. Despite strongly decreasing temperatures, high carbon dioxide concentrations can be sustained for thousands of years during glaciations; the size of this phase lag is probably connected to the duration of the preceding warm period, which controls the change in land ice coverage and the buildup of the terrestrial biosphere.”

http://www.sciencemag.org/content/283/5408/1712.abstract


HADCRUT4 1930 to 1949 by Month – Dangerous pre-CO2 Global Warming

HADCRUT4 1930 to 1949 by Month.

Normally you see this part of the graph with 2 or 3 red ticks because it is done annually.

Keep in mind the highest red tick is an anomaly of 0.355C for August 1945. The anomaly for August 2012 was 0.532C. Which is only 0.177C warmer. (Corrected)

Click to see bigger.

HADCRUT4 1930 to 1949

Dirty Truth About Wood-Burning Biomass

“Far from being “carbon neutral,” wood-burning biomass actually emits more carbon dioxide (the primary global warming greenhouse gas) per unit of energy produced than either gas or coal. Yes, trees can grow back and reabsorb that carbon, but that growth takes many years. The most recent studies show that

The renewability of wood is also questionable, as forests would be threatened by any meaningful increase in electricity generation using biomass as fuel. Replacing just 10 percent of the coal used in Pennsylvania would require more than 12.8 million green tons of wood per year — far more than the state’s annual commercial wood harvest (about 5 million tons).

Read more here.

SaveTheCoal