California February 2014 – Almost 6 Times As Much Rain Compared to January

Update: I had 2013 in the title. Sorry. (thanks justsoeguy31167)

According to the NOAA, California averaged 3.43 inches of rain in February 2014, which was only .42 inches below the 1901-2000 mean.

That is about 5.7X as much rain compared to January when California only averaged only .6 inches of rain.

One month of average rainfall won’t end a drought, but it sure helps.

NOAA_Feb_2014_California_Rainfall

NOAA USA January – 67 January’s Were Warmer

According to the NOAA, January was only the 53rd warmest out of 120. That means 67 January’s (out of 120) were warmer.

The lower 48 states were pretty much divided right down the middle. Very cold in the east, warm in the west and normal in the states directly above Texas.

Alabama had its 4th coldest January in 120 years. It was -8.3F colder than normal. Minnesota was the coldest state, averaging 2.3F. Brrr. Only 52.3F colder than Florida.

Here are the maps of average temperature, rank out of 120 (120 = warmest) and temperature anomaly from 1901-2000

Average Temperature in F

NOAA_JAN_2014_Map_Average_Temperature

Rank out of 120 (120 = warmest and 1 = coldest)

NOAA_JAN_2014_Map_Rank

Anomaly in F from 1901 – 2000 average.

NOAA_JAN_2014_Map_Anomaly

XKCD and Global Warming and St Louis

XKCD is a funny geeky comic that I read quite regularly. The blog Inconvenient Skeptic has a good post about being annoyed with a recent XKCD strip that mocks people for using the recent cold days to “disprove” global warming.

Go ahead, read the blog posting (if you are still interested) and comic and then return here.

I was ticked at XKCD for the obvious reason. The mainstream media always loves to blame global warming for any warm spell but never uses cold spells to mock the concept of global warming. I guess when XKCD followed along I was disappointed.

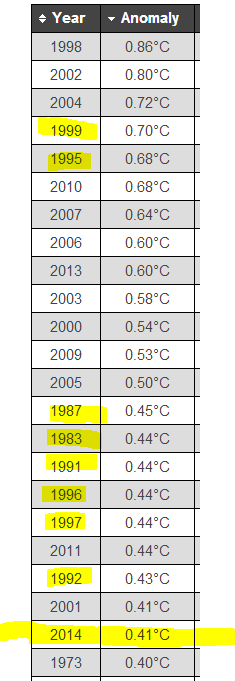
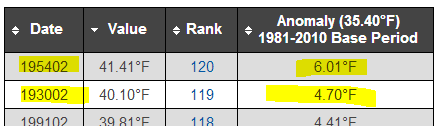
However, beyond that point I was interested in the St Louis data linked by the blog post here. I was immediately interested in the heatwave data in this Excel spreadsheet. I’ll just show the top twenty rows.

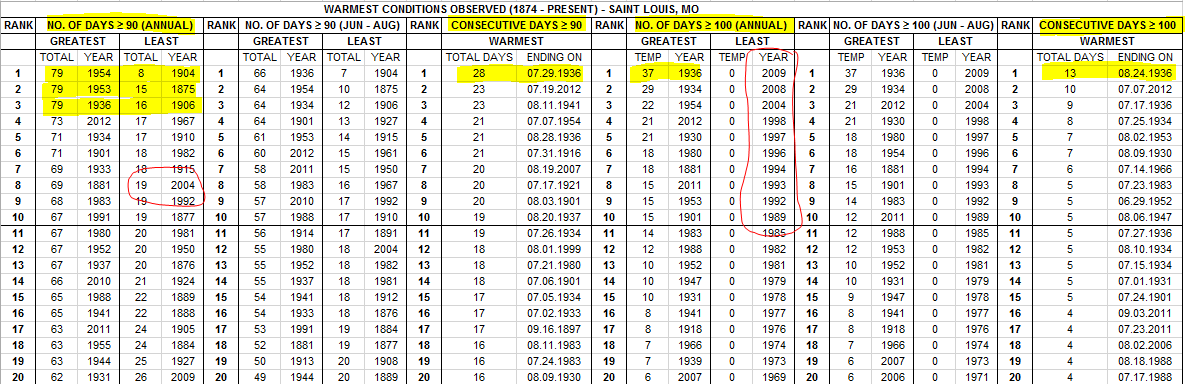
Notice 2012 didn’t make the top of any highlighted lists. It came close.  But 1954, 1963 and 1936 had more days greater than 90F. 1936 topped consecutive days above 90F.

And 1936, 1934 and 1954 topped the list of days over 100F. And 1936 was the year with most consecutive days above 100F.

And the red circled years are the Least number of days above 90F and 100F. Notice there are recent years without any 100F days at all.

And while I didn’t highlight it, notice that in 1954 22 days were above 100F. Only 18 were in Jun/Jul/Aug. The other 4 were int the spring or fall. Now thats hot.

So much for recent “warming”. St Louis had more extreme heat in the past. Even 2012 did not set new records.

StLouis_Heatwave


NOAA USA December 2013 – 6 States Cooling From 1895

A few interesting (to me) graphs concerning the NOAA December 2013 temperate data.

Did you know six states (the ones in blue) have been cooling since 1895?

NOAA Dec 1895 to 2013

Did you know 30 states (of the lower 48) are cooling from 1998. North Dakota is cooling at at -56F per century in December since 1998.

NOAA Dec 1998 to 2013

Did you know that if you checked to see how far back you have to go to find the longest negative trend for December, many states go back a long, long way? Only Delaware is weird. NOAA - How Far Can You Go Back - Dec as of 2013

North Dakota Cooling At -13.76F per Century From 1998 to 2013

I would hate to be living in North Dakota’s recent climate.

From 1998 it has been cooling at -13.76F per Century.

Four of the months are warming. 95% of the warming has occurred in June and September. Eight months are cooling. 77% of the cooling has occurred in Feb/Dec/Apr.

The percentages are the % of cooling or warming the month contributes to the cooling/warming trend total. The x-axis is not the same for each graph because of the huge range.

NOAA North Dakota 1998 to 2013 - Trend -13.76F per Century