USA Temperatures – Shrinking Population = Cooler / Growing Population = Warmer

A couple of years ago I posted an article about waste heat.

“The waste heat generated by car engines, power plants, home furnaces and other fossil fuel-burning machinery plays an unappreciated role in influencing regional climates, new computer simulations suggest. By altering atmospheric circulation, human-made heat may raise temperatures by as much as 1 degree Celsius during winter in the northernmost parts of the world.”

Compare this map of CRN temperature changes from a WUWT article to the population growth map.

A large part of the US is shrinking population-wise and that part of the USA is cooling.

 WUWT_CRN_clip_image0047

2010-census-counties_png_800x1000_q100

NOAA – 759 Low Max Records Broken or Tied in 3 Days – Feb 26 to Feb 28 2015

Ooops:  This post originally said “Low Min”. The values are “Low Max”.

759 Low Max Records Broken or tied in last 3 Days according to the NOAA.

Below is a screenshot showing location and the biggest difference between old record and new record.

The list is just the ones I could capture in a screenshot. Wow. Many records broken by over 20F.

Imagine … the old record was 51F and it is now 23F. A 28F difference.

Some of the records broken were over 100 years old.

Capture

NOAA – 2634 Low Max Records Broken or tied From 2015-02-19 to 2015-02-25

(This is a different post than the Low Min one)

Low Max records track the lowest maximum temperature for the day.

2634 Low Max Records Broken or tied From 2015-02-19 to 2015-02-25 according to the NOAA. (That is 15% of all the measurements for that period)

Below is a screenshot showing location and the biggest difference between old record and new record.

The list is just the ones I could capture in a screenshot. Wow. Many records broken by over 20F.

Imagine … the old record was 34 and it is now 3F. A 31F difference.

Capture

NOAA – 1913 Low Min Records Broken (272 tied) From 2015-02-19 to 2015-02-25

UPDATE #2 – Even more records have been broken.

UPDATE: I also have a blog post on the LOW MAX records.

1913 Low Min Records Broken in Last 7 Days (272 tied)  according to the NOAA.

Below is a screenshot showing location and the biggest difference between old record and new record.

The list is just the ones I could capture in a screenshot. Wow. Many records broken by over 30F.

Imagine … the old record was 15F and it is now -23F. A 38F difference.

Capture

USA NOAA January 2015 Tmax – States

Oooops: I initially used C/Decade. It is F/Decade.And I have to check the Trend.

Update: The trend is correct once I corrected the units.

Update: Here is a link to NOAA for CaliforniaOhio is doing the opposite since 1998.

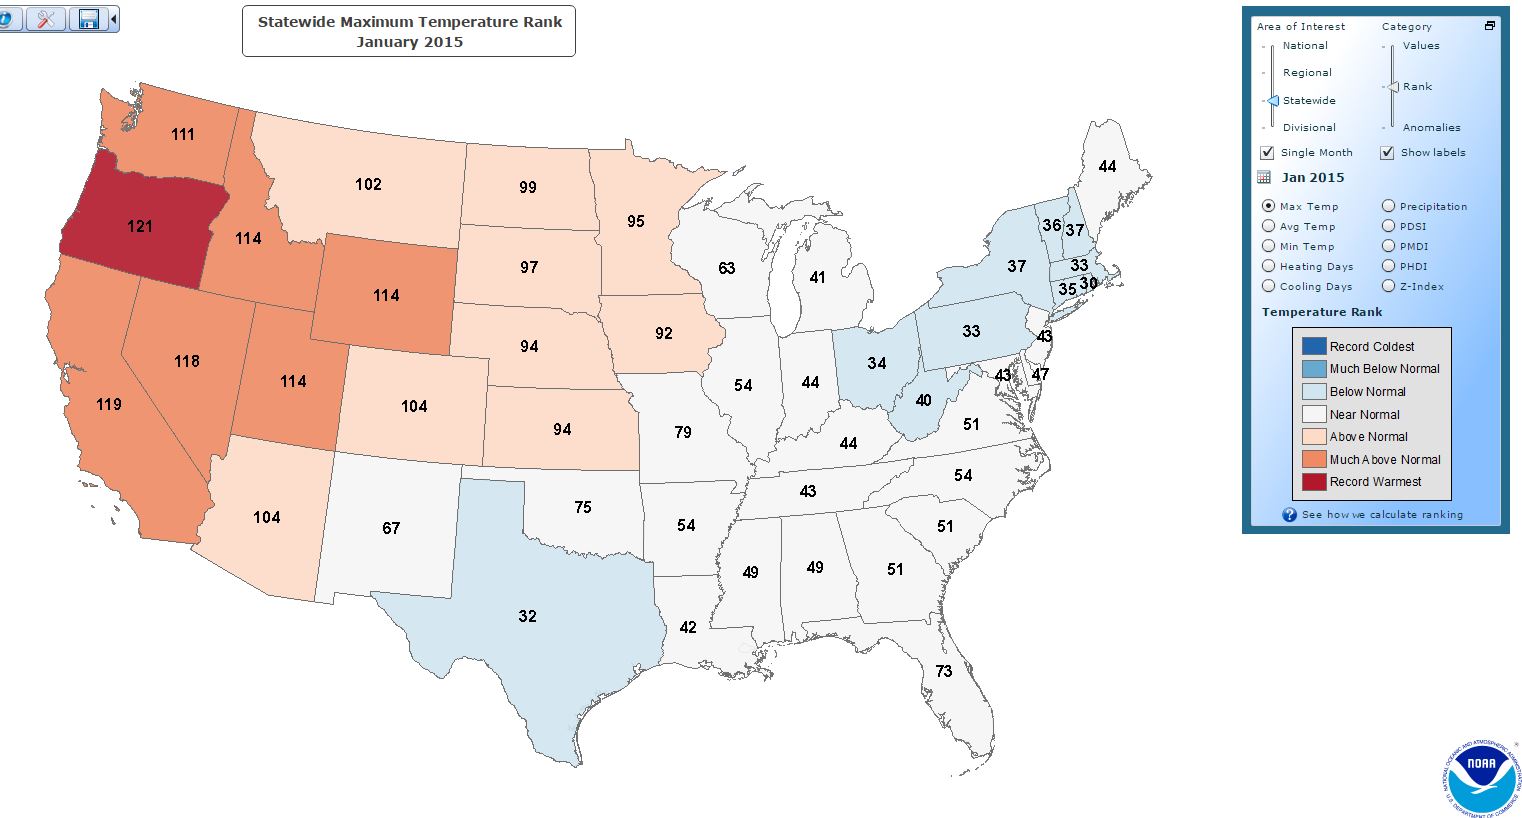
January 2015 Tmax Ordered By State Rank

Only 6 States in the top 10.  Only 9 in the top 20. 27 out of 48 have a rank of less than 61 (the middle of 121).

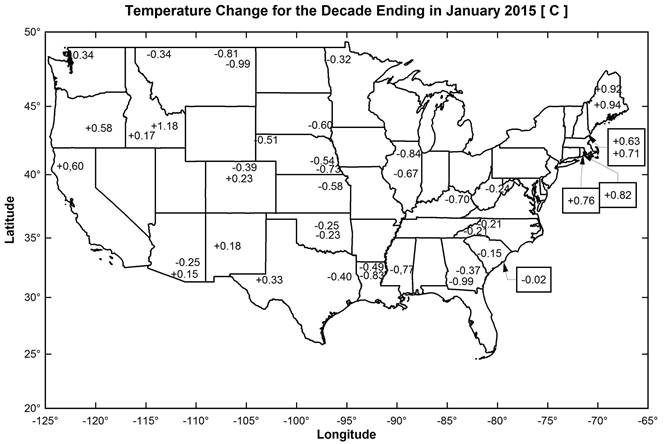
And note that 15 states January’s are cooling since 1895 .

And 38 states January’s are cooling since 1998.

State Rank (1 = Hottest) Trend Since 1895 in F/Decade Trend Since 1998 in F/Decade
Oregon 1 0.45 1.86
California 3 0.36 2.66
Nevada 4 0.29 0.79
Utah 8 0.31 -1.6
Wyoming 8 0.38 -0.15
Idaho 9 0.26 0.33
Washington 11 0.38 0.28
Arizona 19 0.34 -0.63
Colorado 19 0.23 -0.96
Montana 22 0.44 0.83
North Dakota 23 0.45 0.85
South Dakota 25 0.3 -0.61
Minnesota 27 0.24 -1.38
Kansas 28 0.2 0.06
Nebraska 29 0.2 -1.02
Iowa 31 0.01 -1.3
Missouri 44 -0.03 -0.62
Oklahoma 49 0.11 0.05
Florida 51 0.05 -0.54
New Mexico 56 0.23 -1.67
Wisconsin 60 0.12 -2.32
Arkansas 68 -0.11 -1.43
Illinois 68 -0.06 -1.8
North Carolina 68 -0.06 -1.75
Georgia 71 -0.01 -1.63
South Carolina 71 -0.04 -1.48
Virginia 71 -0.02 -2.29
Alabama 73 -0.17 -1.65
Mississippi 73 -0.19 -1.64
Delaware 75 0.07 -2.16
Indiana 78 -0.13 -2.57
Kentucky 78 -0.15 -2.67
Maine 78 0.13 0.3
Maryland 79 0.06 -2.46
New Jersey 79 0.17 -2.12
Tennessee 79 -0.18 -2.24
Louisiana 80 -0.12 -2.02
Michigan 81 0.13 -1.92
West Virginia 82 -0.16 -2.84
New Hampshire 85 0.08 -0.63
New York 85 0.06 -1.18
Vermont 86 0.04 -0.66
Connecticut 87 0.1 -1.24
Ohio 88 -0.09 -2.85
Massachusetts 89 0.11 -1
Pennsylvania 89 0.04 -2.6
Texas 90 0.05 -2.3
Rhode Island 92 0.13 -1.14

NOAA October 2014 – Amazing Divergence Between USA and Global

Update: Global is LAND temperatures, not LAND and OCEAN combined because of course the USA is not an ocean.

Wow.This is NOAA Global versus NOAA USA Tmax for October only.

What an amazing divergence over the last 30 years.

When the AGW cult says the USA is only 2% of the globe, remind them that USA and Global temperatures used to track pretty closely.

NOAA Global versus NOAA USA for October as of 2014