According to the NOAA, May 2016 was ranked 49th coldest out of 122.
That is essentially a tie with May 2015. The warmest May Tmax’s were 1934, 1936, 2012 and and 1939.
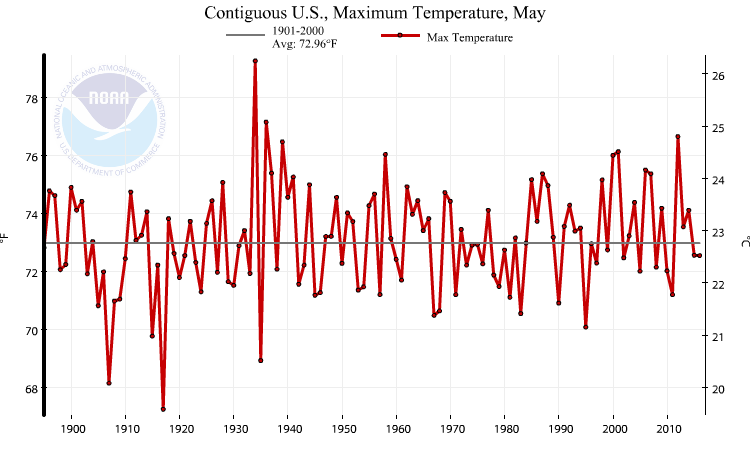
The following map shows state rankings. 122 = warmest. 1 would be coldest.
Note the states ranked 7th and 8th coldest. Wow. Not much El Nino effects …

No surprise for anyone paying attention.
A study published in late April by an environmental group found that Europe’s biofuel regulations created 80 percent more carbon dioxide (CO2) emissions than the conventional oil they replaced. The report estimates the biofuels create new emissions equivalent to putting an extra 12 million cars on the road.
Europe has been blending small percentages of biofuels into conventional gasoline and oil and diesel specifically to reduce CO2 emissions. The continent plans to require biofuels account for 10 percent of all fuel used by 2020. The EU’s CO2 emissions are estimated to have increased by 0.7 percent last year relative to 2014, even though the continent has spent an estimated $1.2 trillion financially supporting green and bio-energy with the goal of lowering CO2 emissions.
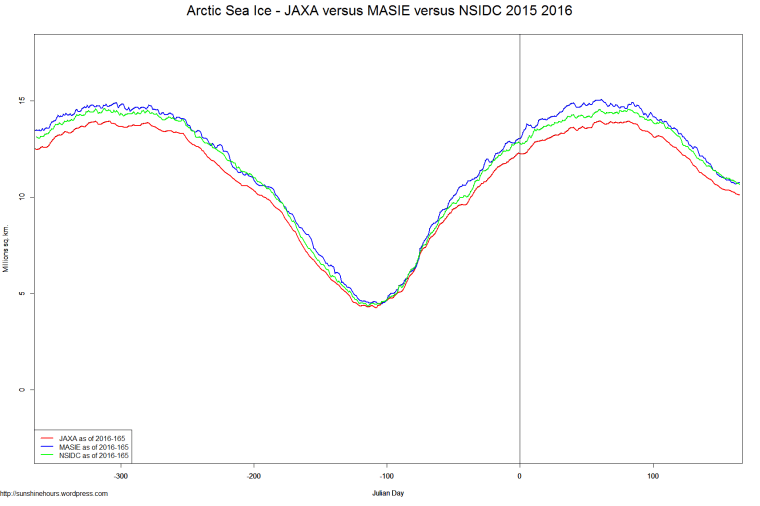
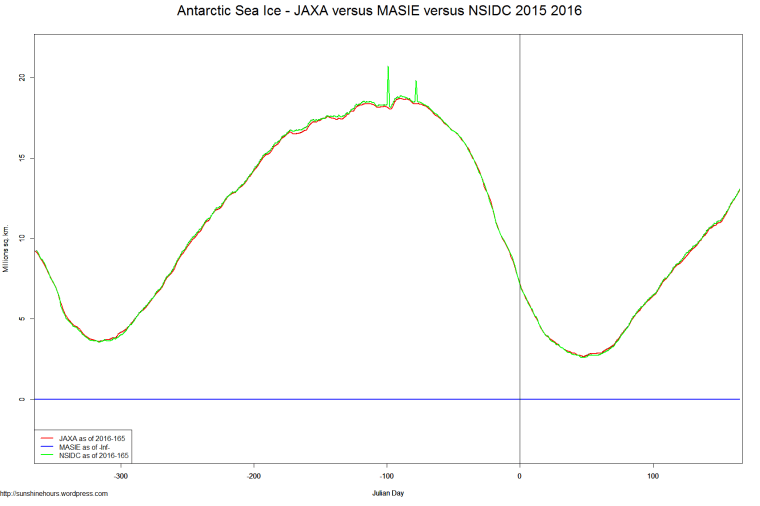
Now that NSIDC is publishing data again I thought I would post two graphs comparing JAXA MASIE and NSIDC.
I’m doing it for Arctic and Antarctic (but MASIE has no Antarctic data)
Normally in the Arctic JAXA and NSIDC are very close only at the minimum … but now they are very close.
And in the Antarctic they might as well be doing just one they overlap so much.

Figures from Enappsys, which monitors wholesale electricity market data, show the grid will have an even more difficult job keeping the lights on than last year, when it took new emergency measures for the first time.
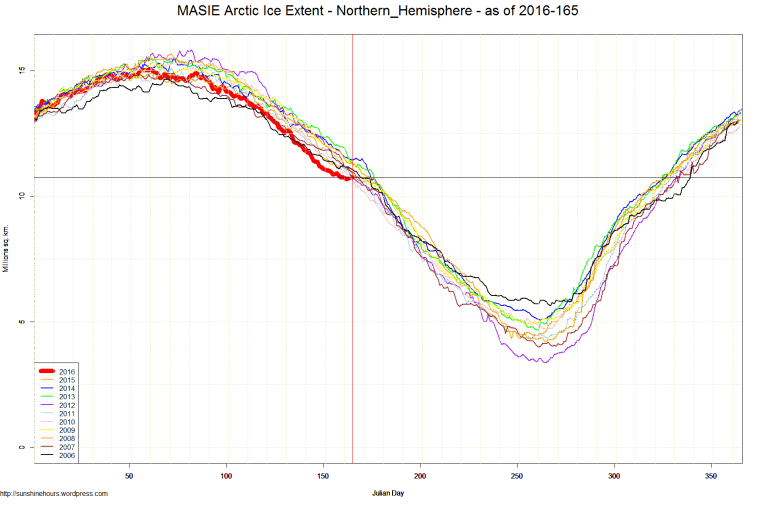
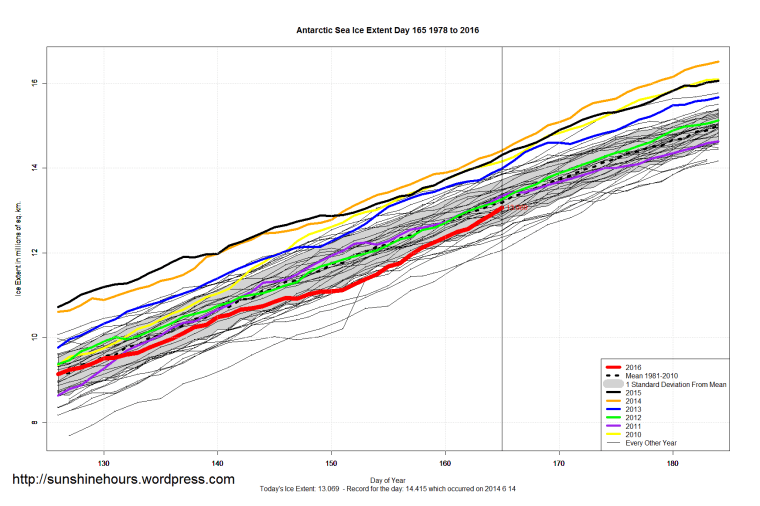
A couple of days ago I pointed out one of the other ice indexes (DMI) had now crossed over the 2012 track.
MASIE (see bottom graph) has actually gained ice the last couple of days and is above 2010,2011 and 2012.
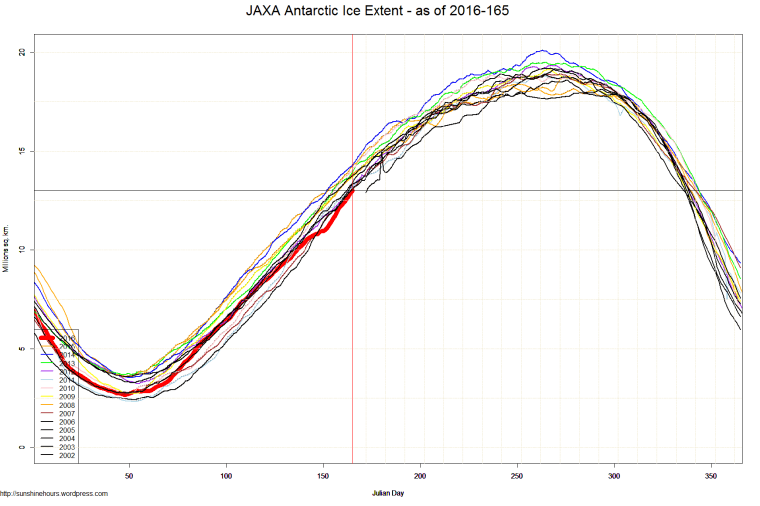
JAXA is still 100,000 sq km below 2012.
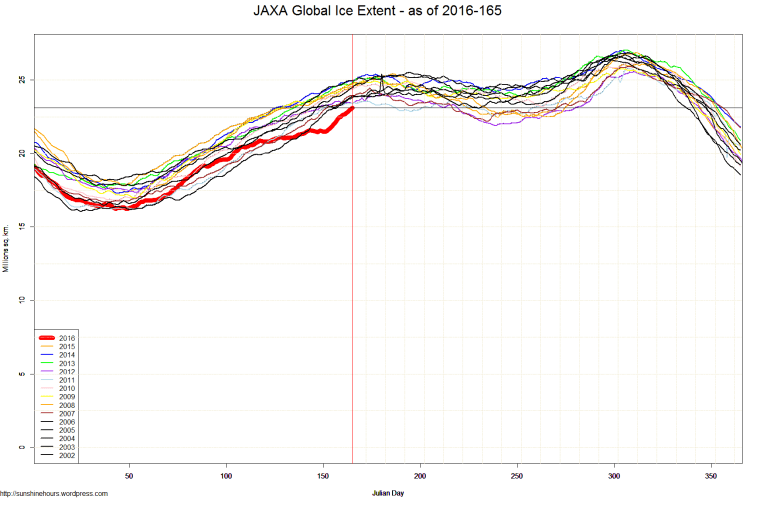
JAXA sea ice extent data from Japanese Aerospace Exploration Agency.
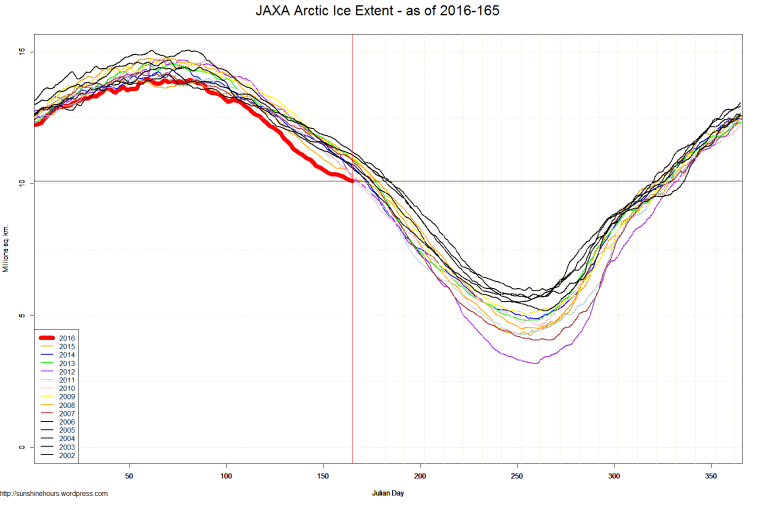
MASIE (Arctic only)