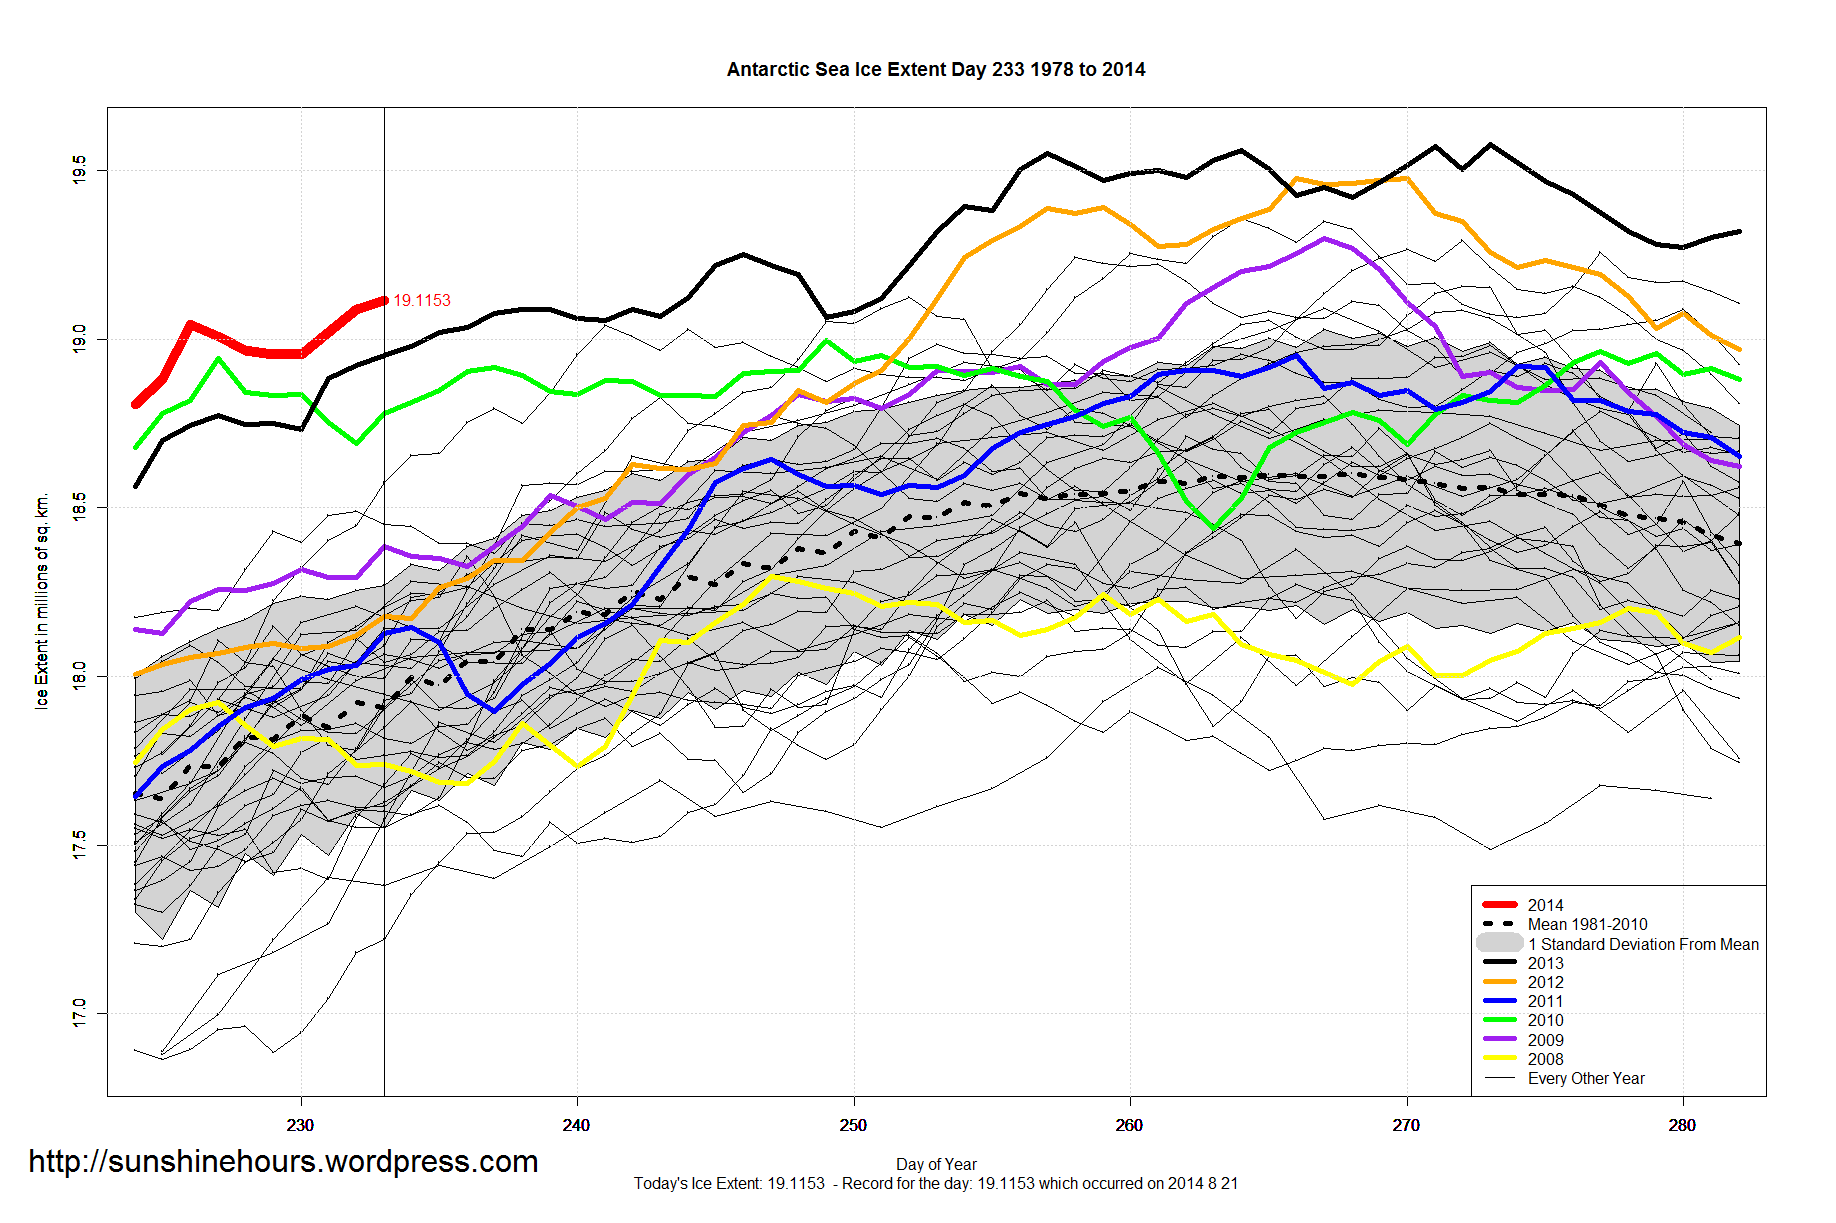
Antarctic Sea Ice Extent Aug 23 2014 – 1,156,000 sq km above the 1981-2010 mean. Data for Day 234. Data here.
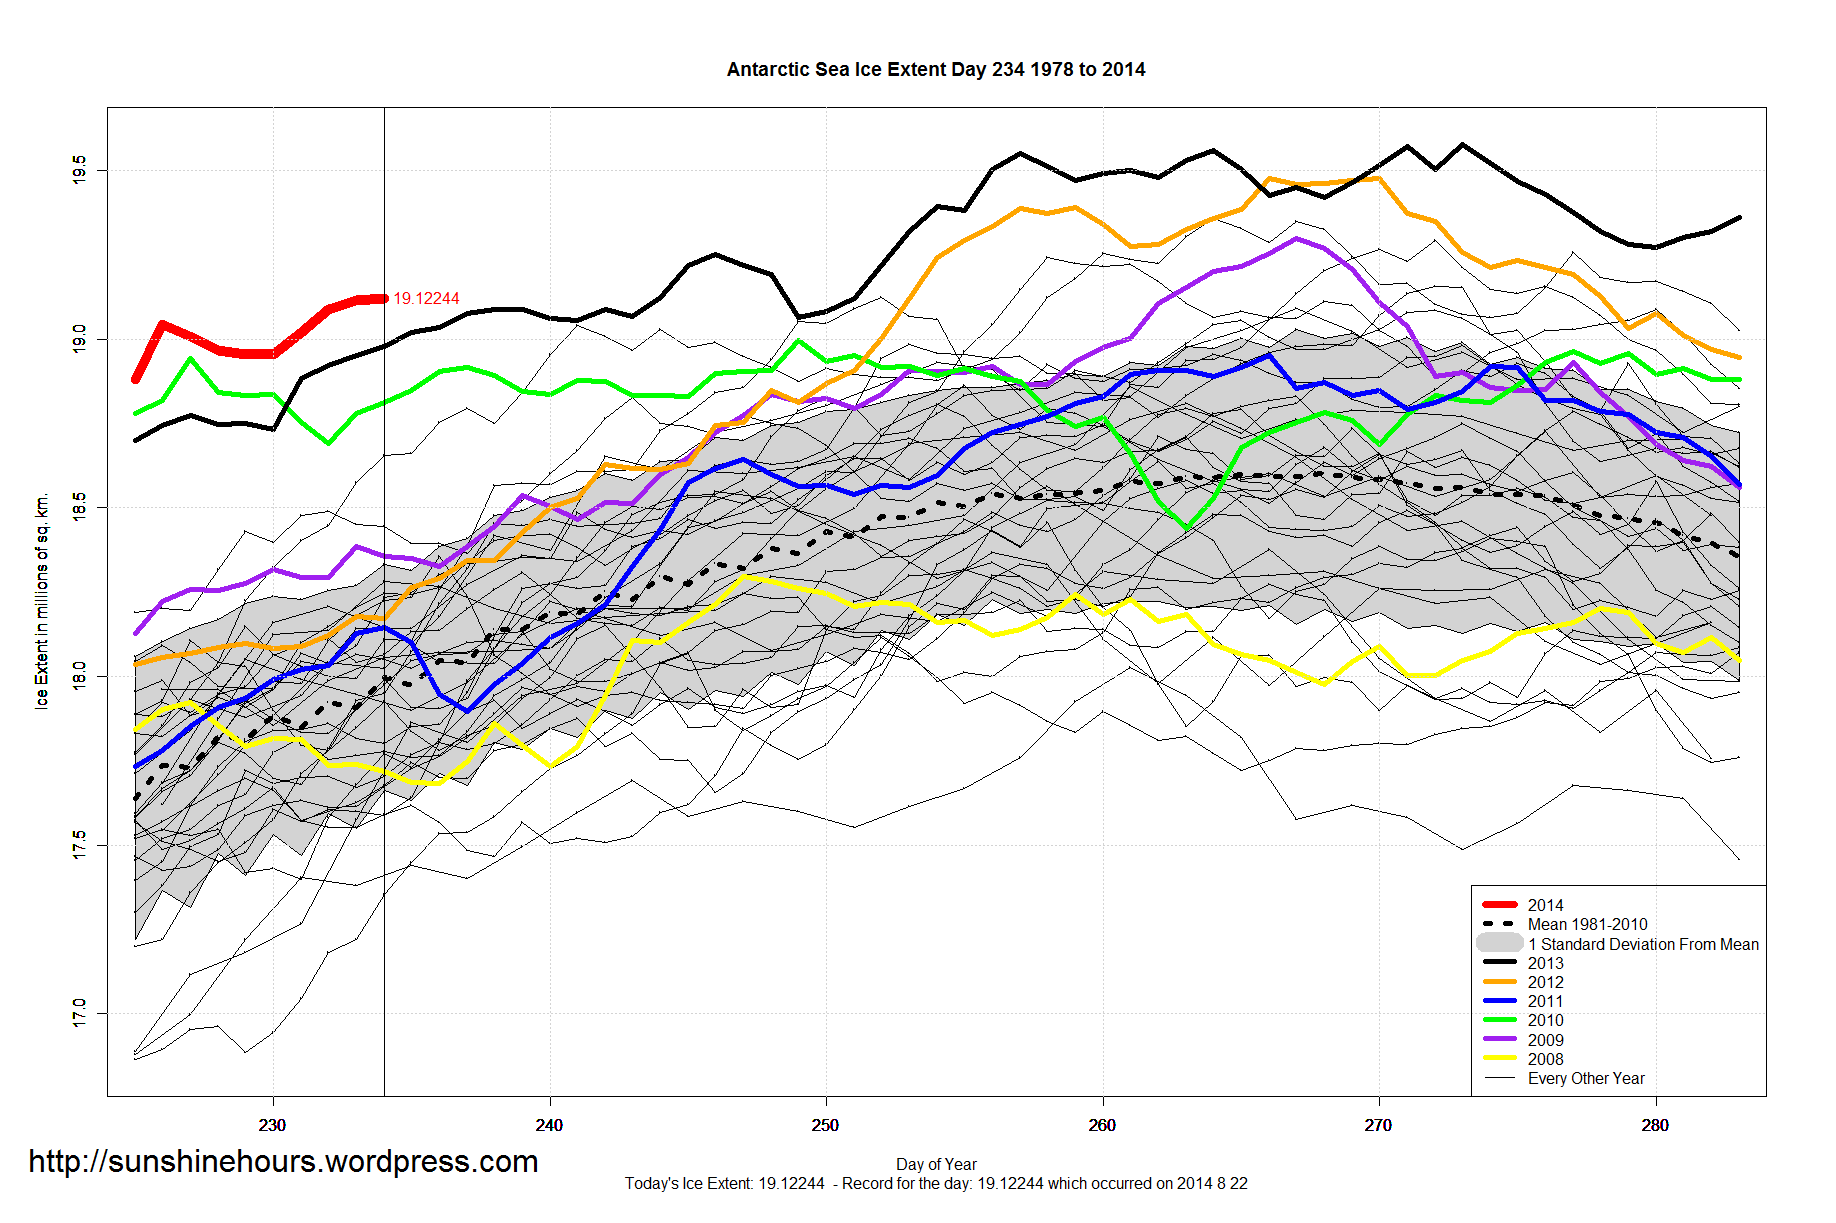

Antarctic Sea Ice Extent Aug 23 2014 – 1,156,000 sq km above the 1981-2010 mean. Data for Day 234. Data here.
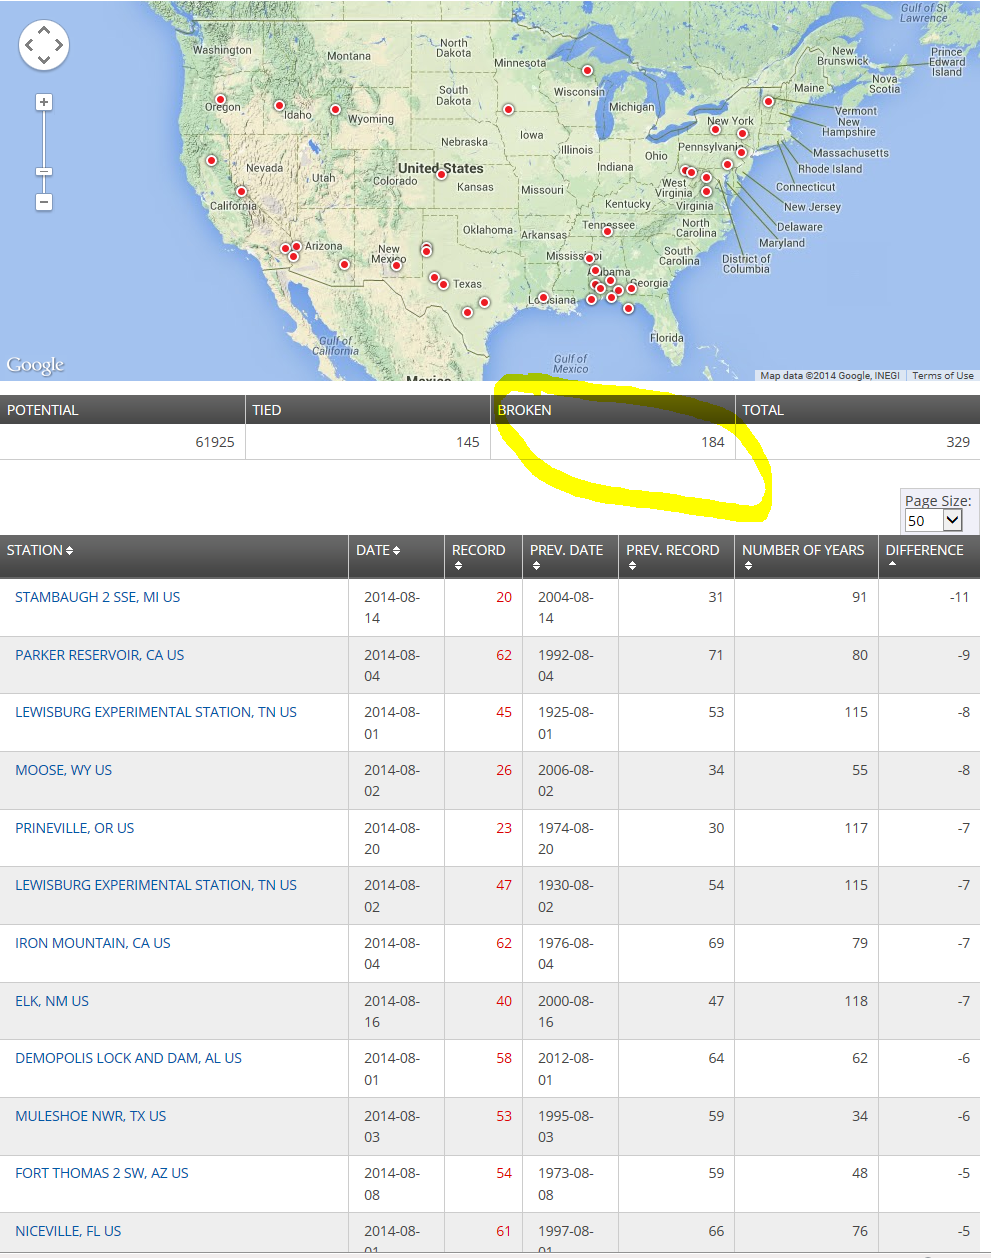
184 Low Min Records Broken From Aug 1 to Aug 21 according to the NOAA.
Below is a screenshot showing location and the biggest difference between old record and new record.
Note that Stambaugh MI has 91 years of data. And the record was demolished by 11F.
20F as a low on Aug 14. Wow.
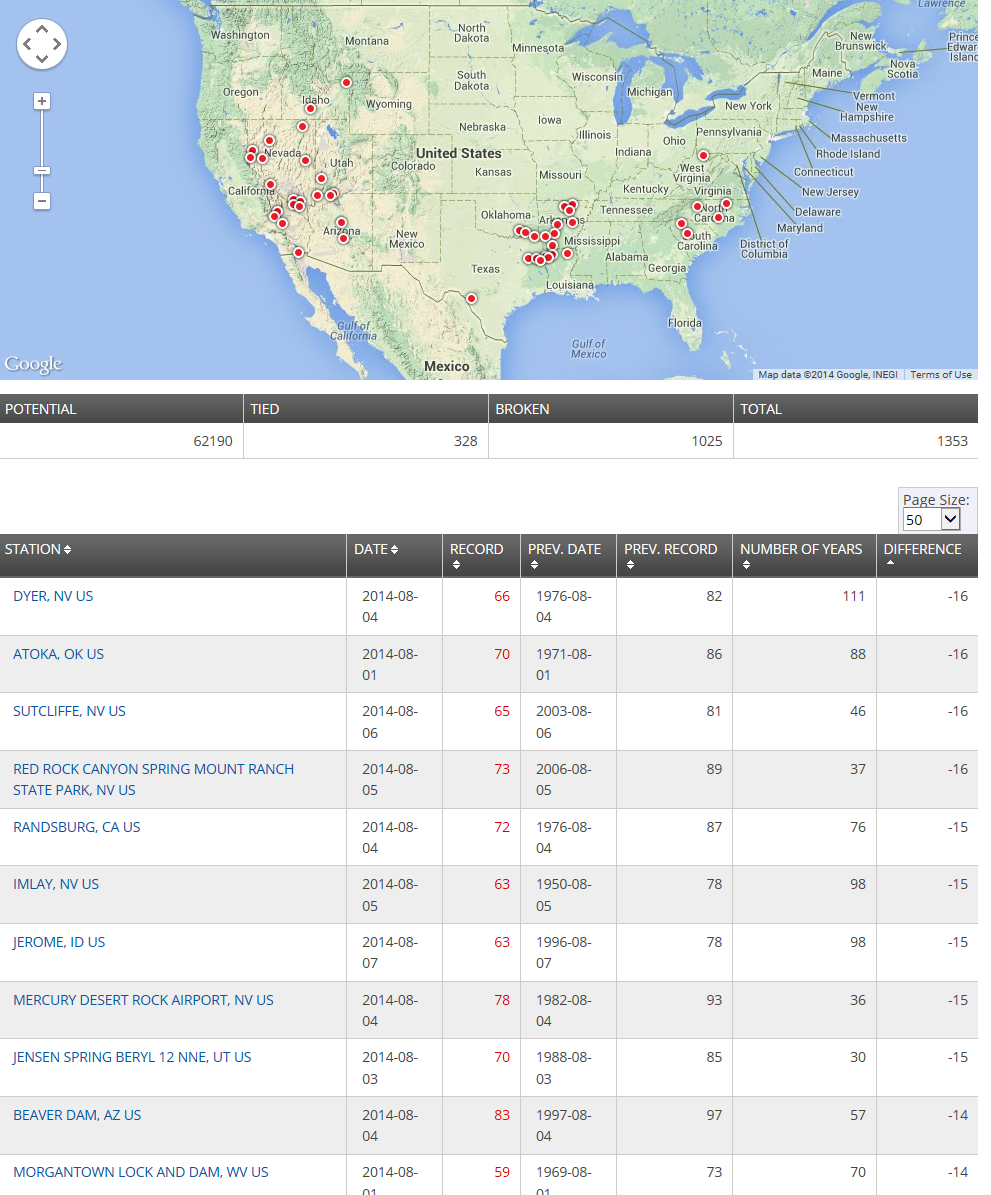
1025 Low Max Records Broken From Aug 1 to Aug 21 according to the NOAA.
A “Low Max” means that the maximum temperatures for the day was the lowest it has ever been.
This indicates daytime cooling.
Below is a screenshot showing location and the biggest difference between old record and new record.
Note that Dyer NV has 111 years of data. And the record was smashed by 16F.
Arctic Sea Ice Extent Aug 23 2014 – -1,071,000 sq km below the 1981-2010 mean. Data for Day 234. Data here.
A 39,000 sq km gain. The second gain in 4 days,
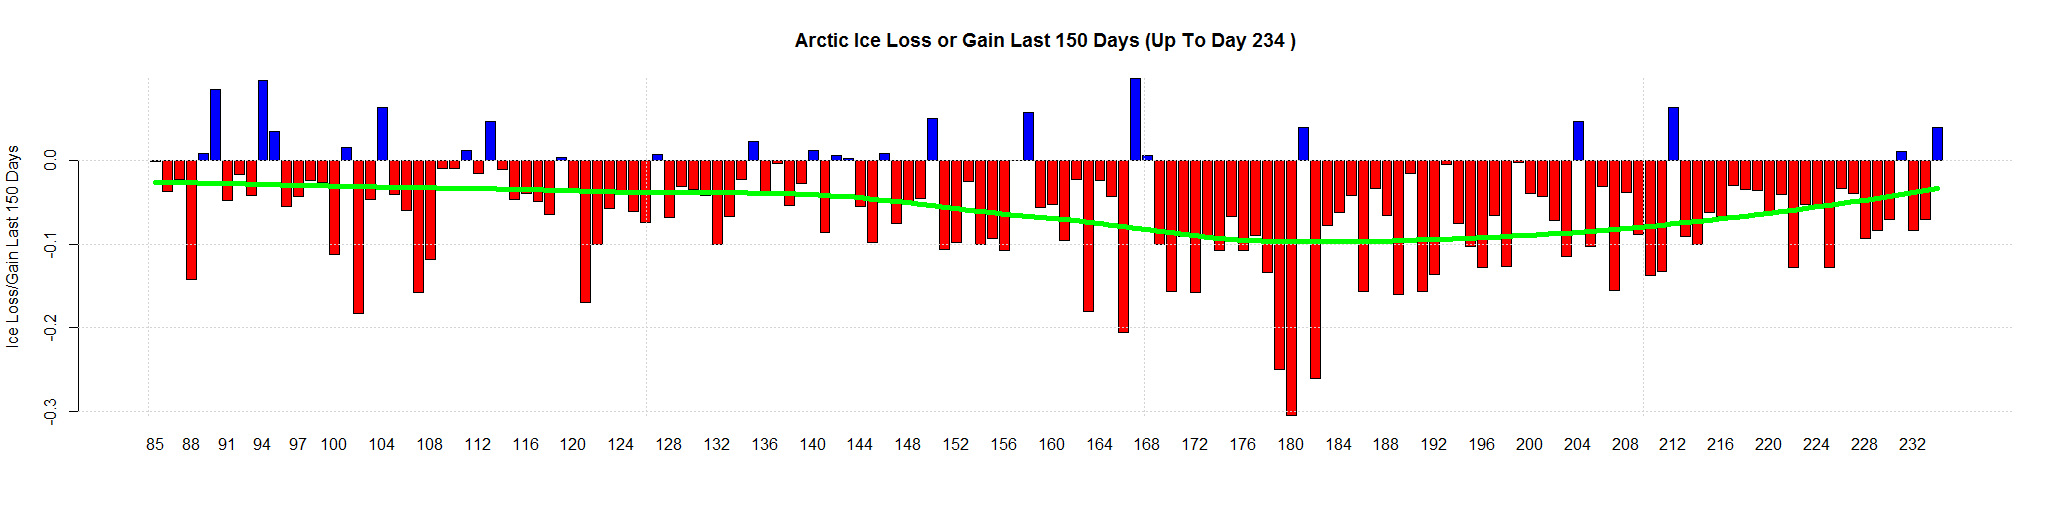
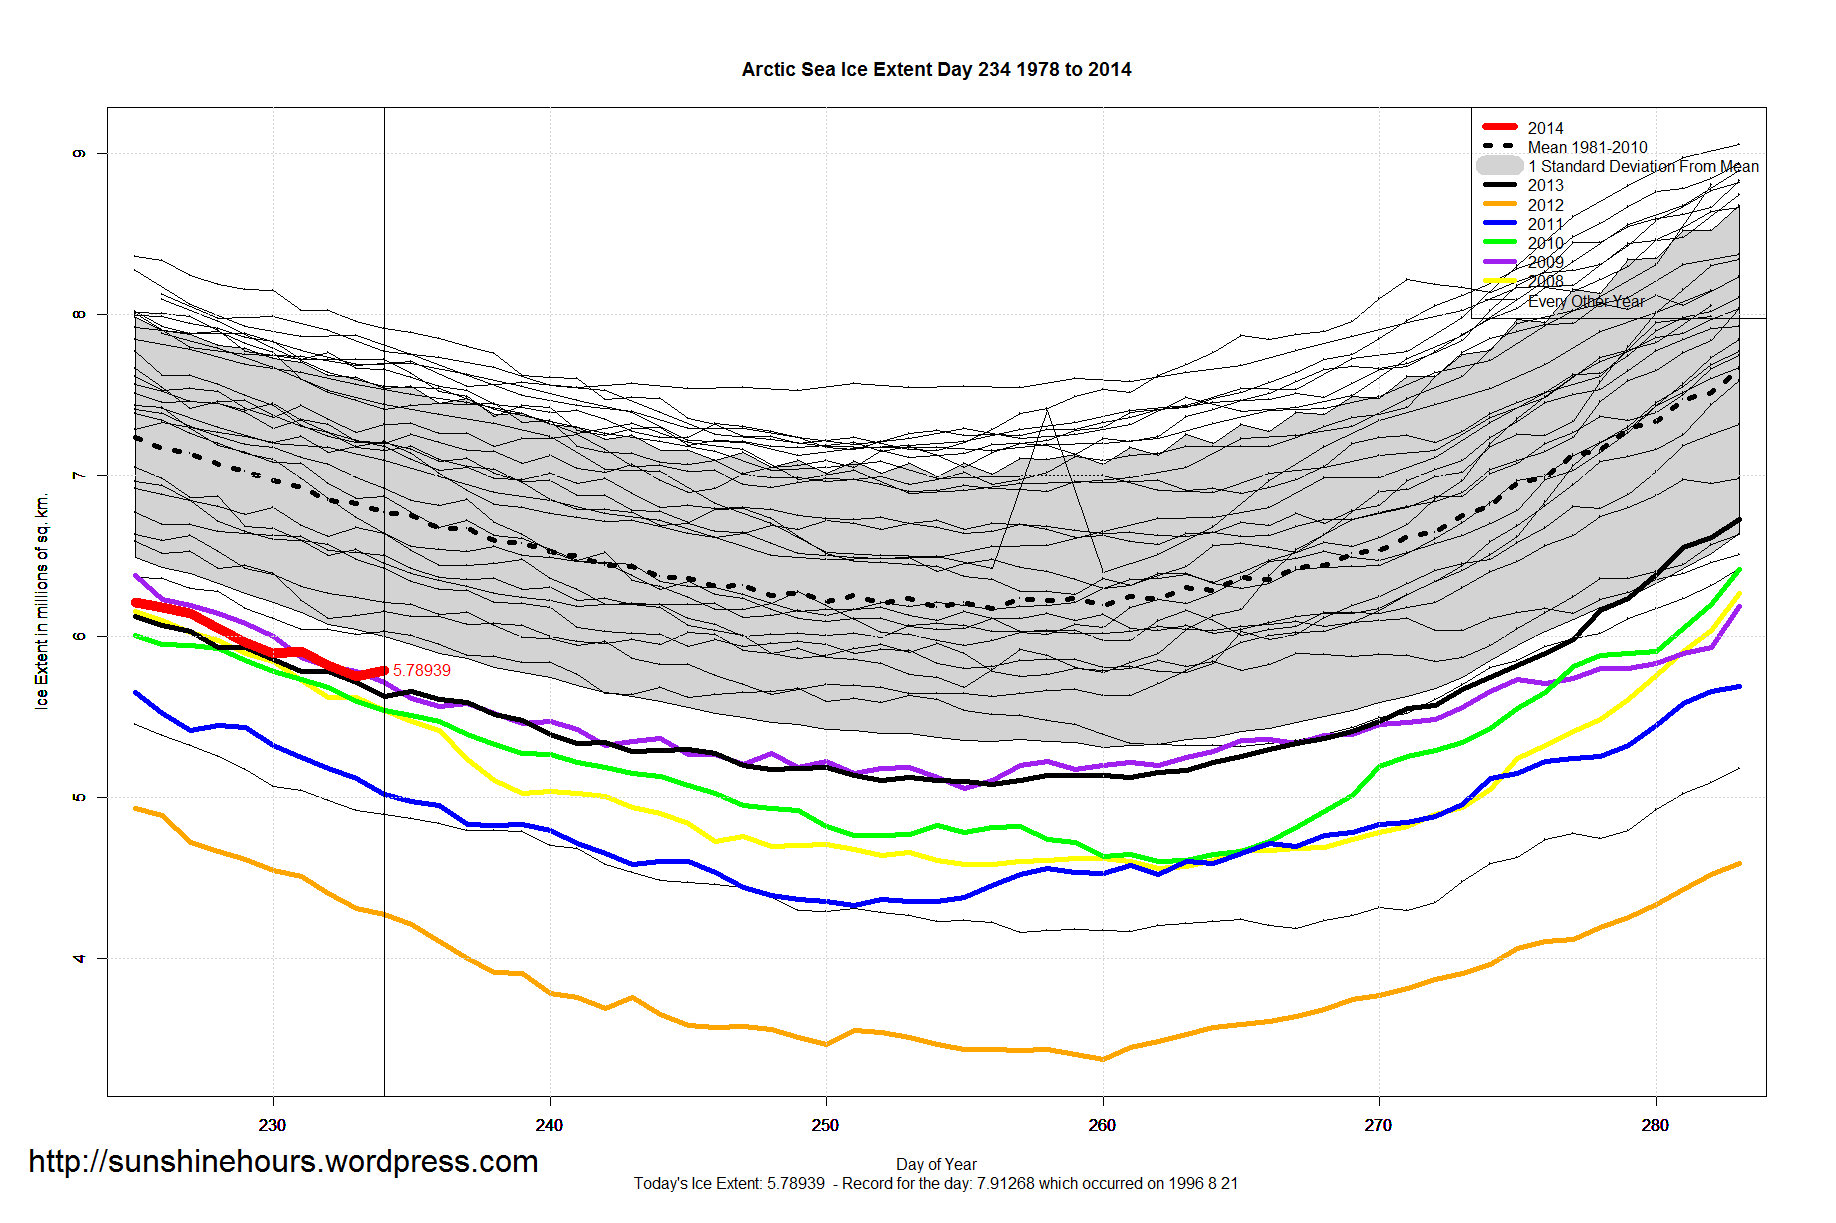

NOTE: The data from NSIDC has a Missing column that is usually 0. Today it is 0.00054.
However, NSIDC did publish a new set of data several hours after I did my initial post. Previous post here.
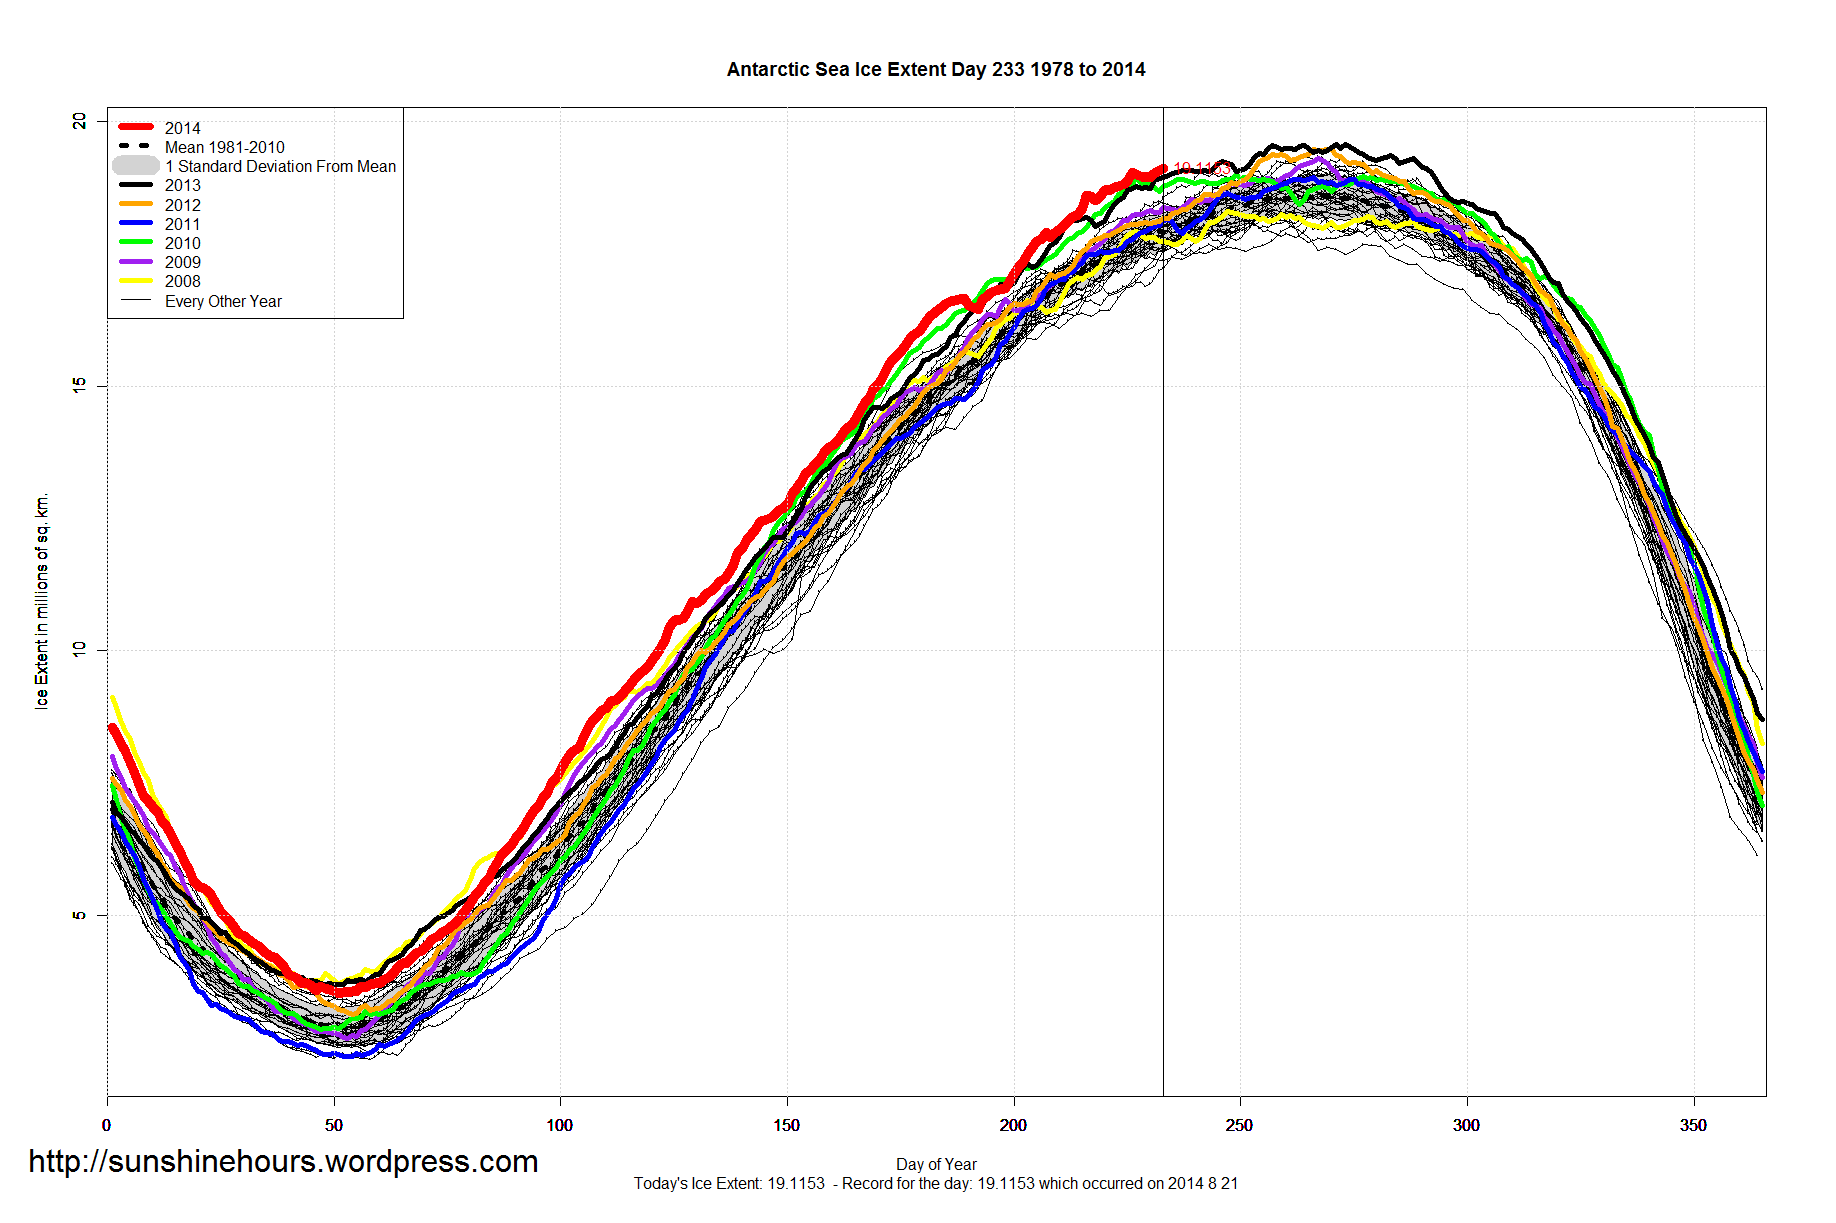
Antarctic Sea Ice Extent Aug 22 2014 – 1,189,000 sq km above the 1981-2010 mean. Data for Day 233. Data here.
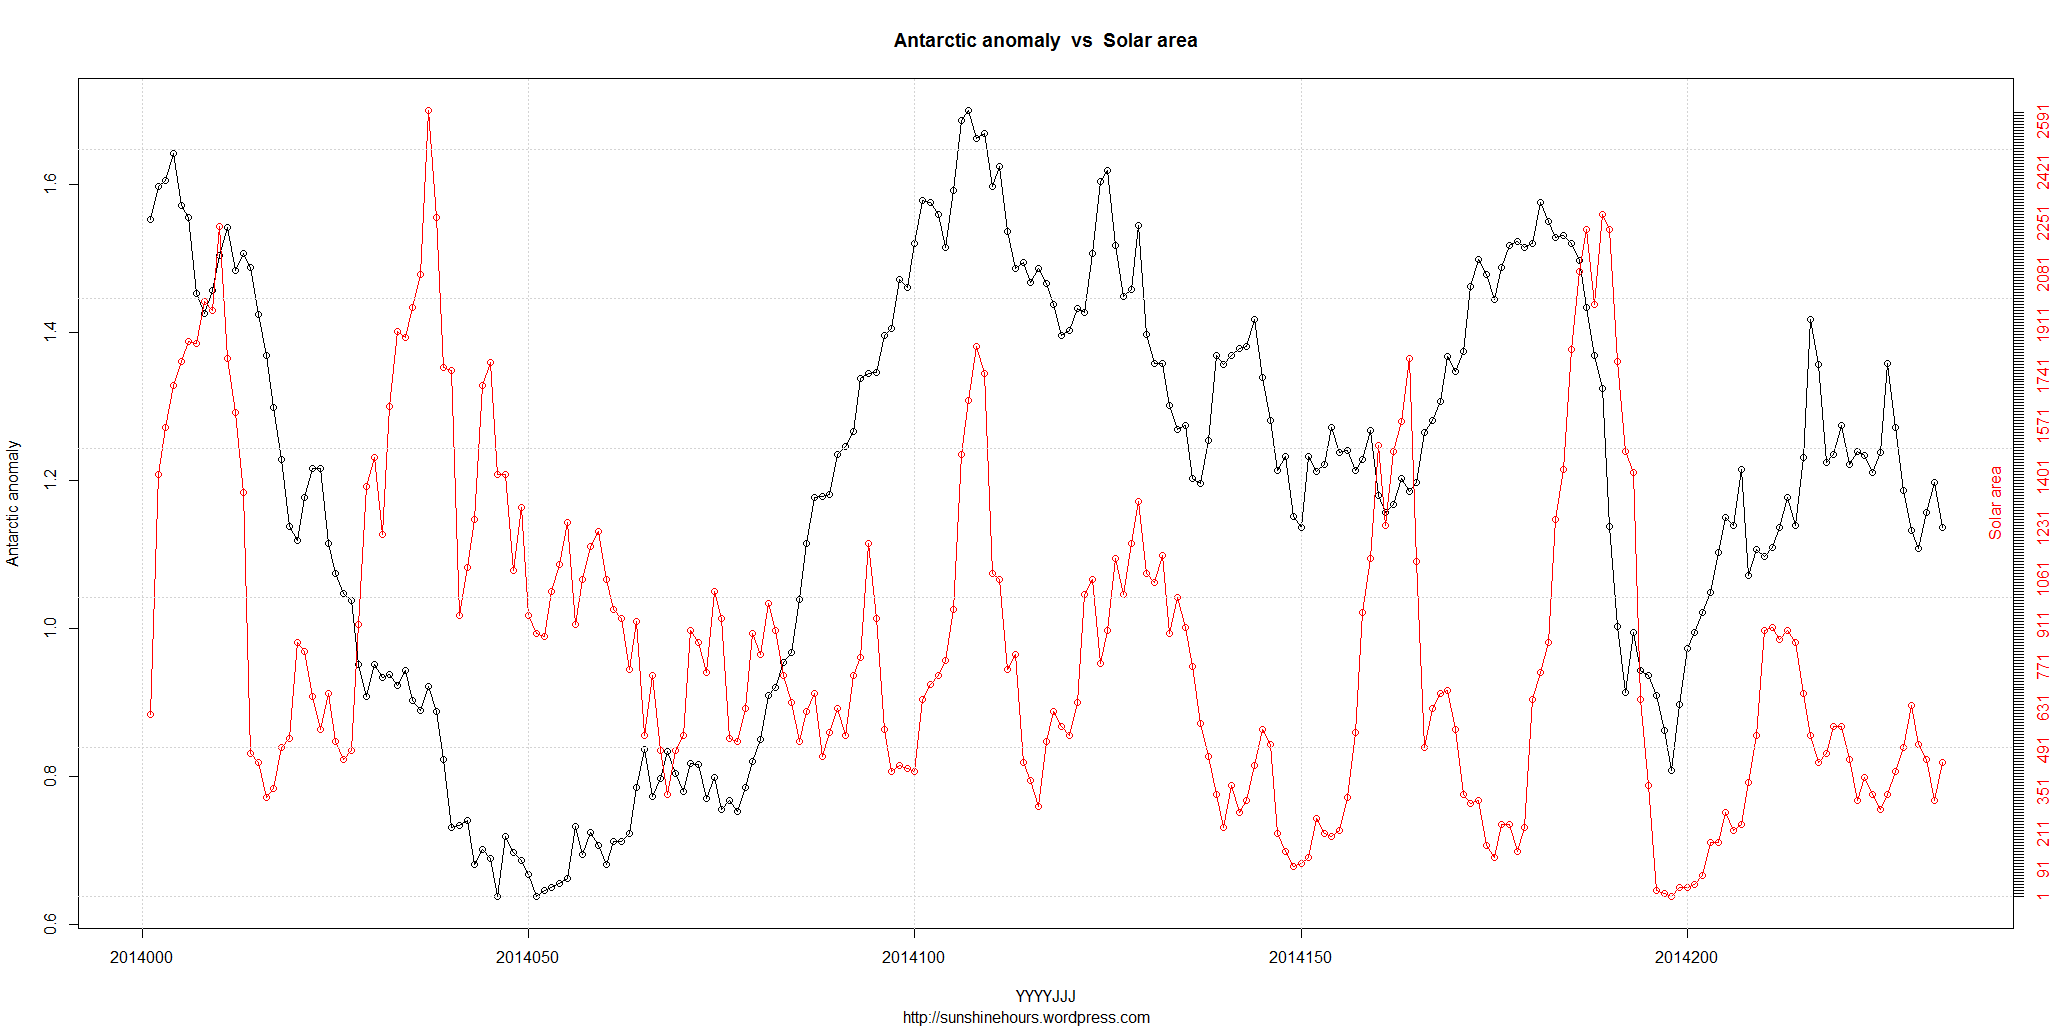
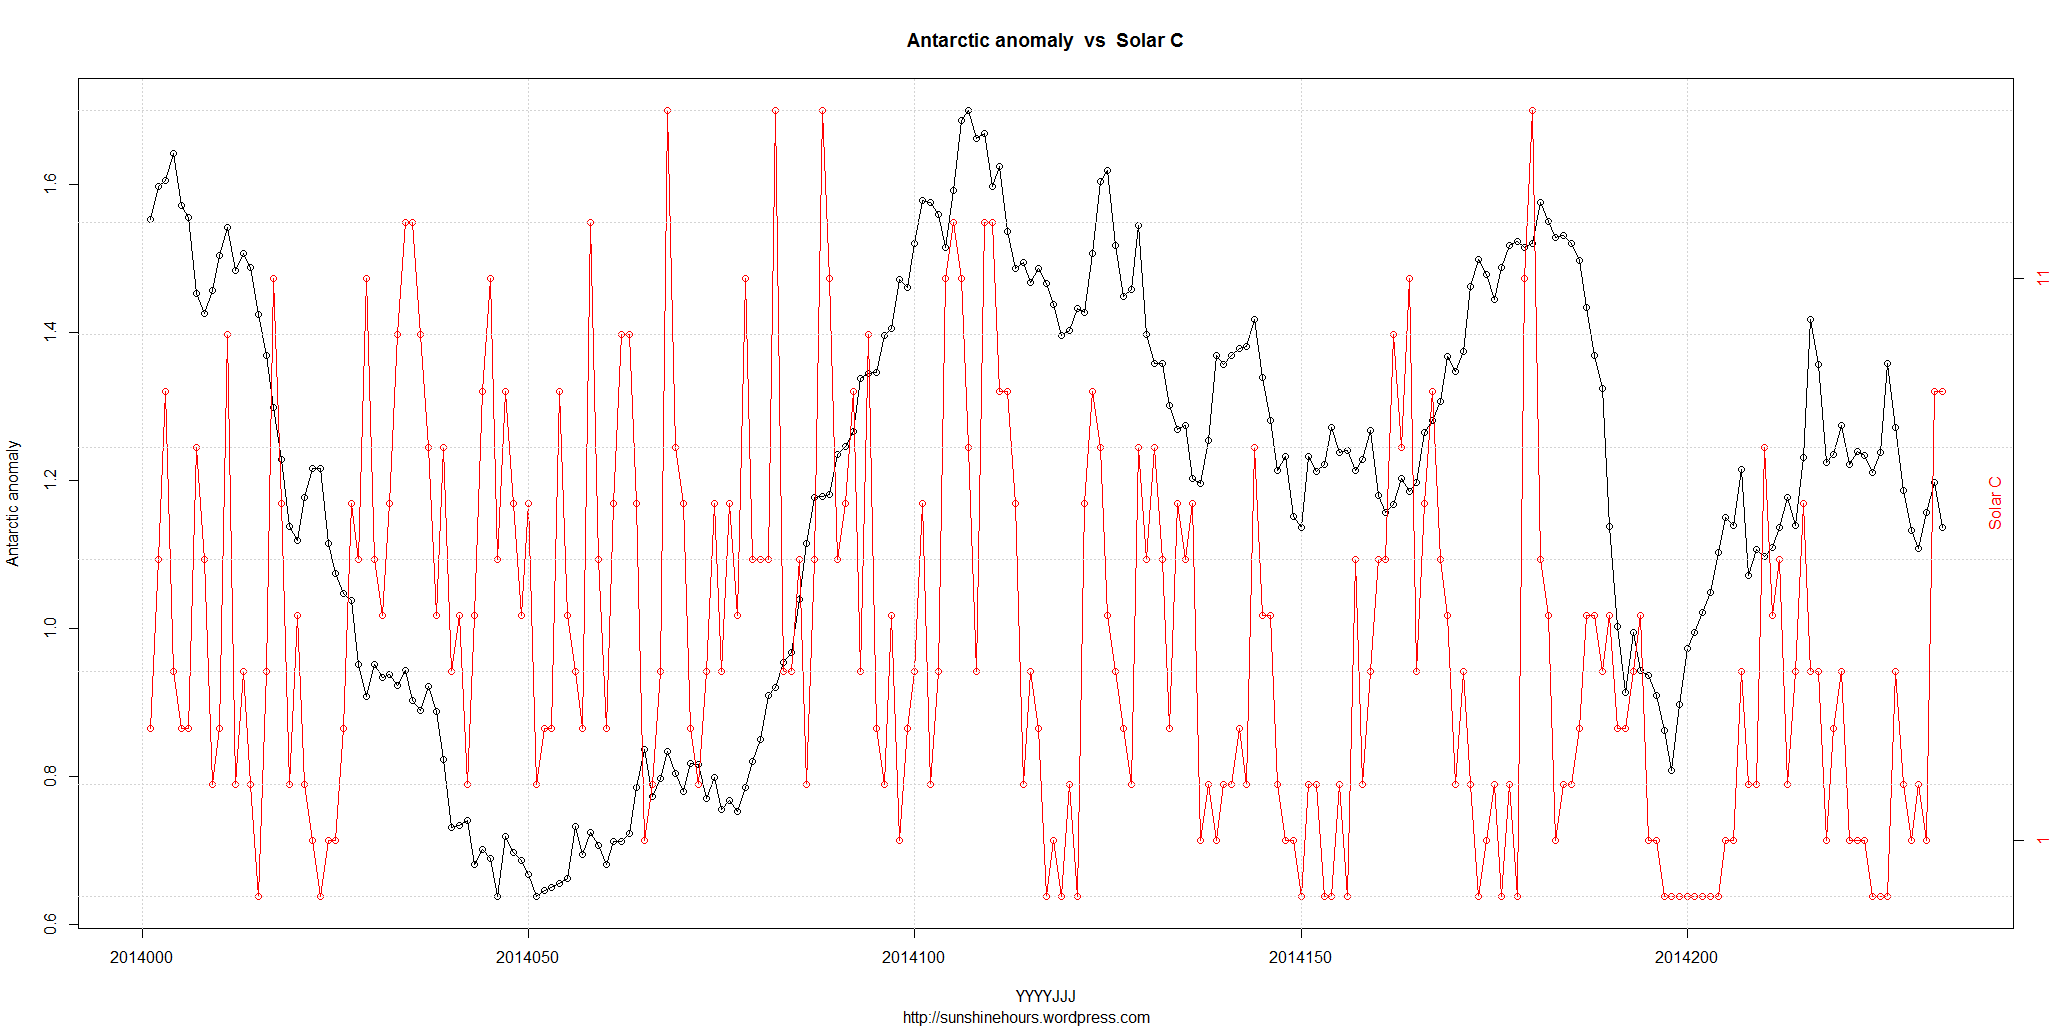
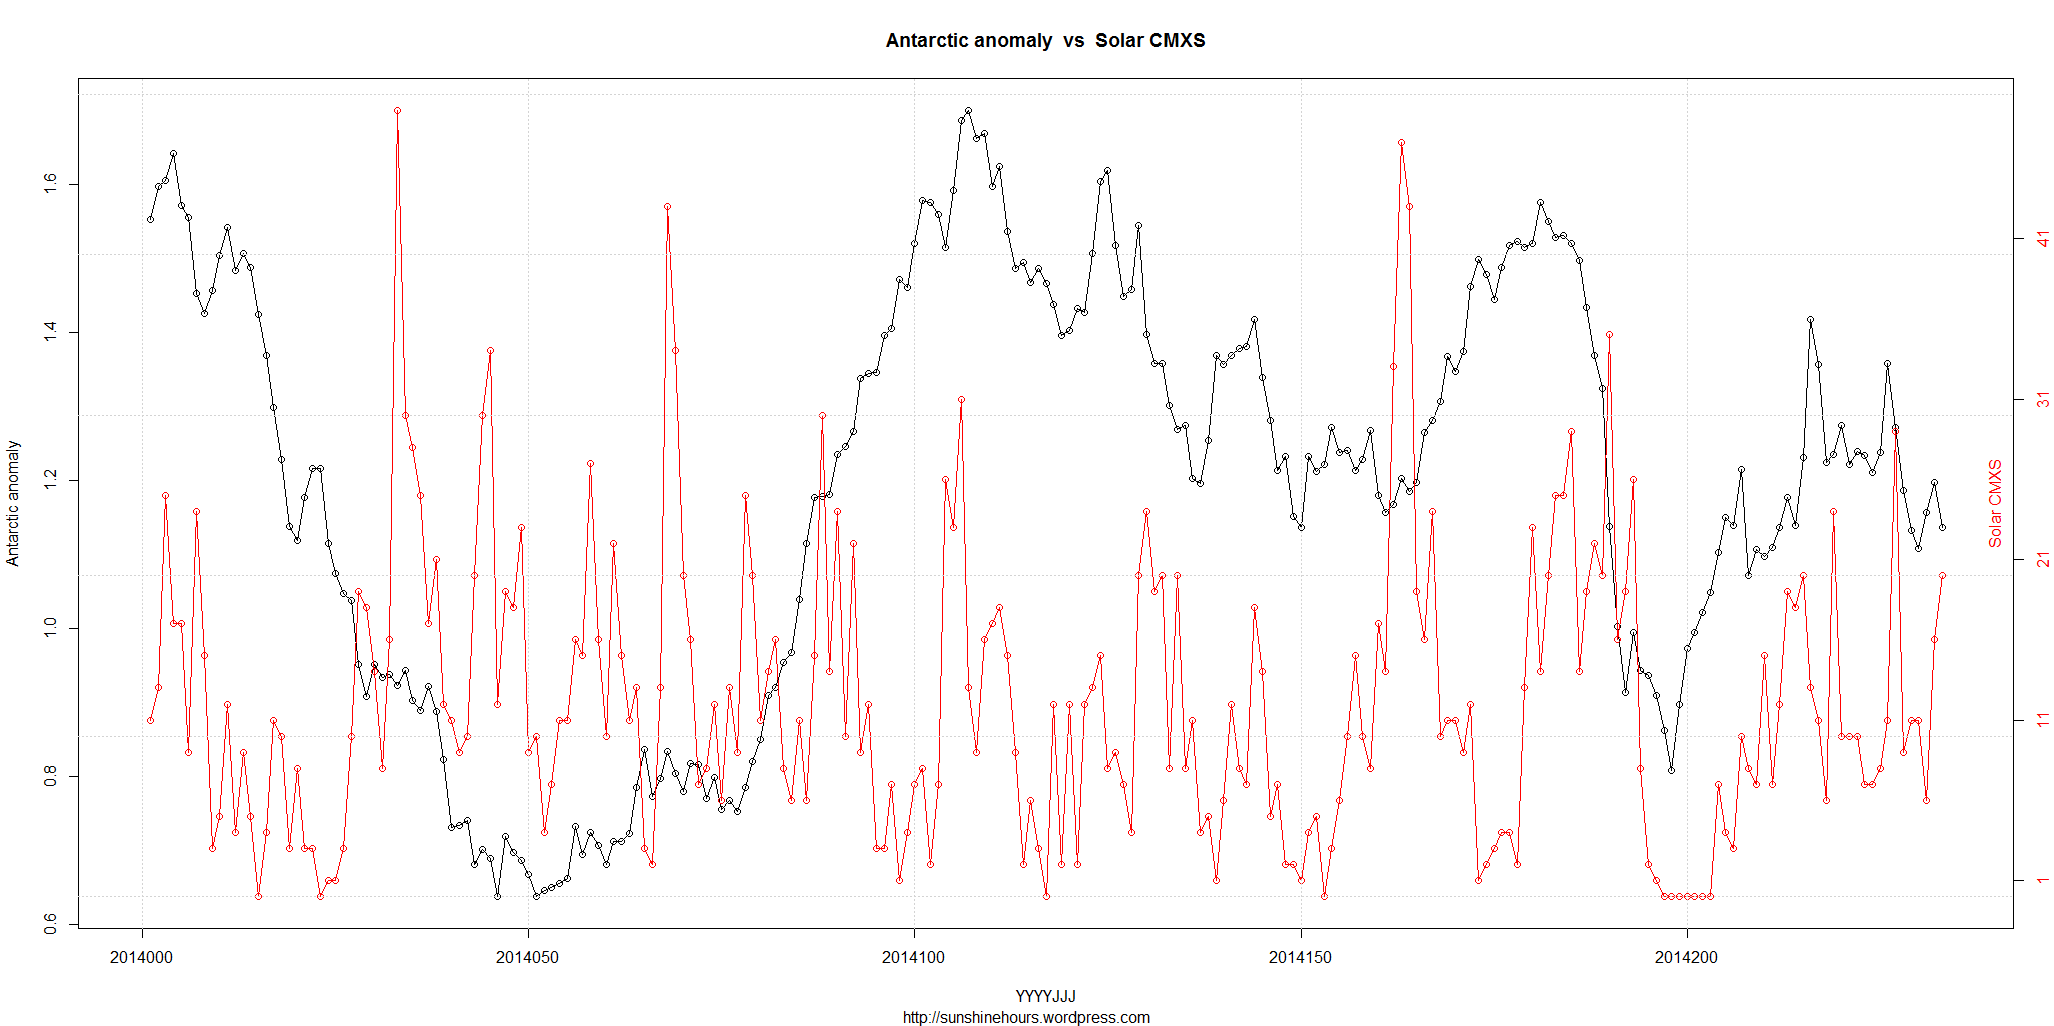
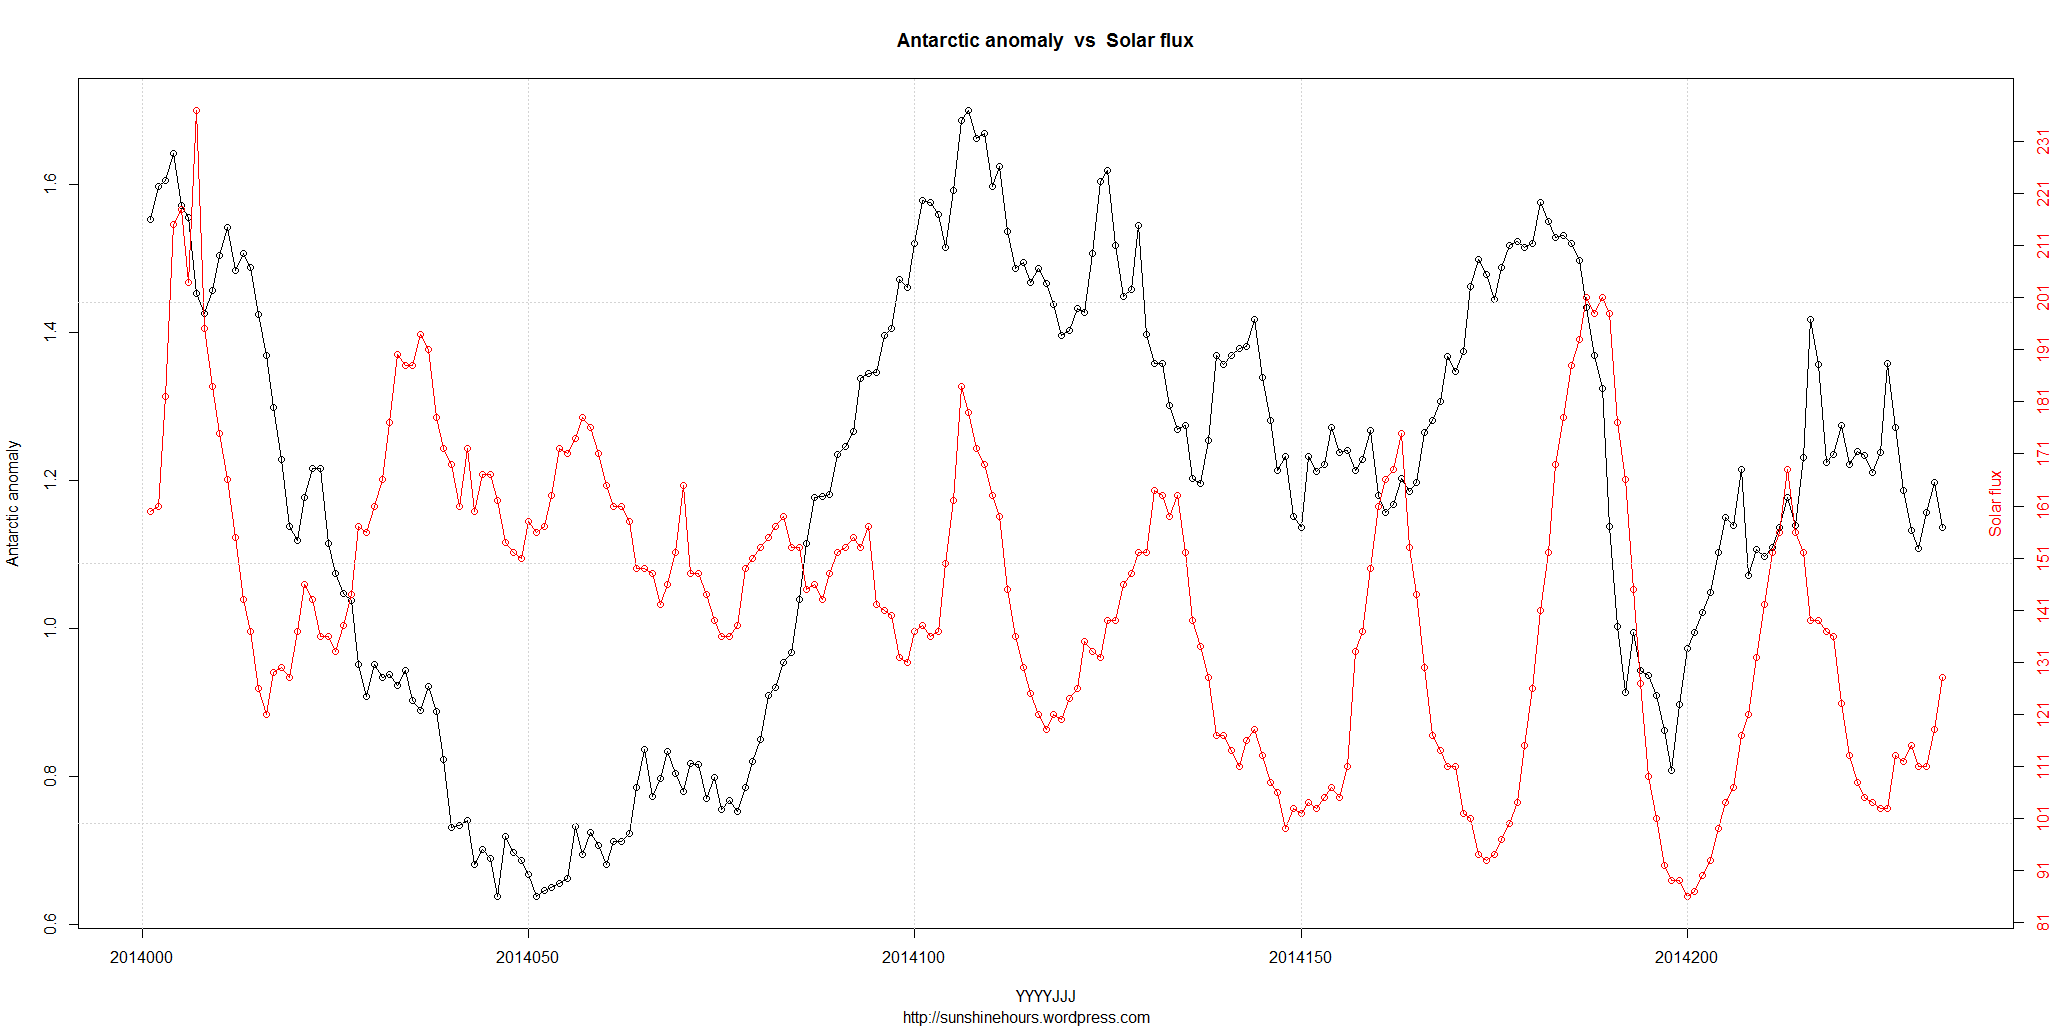
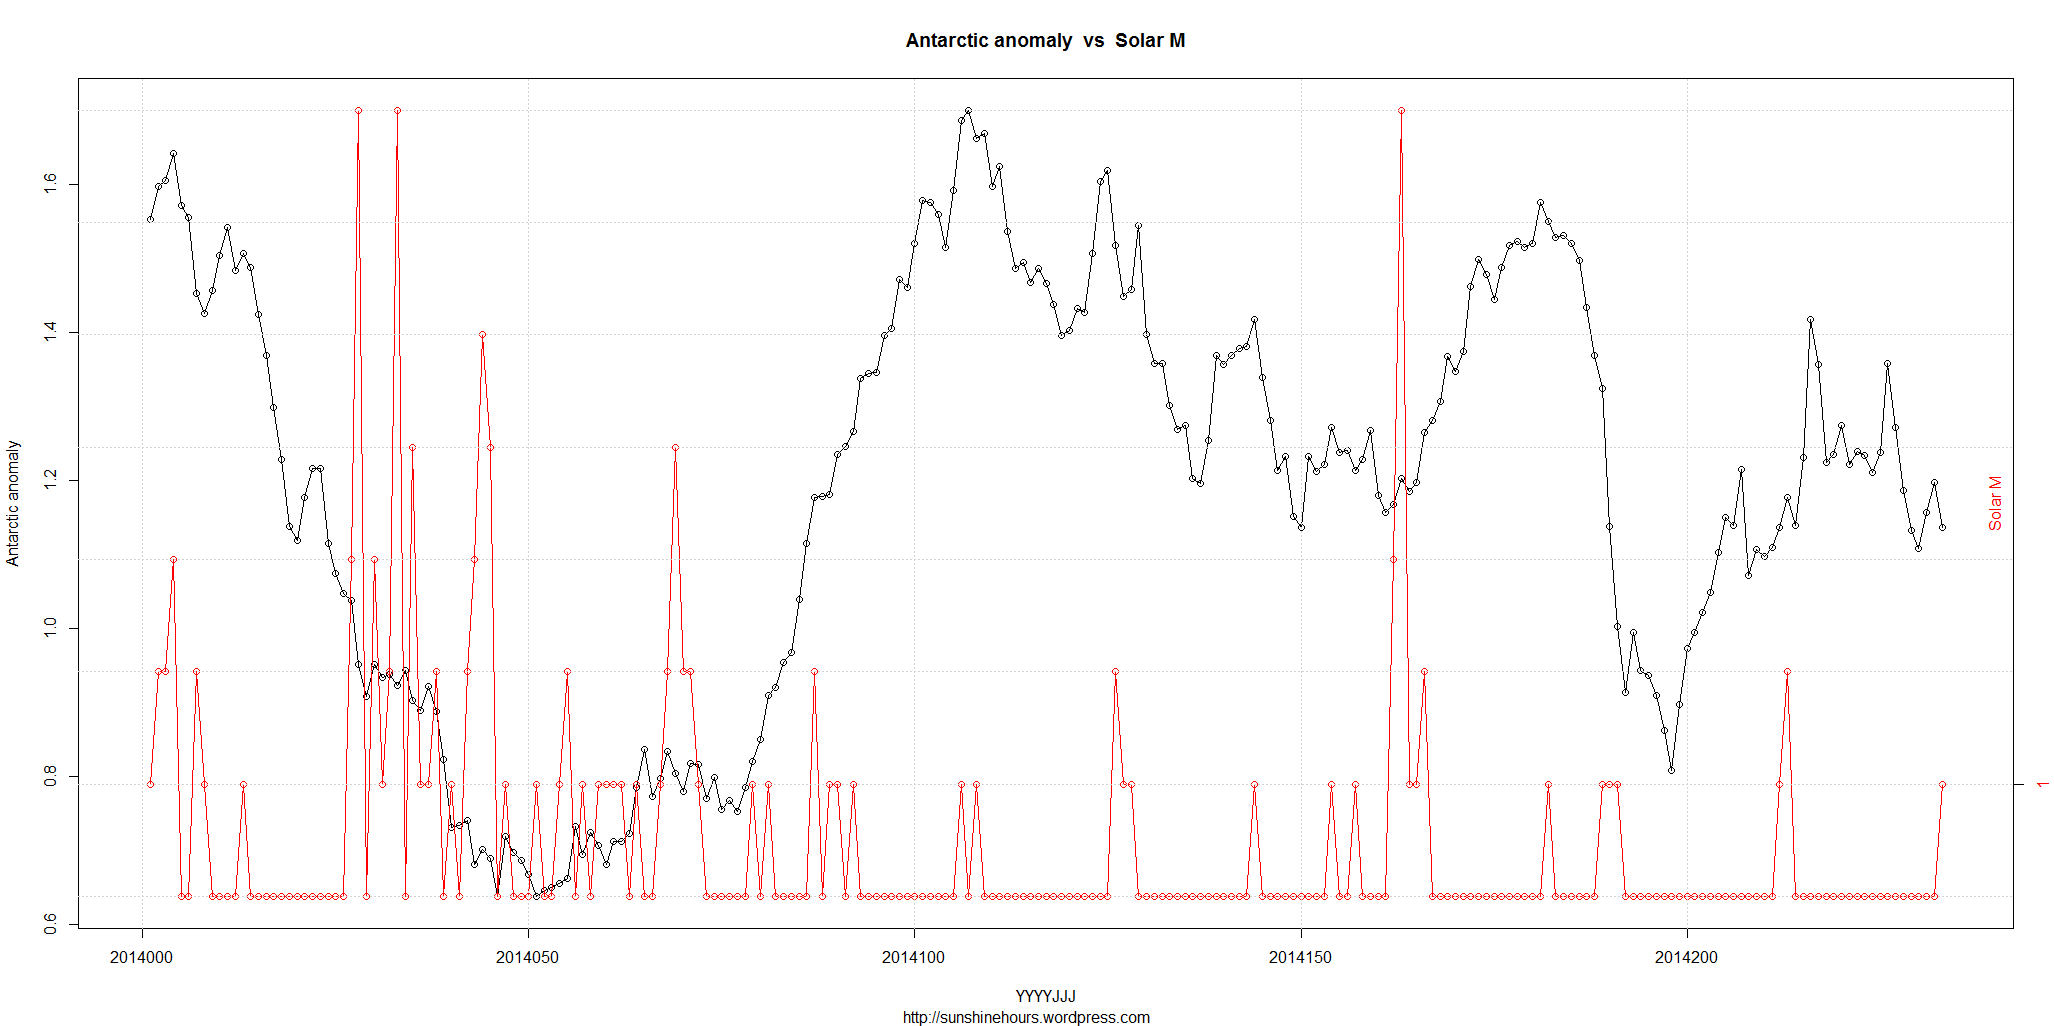
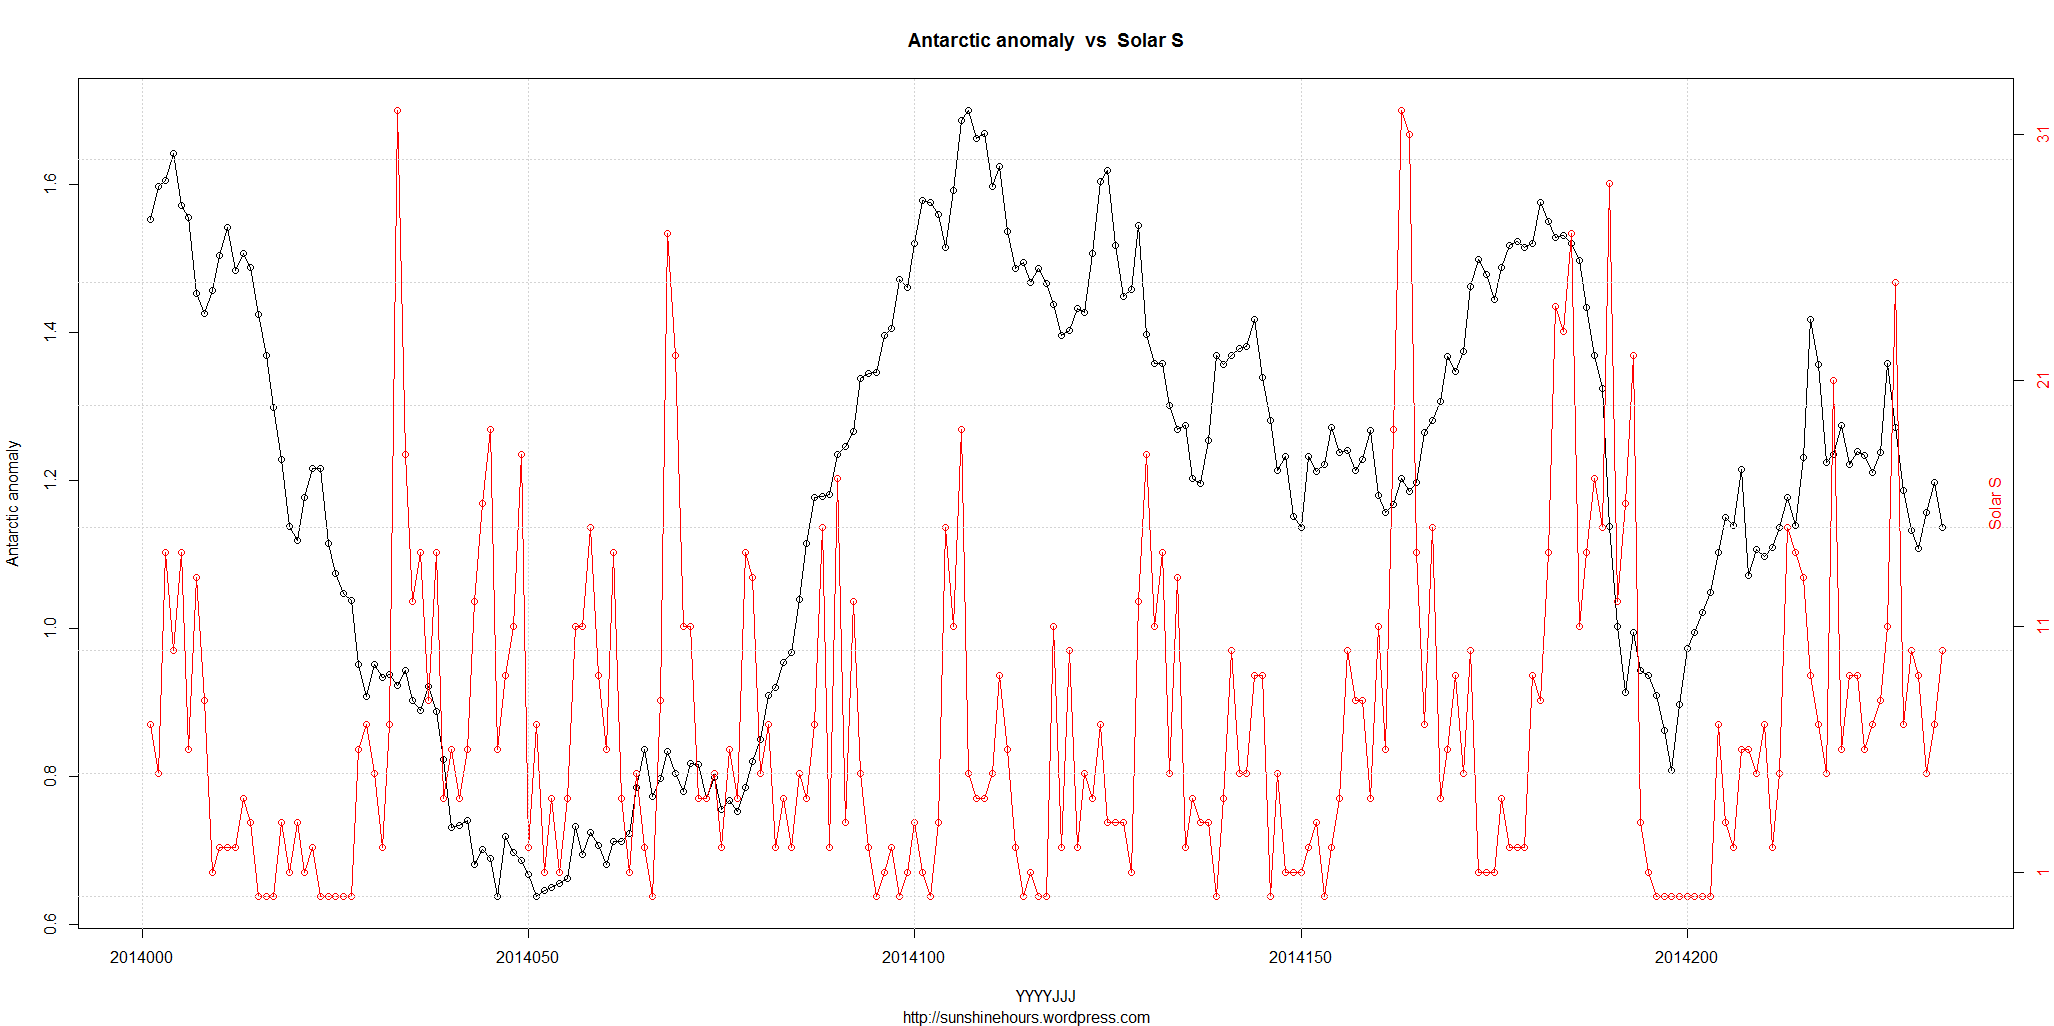
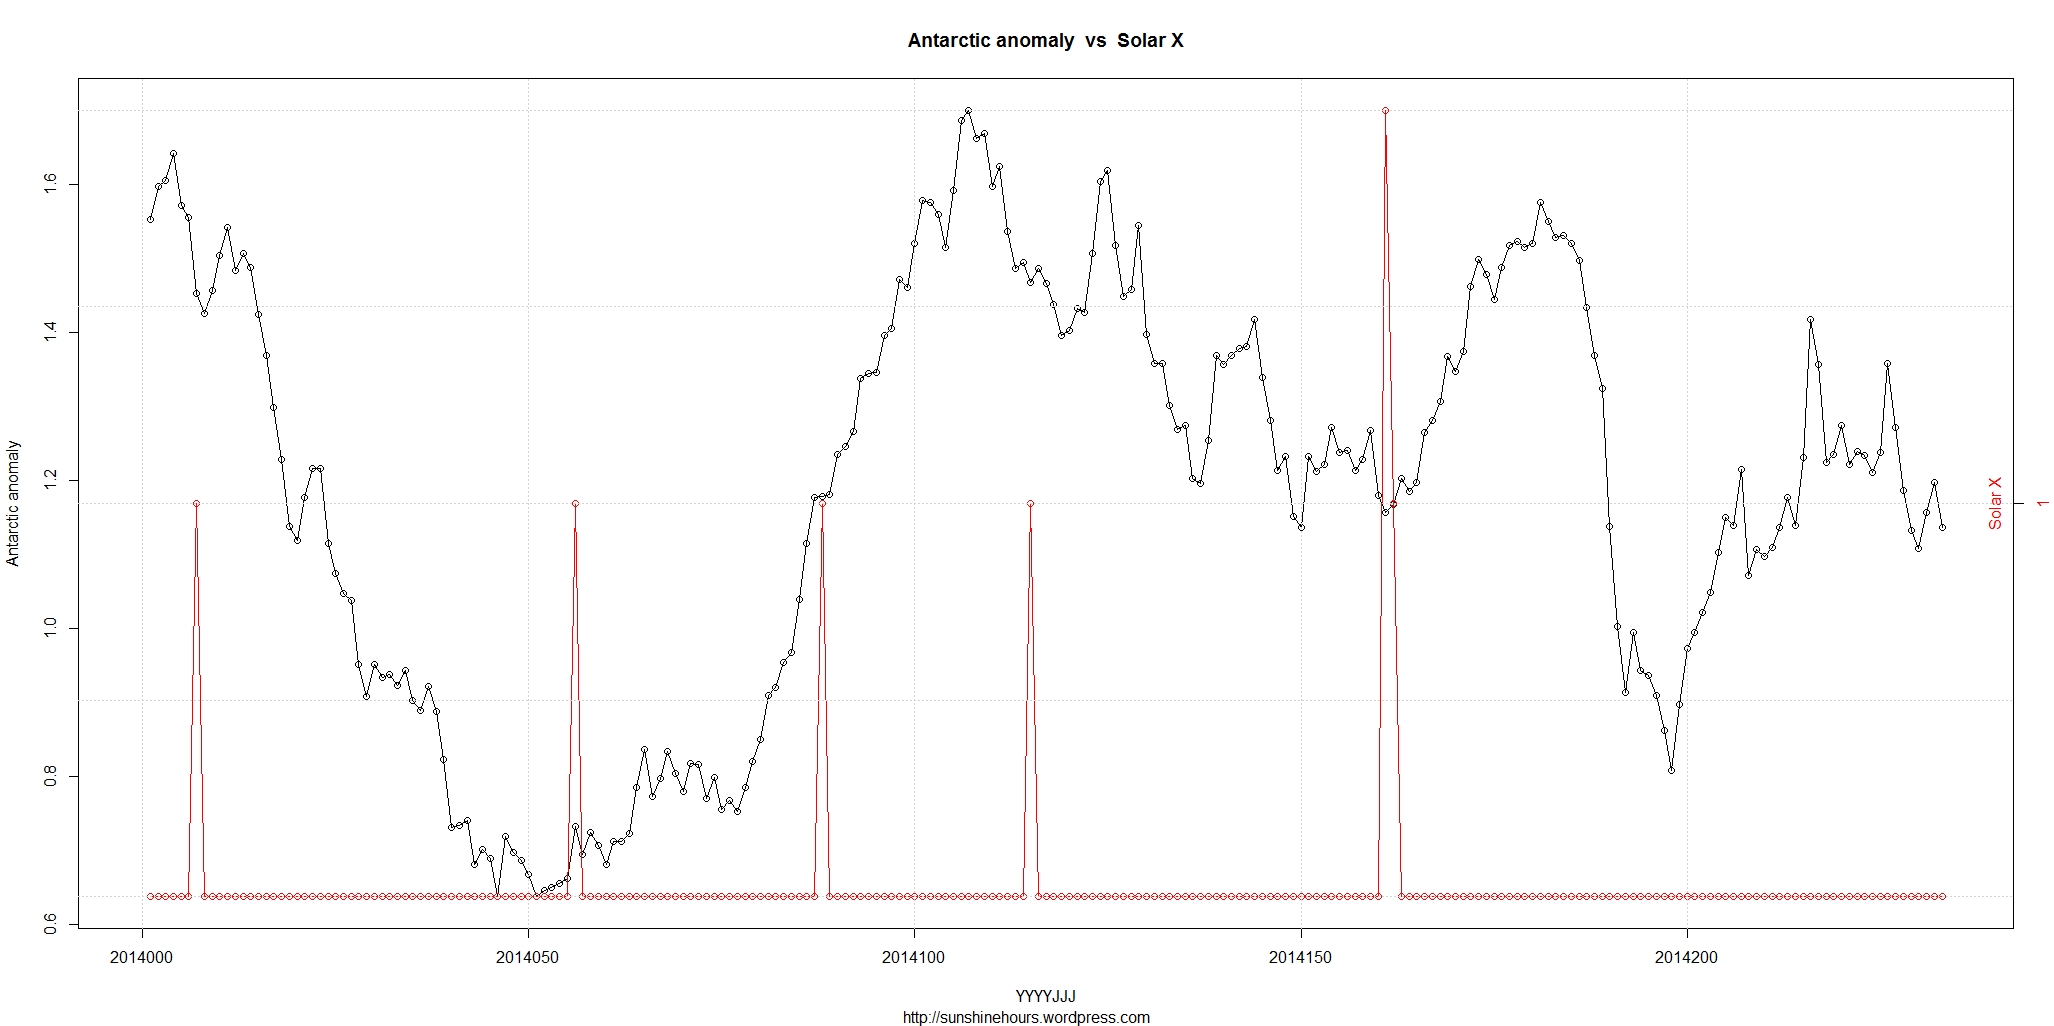
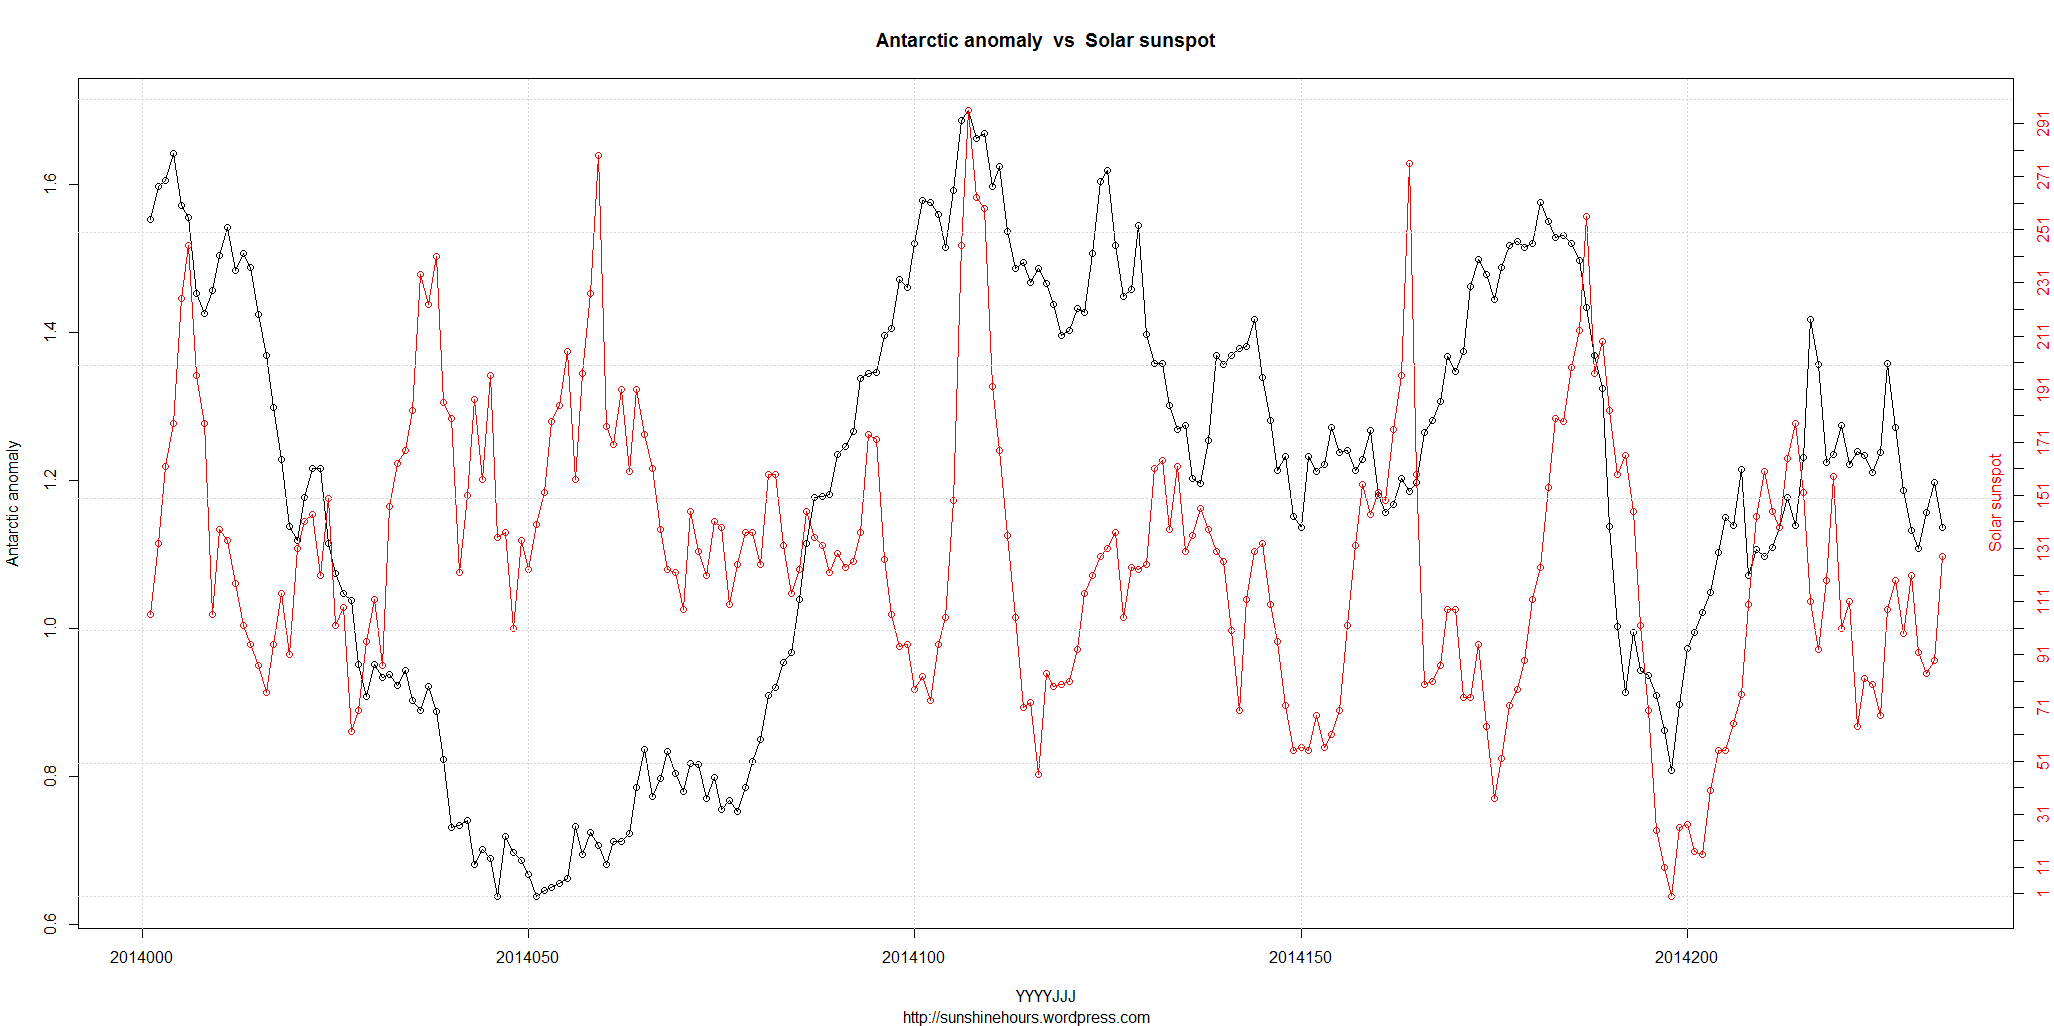
A request. (I don’t usually do requests)
Solar data from here. I graphed the highlighted items.
#                Quarterly Daily Solar Data
#
#                         Sunspot       Stanford GOES15
#           Radio  SESC     Area          Solar  X-Ray  ------ Flares ------
#           Flux  Sunspot  10E-6   New     Mean  Bkgd    X-Ray      Optical
#  Date     10.7cm Number  Hemis. Regions Field  Flux   C  M  X  S  1  2  3
#---------------------------------------------------------------------------
2014 07 01  152    154      850      1    -999   B9.6   5  1  0 14  1  0  0
Anomaly means the difference from 1981-2010 average. CMXS just means the number of C,M,X and S class flares added together.
Discuss.
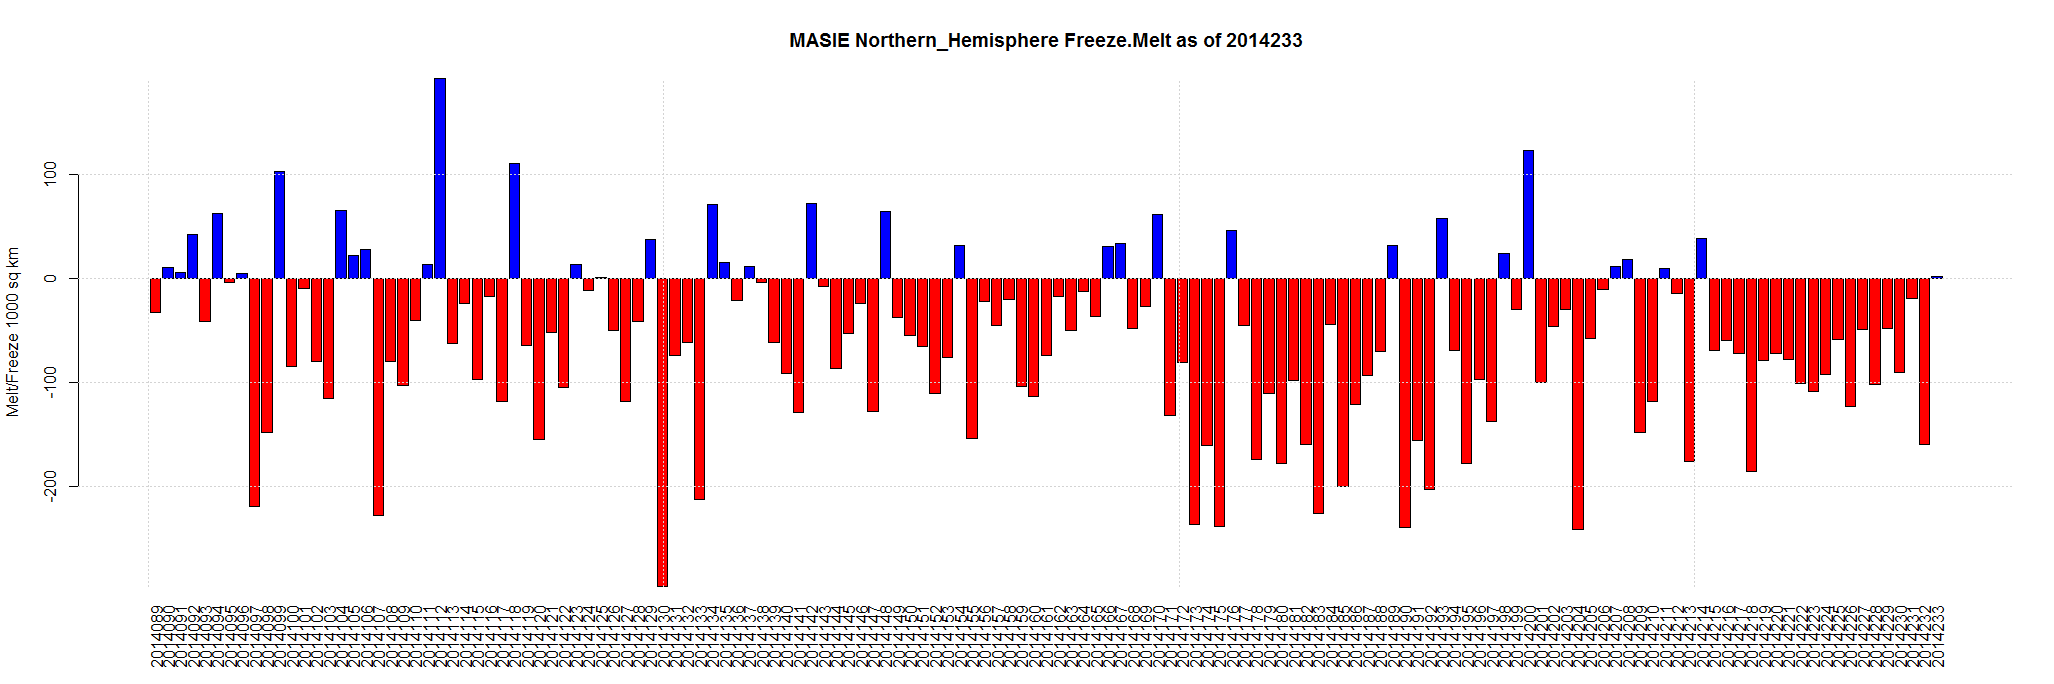
Aug 22 2014 MASIE Update – Tiny Increase – 6 regions showed an increase – 5 showed a drop
Data here. Click for bigger.
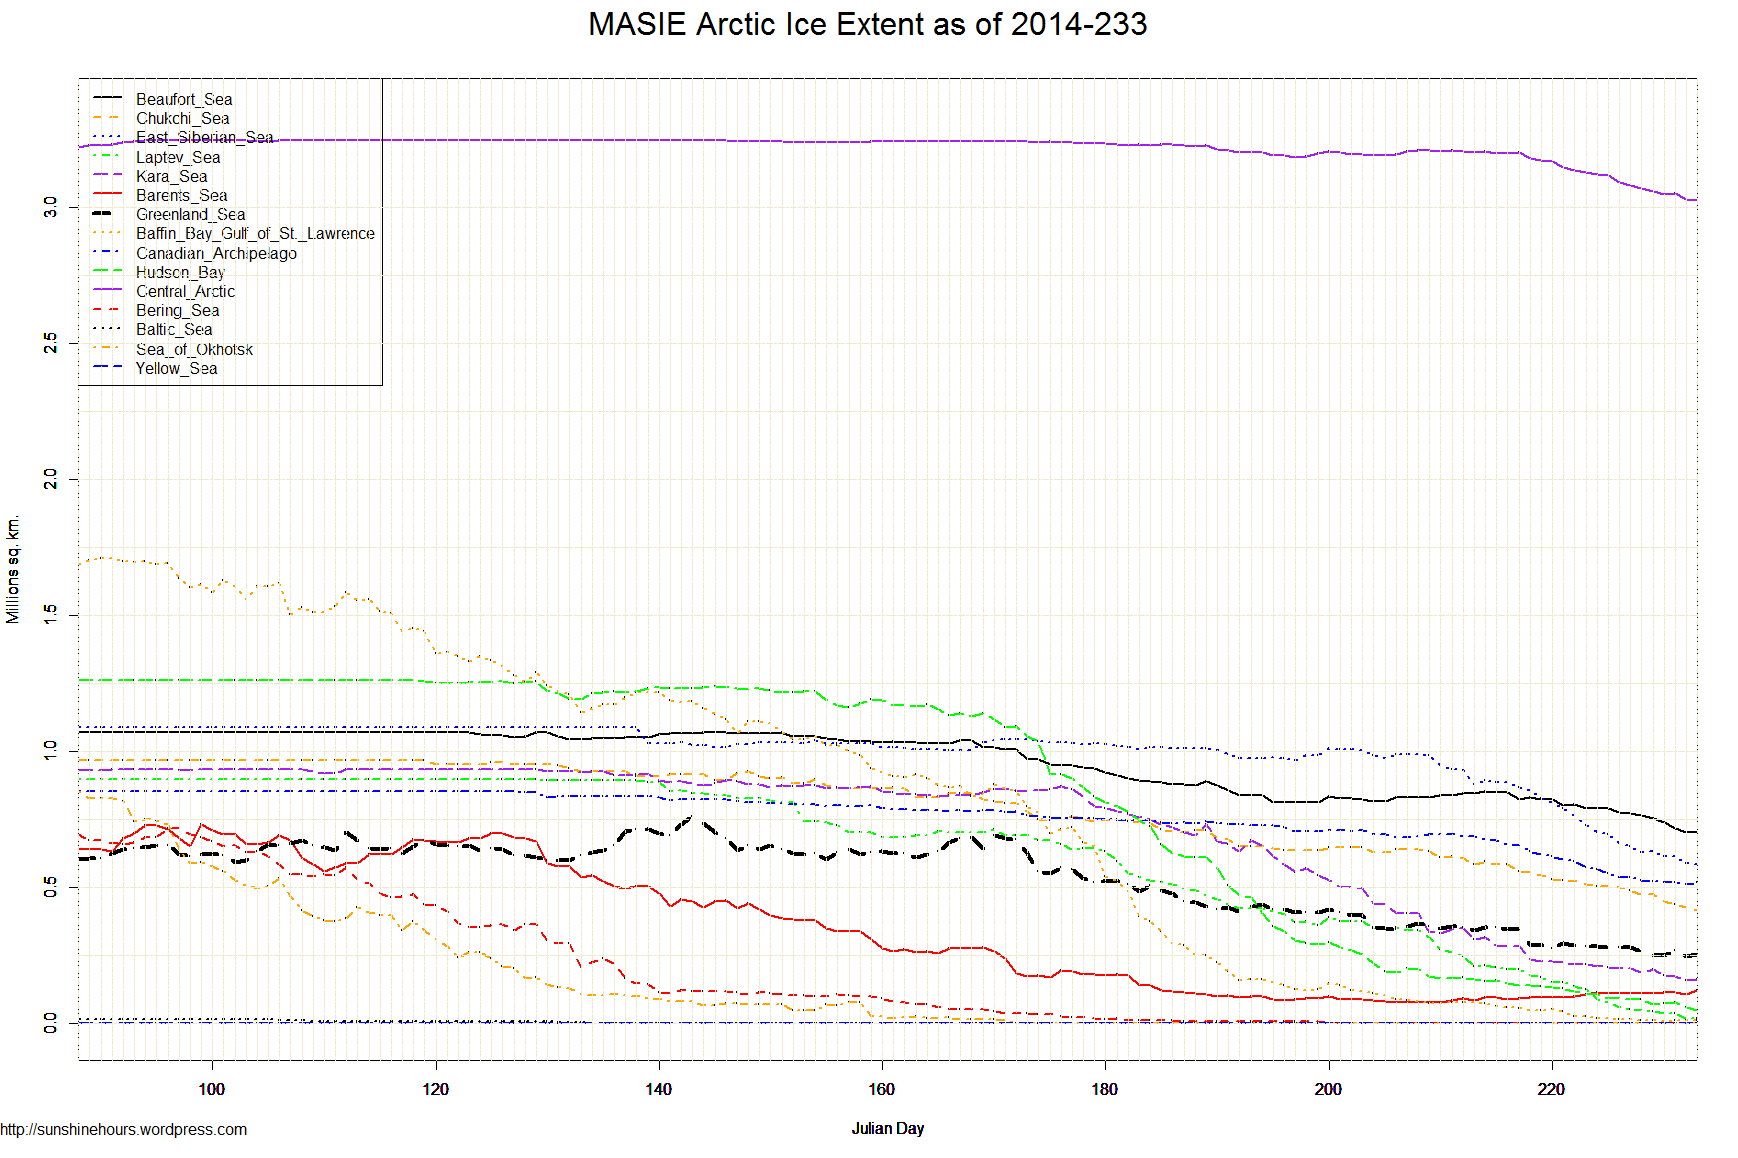
| Region | 146 days ago | End | Last 145 | Last 28 | Last 14 | Last 7 | Last 3 | Last 1 |
| Chukchi Sea | 966,006 | 414,888 | -551,119 | -213,679 | -131,138 | -84,122 | -36,167 | -10,773 |
| Hudson Bay | 1,260,903 | 49,883 | -1,211,020 | -141,278 | -87,674 | -43,060 | -26,096 | -9,259 |
| Central Arctic | 3,221,921 | 3,024,778 | -197,143 | -166,592 | -149,215 | -67,937 | -23,284 | -4,362 |
| East Siberian Sea | 1,087,137 | 584,188 | -502,949 | -391,822 | -245,053 | -77,401 | -30,430 | -4,327 |
| Laptev Sea | 897,845 | 18,201 | -879,644 | -328,371 | -150,205 | -42,348 | -20,026 | -863 |
| Bering Sea | 697,324 | 0 | -697,324 | -15 | 0 | 0 | 0 | 0 |
| Baltic Sea | 15,337 | 0 | -15,337 | 0 | 0 | 0 | 0 | 0 |
| Sea of Okhotsk | 853,240 | 0 | -853,240 | 0 | 0 | 0 | 0 | 0 |
| Yellow Sea | 0 | 0 | 0 | 0 | 0 | 0 | 0 | 0 |
| Baffin Bay Gulf of St. Lawrence | 1,688,530 | 10,260 | -1,678,270 | -92,978 | -39,638 | -4,648 | 484 | 104 |
| Beaufort Sea | 1,070,445 | 704,602 | -365,843 | -113,145 | -121,321 | -72,404 | -36,015 | 875 |
| Kara Sea | 933,859 | 161,310 | -772,549 | -276,831 | -66,476 | -42,057 | -15,631 | 3,751 |
| Greenland Sea | 603,416 | 254,242 | -349,174 | -96,417 | -32,266 | -26,568 | 3,042 | 5,443 |
| Canadian Archipelago | 853,214 | 517,621 | -335,593 | -176,855 | -104,532 | -20,359 | -2,659 | 6,591 |
| Barents Sea | 645,917 | 123,797 | -522,120 | 41,552 | 26,312 | 13,434 | 10,070 | 14,536 |
| Northern Hemisphere (Total) | 14,805,115 | 5,864,912 | -8,940,203 | -1,956,432 | -1,101,208 | -467,469 | -176,713 | 1,715 |
| NH (Average Loss per Day) | -61,234 | -69,873 | -78,658 | -66,781 | -58,904 | 1,715 |
Arctic Sea Ice Extent Aug 22 2014 – -1,115,000 sq km below the 1981-2010 mean. Data for Day 233. Data here.


* NOTE: The Antarctic data from NSIDC has a Missing column that is usually 0. Today it is 0.00054. So Global Sea Ice will be affected,
Global Sea Ice Extent Aug 22 2014 – 21,000 sq km above the 1981-2010 mean. Data for Day 233. Data here.


* NOTE: The data from NSIDC has a Missing column that is usually 0. Today it is 0.00054.
Antarctic Sea Ice Extent Aug 22 2014 – 1,136,000 sq km above the 1981-2010 mean. Data for Day 233. Data here.


