Arctic Sea Ice Extent Aug 19 2014 – -1,156,000 sq km below the 1981-2010 mean. Data for Day 230. Data here.


Arctic Sea Ice Extent Aug 19 2014 – -1,156,000 sq km below the 1981-2010 mean. Data for Day 230. Data here.
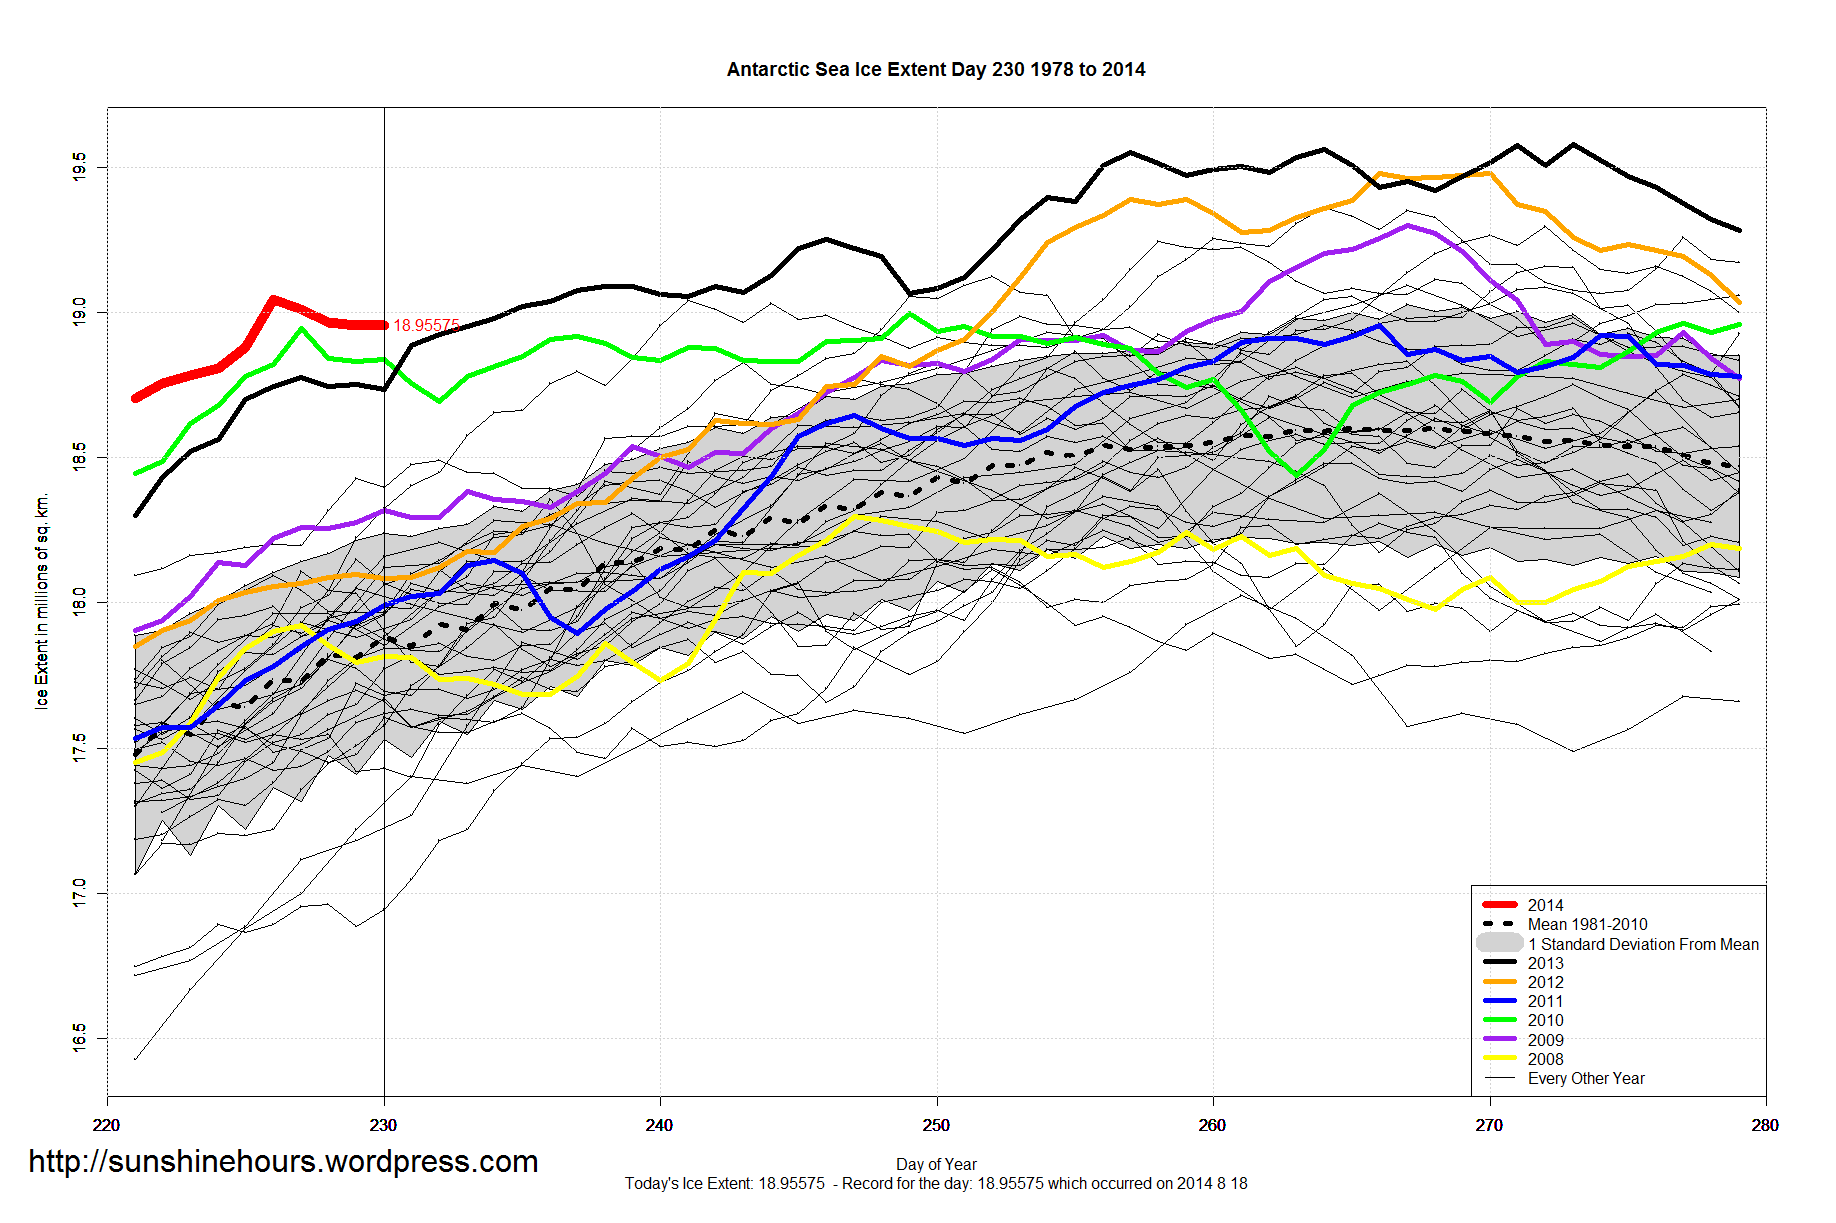
Antarctic Sea Ice Extent Aug 19 2014 – 1,108,000 sq km above the 1981-2010 mean. Data for Day 230. Data here.
Not sure … will 2014 follow the black line or the green line?

Using Environment Canada monthly summaries, Woodstock Ontario had the coldest average Tmax for July since 1872 (which is when the data starts).
Warm July’s seem kind of cyclic too on this graph.
This graph is just July’s monthly anomaly from the 1981-2010 average.

Wow
““If Toronto’s Pearson International Airport weather station doesn’t hit 30.0ºC before the end of August — and it’s not looking like it will — this will be the first consecutive July and August that Pearson has not hit 30.0ºC+ since records began at Pearson in 1938 — that’s 76 years of data,” says Weather Network meteorologist Dayna Vettese.”
http://iceagenow.info/2014/08/summer-toronto-verge-setting-record/
Here is a histogram collection showing that there have been 1371 days over 30C at the airport. But 2014 could be blank.
Note that “global warming” hasn’t caused any increase in “heat waves”.

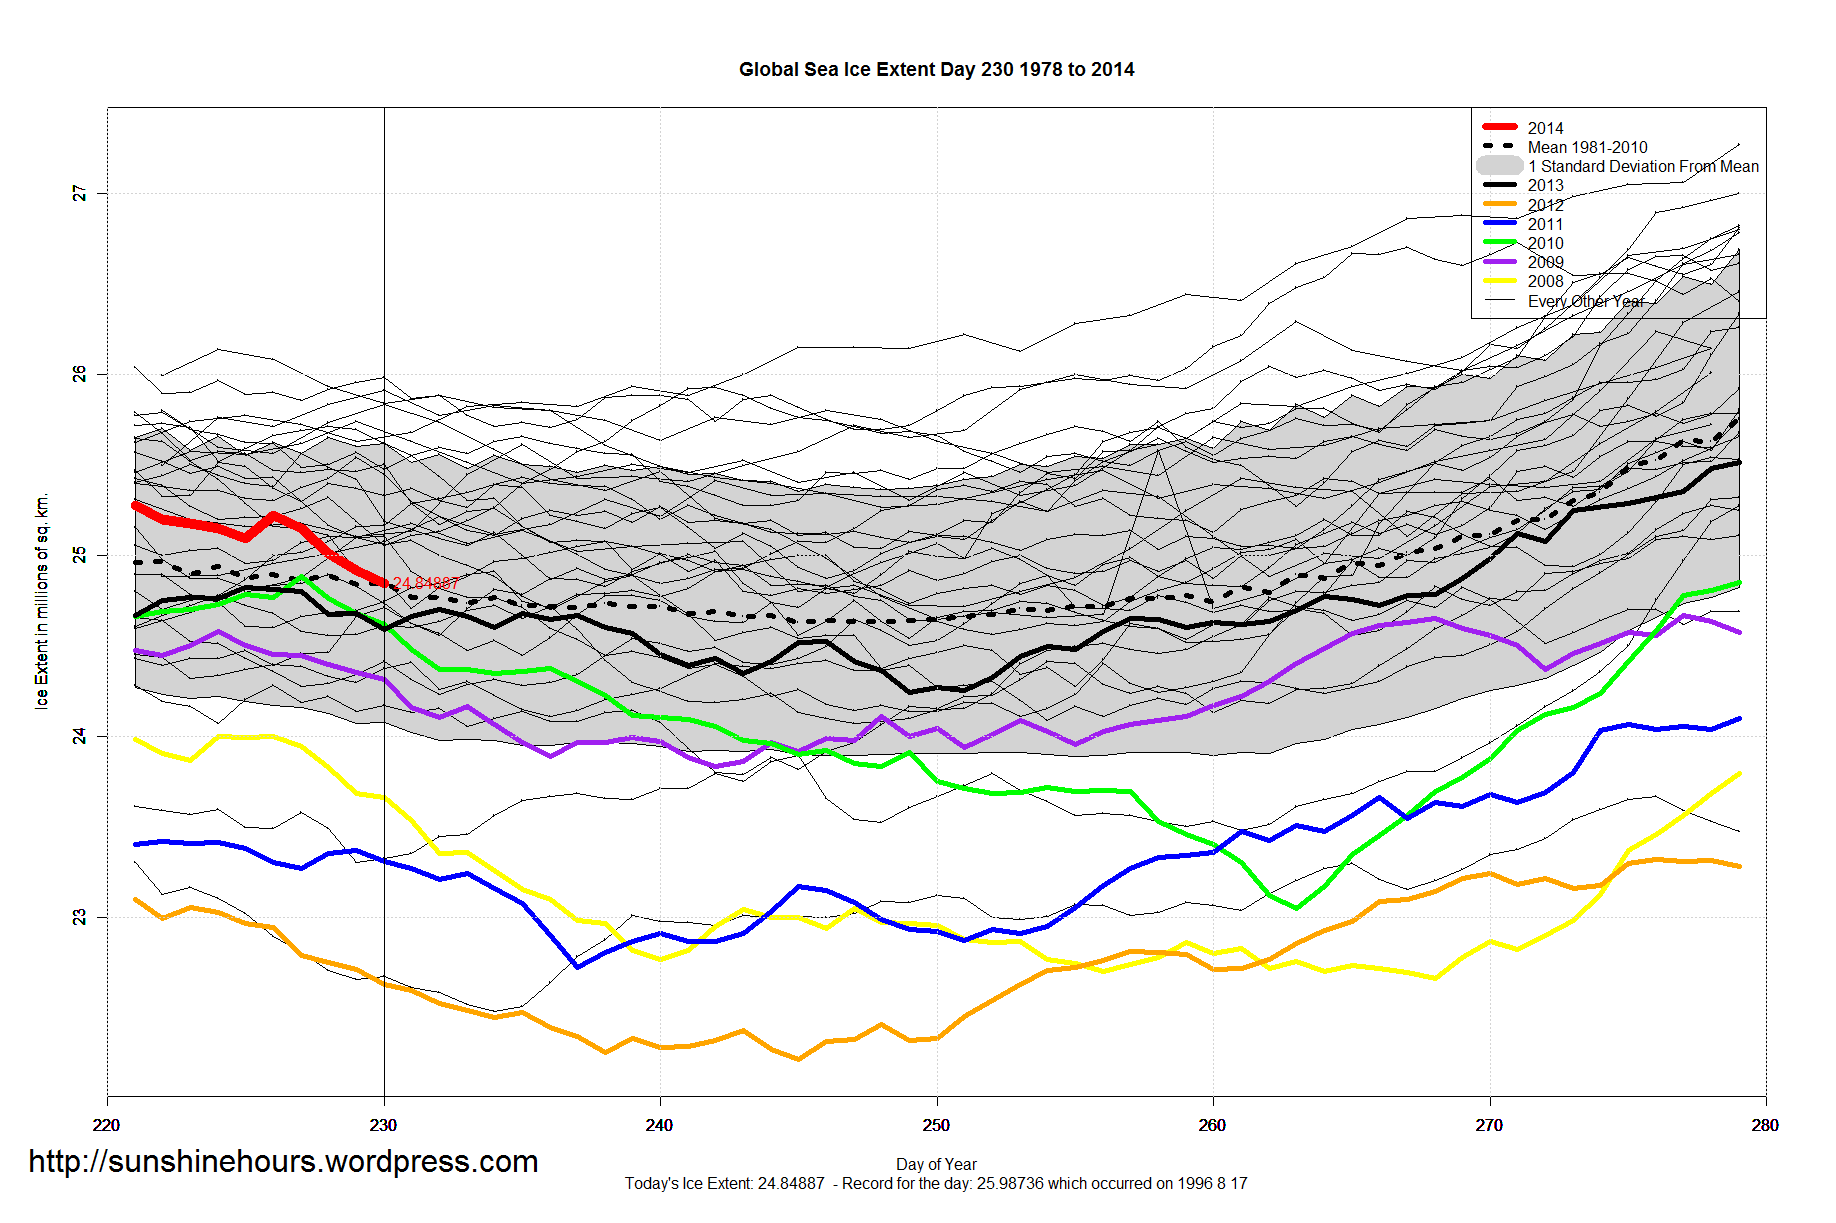
Global Sea Ice Extent Aug 19 2014 – -48,000 sq km below the 1981-2010 mean. Data for Day 230. Data here.

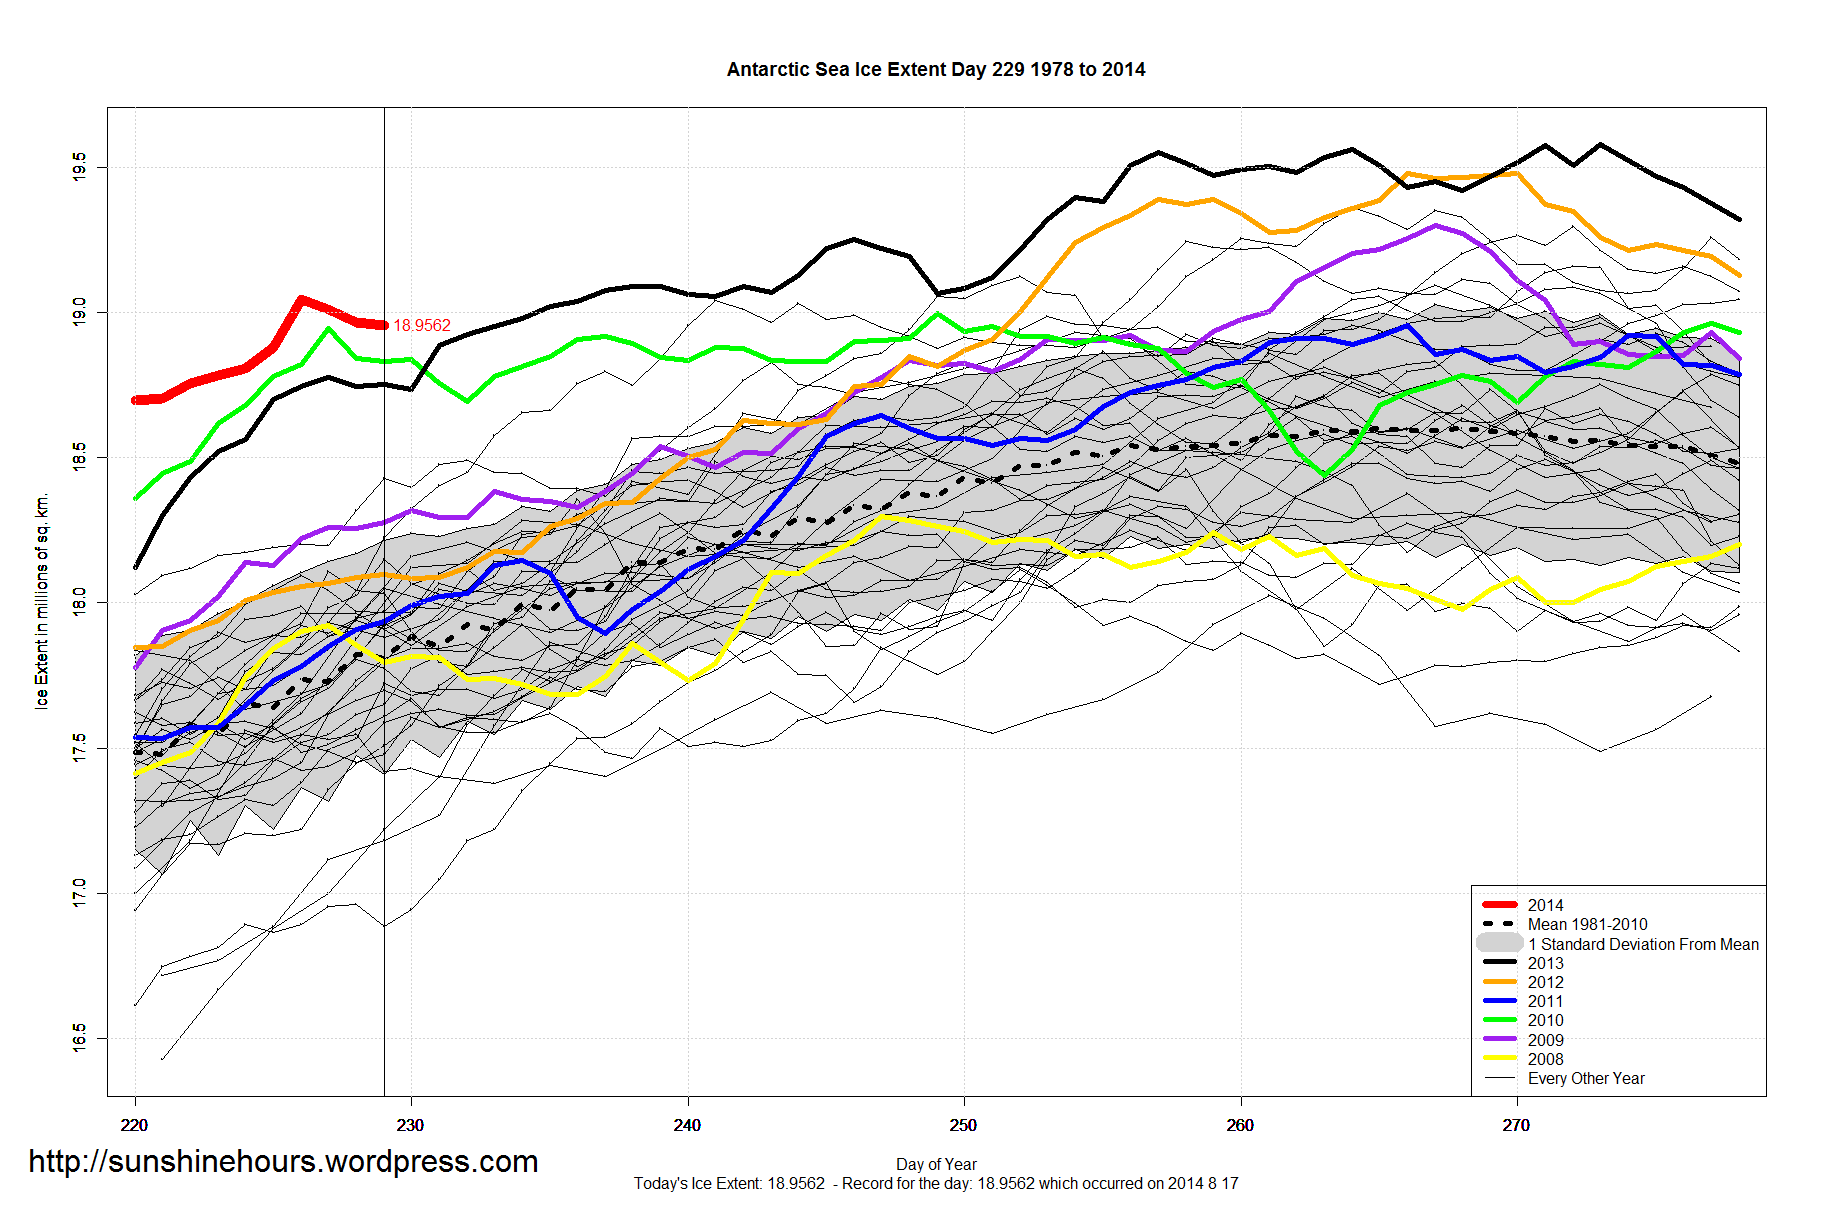
Antarctic Sea Ice Extent Aug 18 2014 – 1,132,000 sq km above the 1981-2010 mean. Data for Day 229. Data here.

Arctic Sea Ice Extent Aug 18 2014 – -1,126,000 sq km below the 1981-2010 mean. Data for Day 229. Data here.


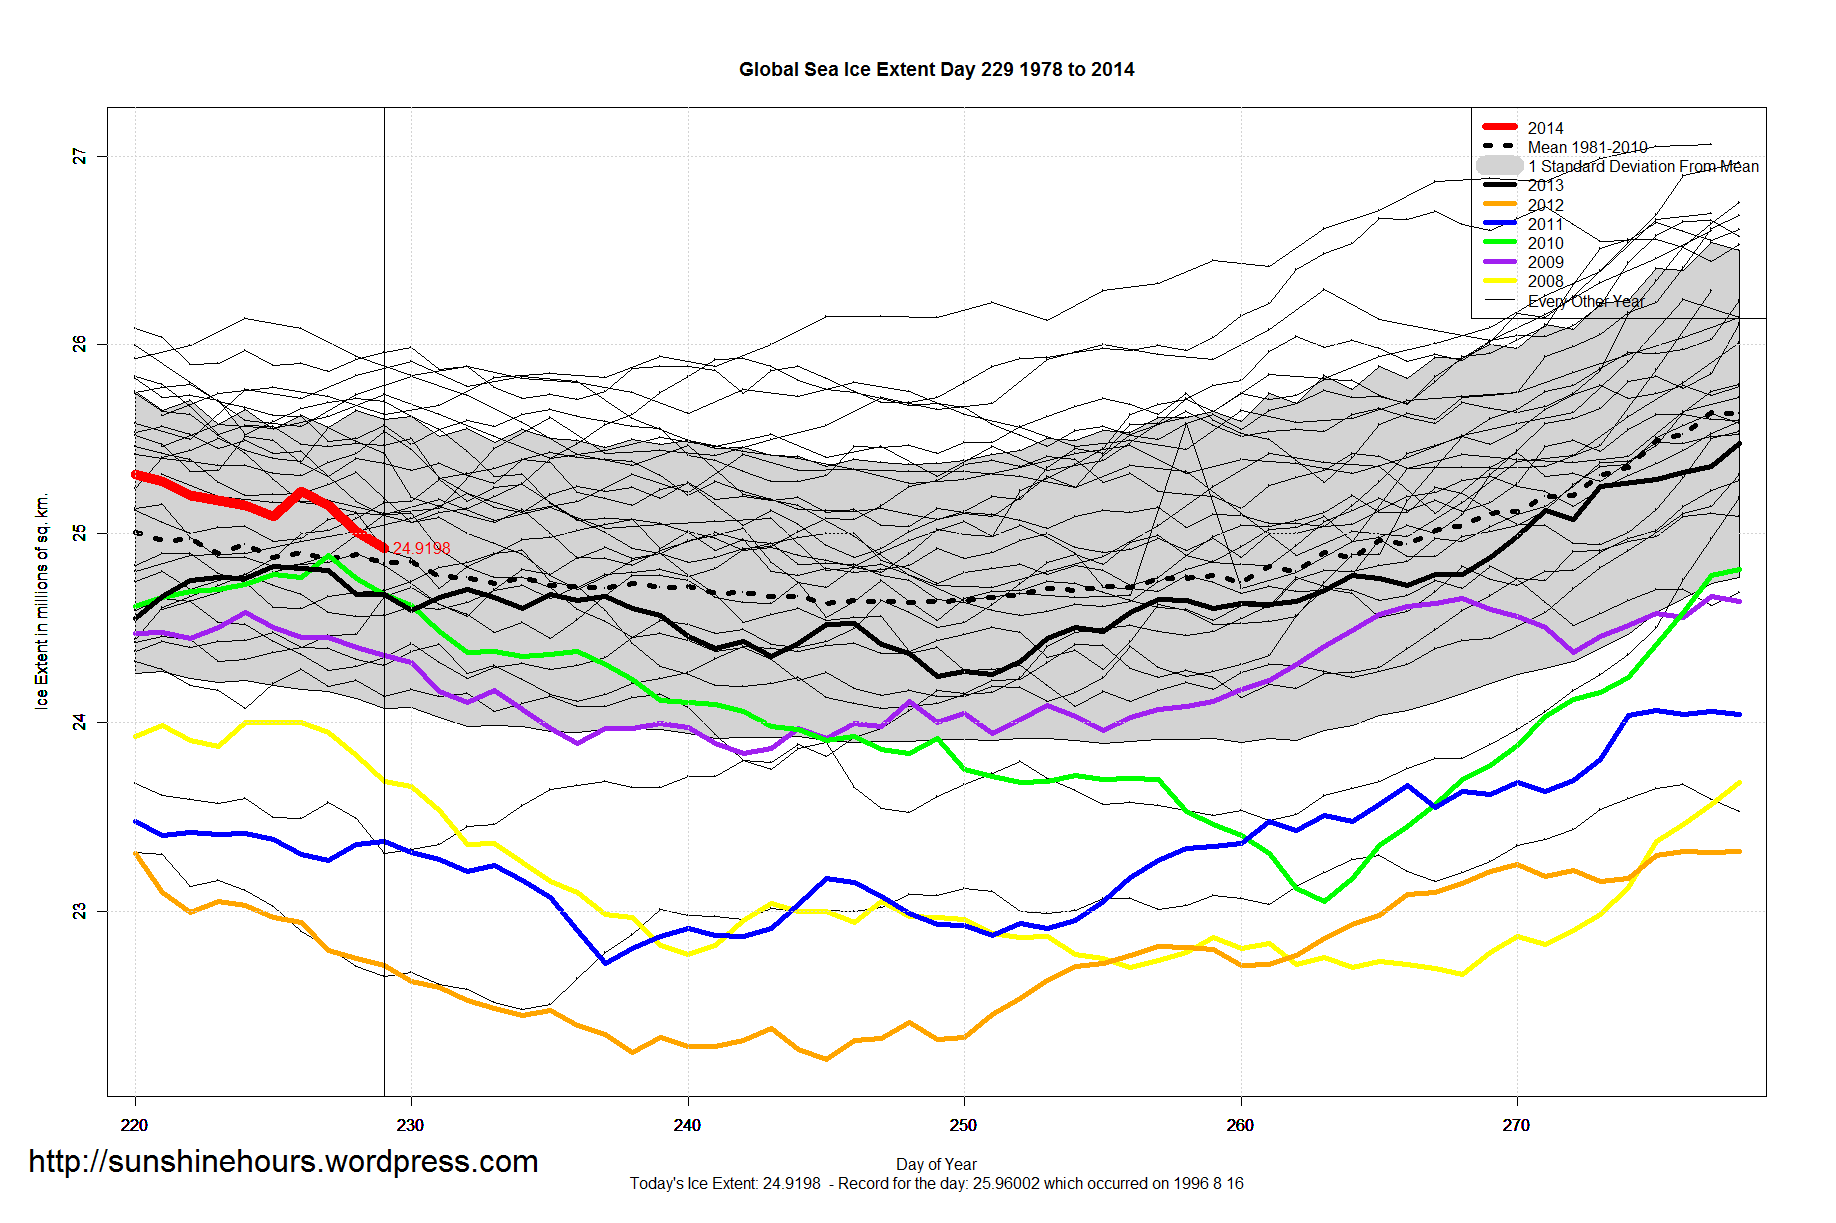
Global Sea Ice Extent Aug 18 2014 – 7,000 sq km above the 1981-2010 mean. Data for Day 229. Data here.

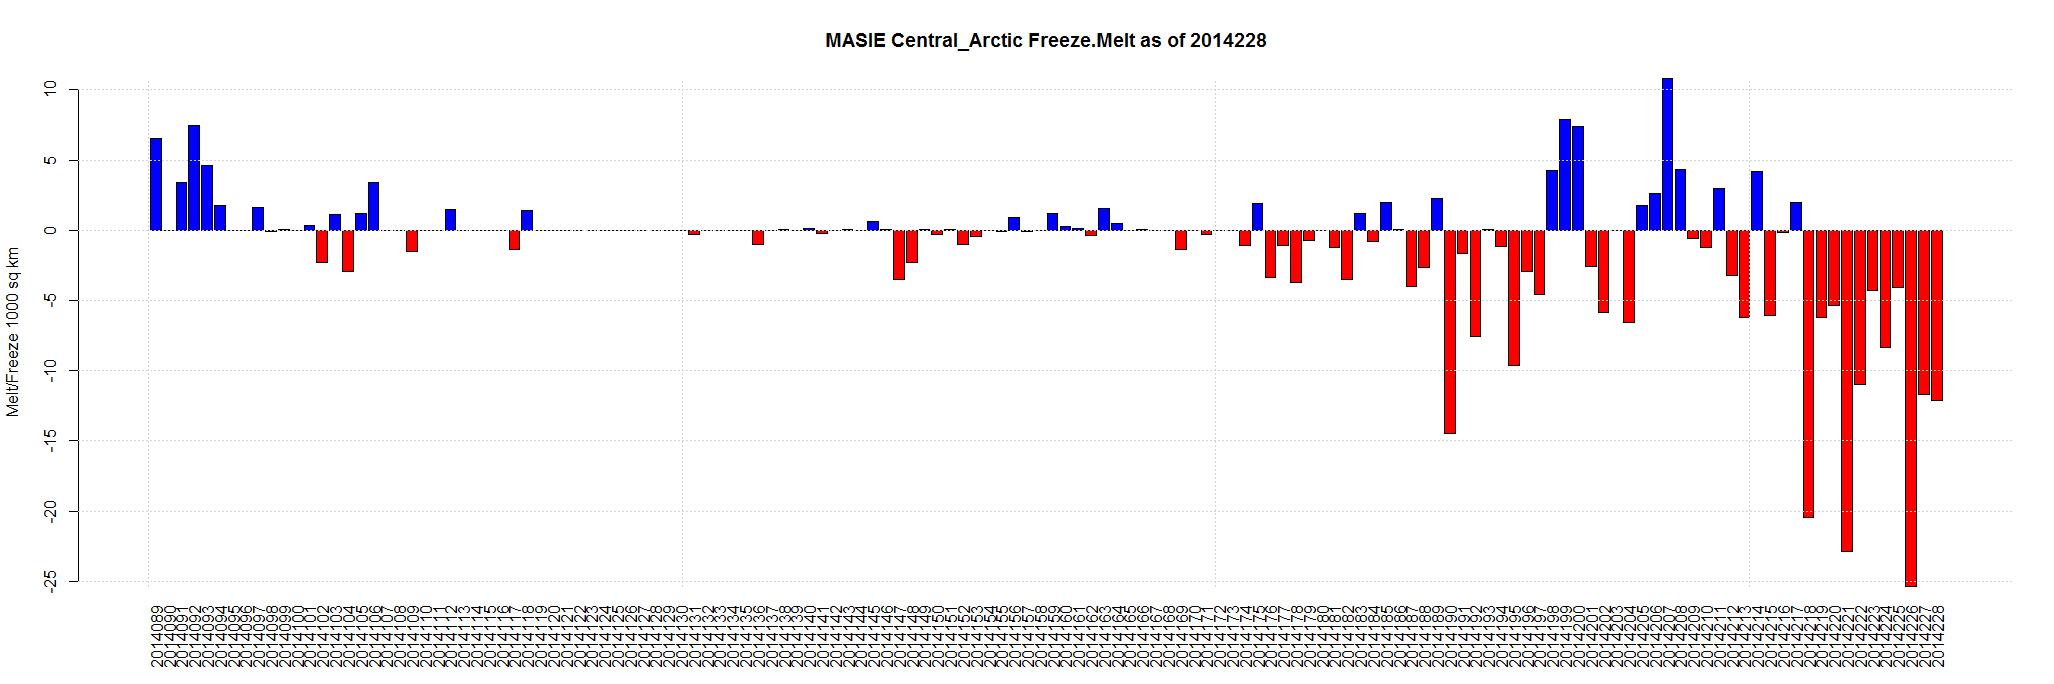
Aug 17 2014 MASIE Update – Steady Melting … Central Arctic is melting … But it has slowed from 25,000 sq km a day to 12,000 sq km over last two days
Barents Sea Has Been Gaining Ice For 4 Weeks
Data here. Click for bigger.

| Region | 141 days ago | End | Last 140 | Last 28 | Last 14 | Last 7 | Last 3 | Last 1 |
| East Siberian Sea | 1,087,137 | 628,671 | -458,466 | -384,338 | -266,834 | -162,919 | -67,657 | -22,414 |
| Chukchi Sea | 966,006 | 474,901 | -491,105 | -173,659 | -120,625 | -50,114 | -30,520 | -14,865 |
| Kara Sea | 933,859 | 187,131 | -746,729 | -340,810 | -128,957 | -37,596 | -19,812 | -14,531 |
| Greenland Sea | 603,416 | 266,843 | -336,573 | -152,927 | -85,187 | -29,463 | -13,195 | -14,002 |
| Central Arctic | 3,221,921 | 3,068,880 | -153,041 | -135,772 | -136,108 | -76,857 | -49,178 | -12,159 |
| Canadian Archipelago | 853,214 | 527,779 | -325,436 | -182,407 | -150,443 | -77,063 | -25,564 | -11,079 |
| Beaufort Sea | 1,070,445 | 763,810 | -306,635 | -72,831 | -89,839 | -40,159 | -25,655 | -8,176 |
| Laptev Sea | 897,845 | 48,385 | -849,459 | -342,570 | -164,653 | -103,114 | -30,296 | -3,710 |
| Baffin Bay Gulf of St. Lawrence | 1,688,530 | 12,597 | -1,675,933 | -133,960 | -59,951 | -33,765 | -8,108 | -1,350 |
| Hudson Bay | 1,260,903 | 87,721 | -1,173,183 | -209,363 | -67,147 | -40,296 | -5,414 | -1,144 |
| Bering Sea | 697,324 | 0 | -697,324 | -787 | 0 | 0 | 0 | 0 |
| Baltic Sea | 15,337 | 0 | -15,337 | 0 | 0 | 0 | 0 | 0 |
| Sea of Okhotsk | 853,240 | 0 | -853,240 | 0 | 0 | 0 | 0 | 0 |
| Yellow Sea | 0 | 0 | 0 | 0 | 0 | 0 | 0 | 0 |
| Barents Sea | 645,917 | 112,870 | -533,047 | 13,781 | 18,252 | 16,257 | 716 | 1,261 |
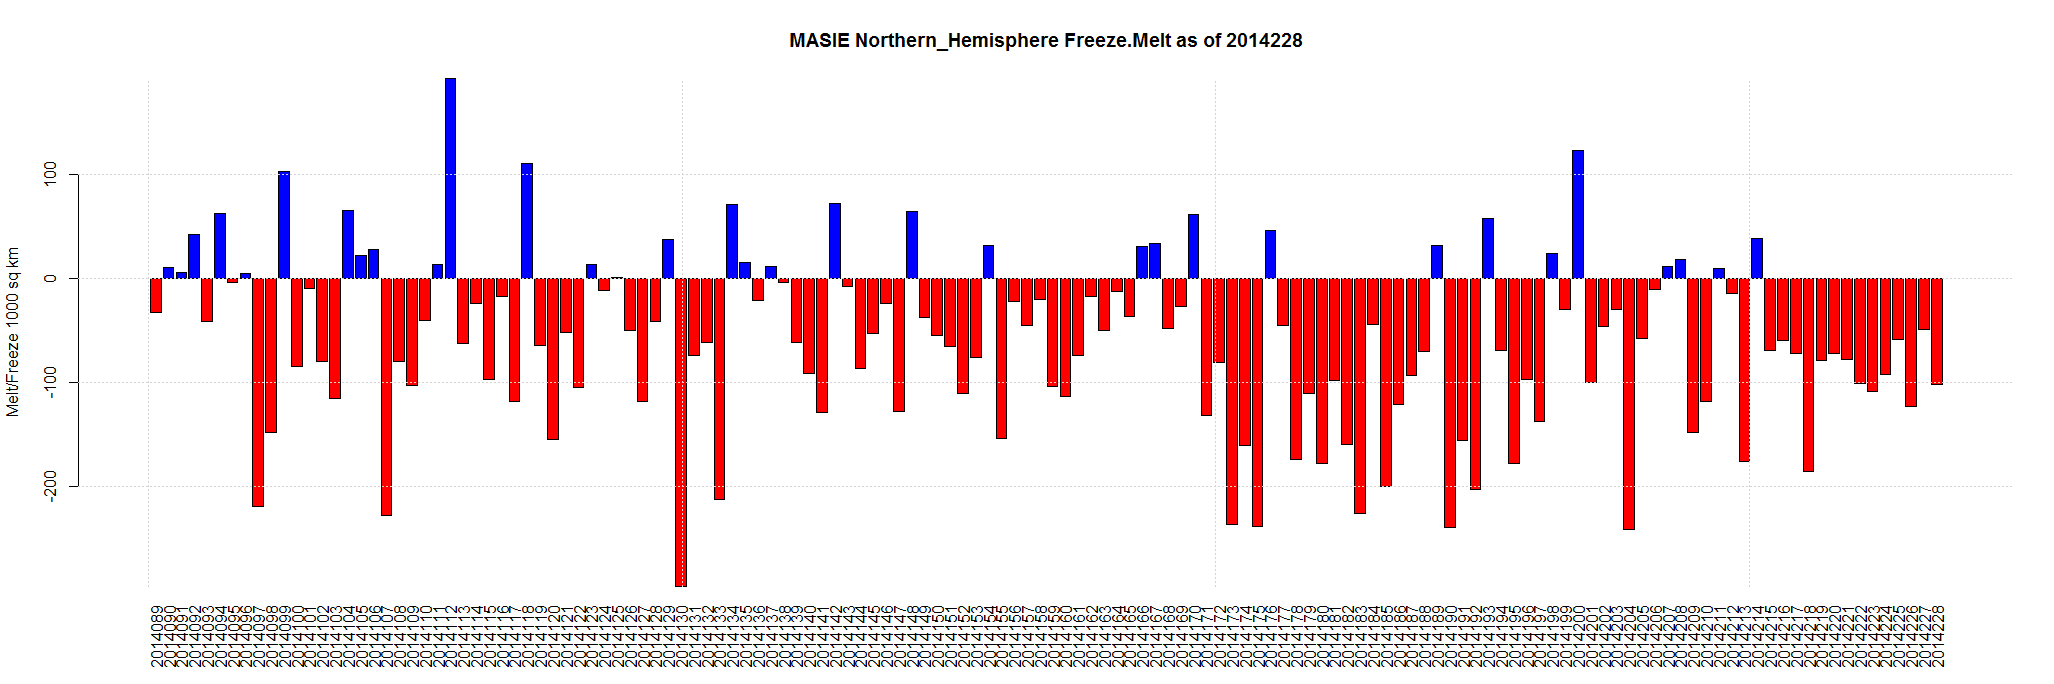
| Northern Hemisphere (Total) | 14,805,115 | 6,180,730 | -8,624,384 | -2,115,642 | -1,251,492 | -635,089 | -274,684 | -102,168 |
| NH (Average Loss per Day) | -61,166 | -75,559 | -89,392 | -90,727 | -91,561 | -102,168 |
Arctic Sea Ice Extent Aug 17 2014 – -1,102,000 sq km below the 1981-2010 mean. Data for Day 228. Data here.


