Antarctic Sea Ice Extent is 1,214,000 sq km above the 1981-2010 mean.
Antarctic Sea Ice Extent is 1,214,000 sq km above the 1981-2010 mean.
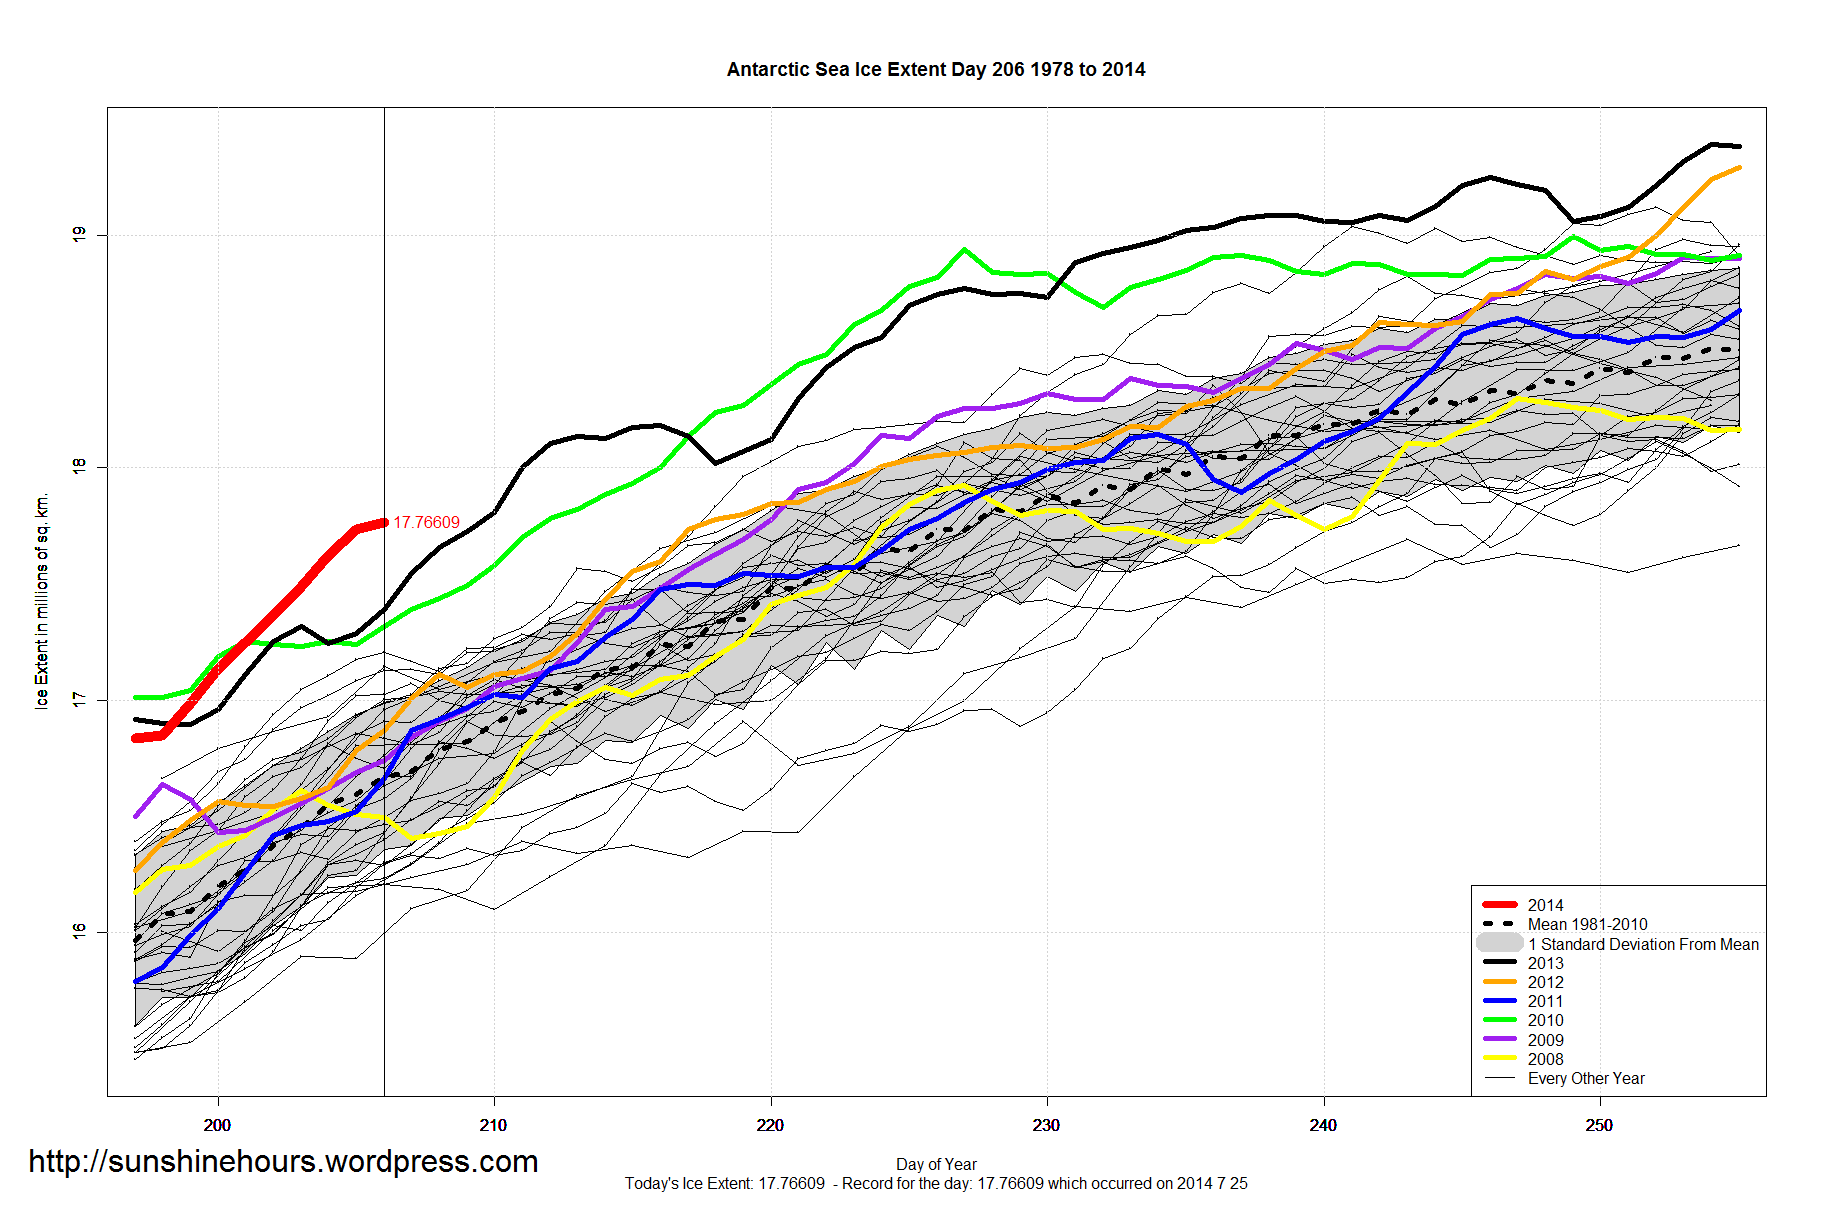
On Day 206 of 2014, Antarctic Sea Ice Extent is 1,128,000 sq km above the 1981-2010 mean.
It is also 1,800,000 sq km higher than the low for day 206 back in 1983.

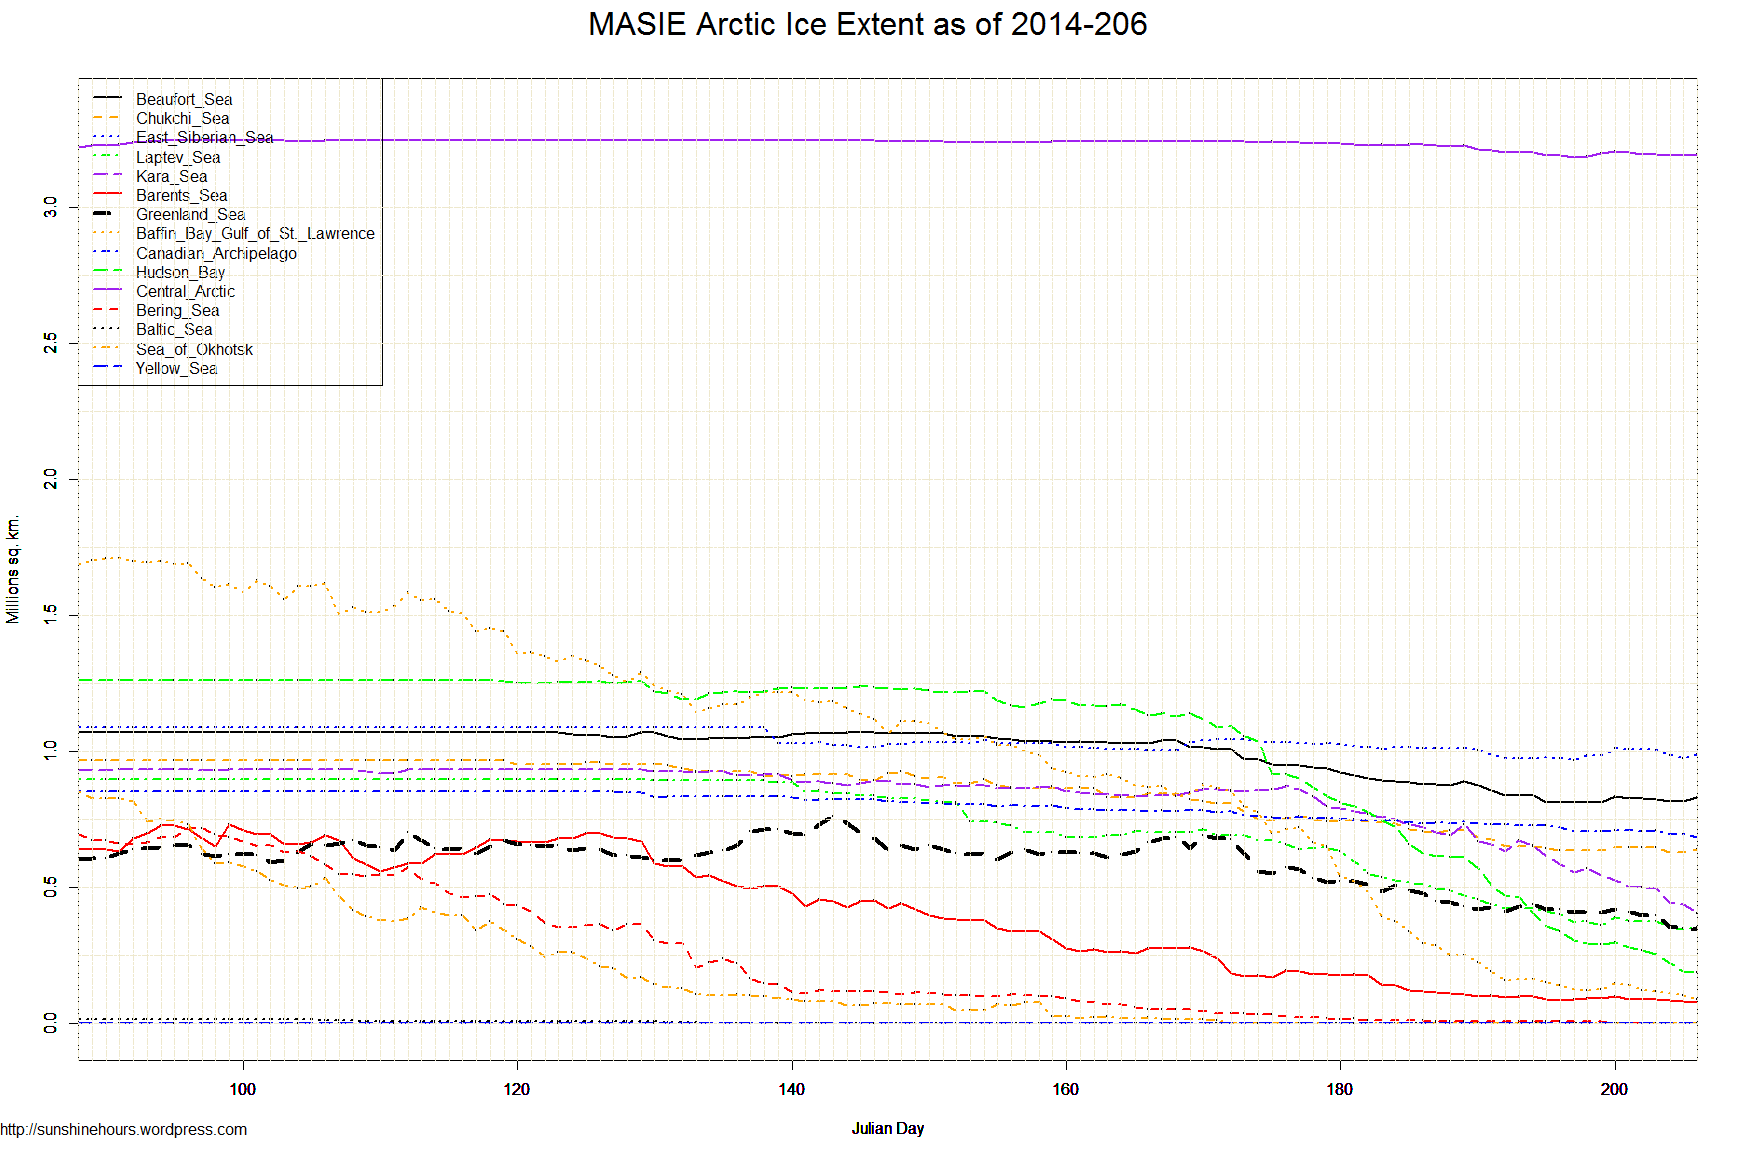
July 26 2014 MASIE Update – Melting and Freezing … resulting in a very small net melt of -10,205 sq km over the last day.
However the net melt over the last 3 days was pretty high. But almost the same as the last 7 days.
Data here.
| Region | 119 days ago | End | Last 118 | Last 28 | Last 14 | Last 7 | Last 3 | Last 1 |
| Kara Sea | 933,859 | 405,765 | -528,094 | -429,387 | -228,219 | -140,223 | -91,746 | -32,376 |
| Baffin Bay Gulf of St. Lawrence | 1,688,530 | 89,395 | -1,599,136 | -578,372 | -69,533 | -37,632 | -28,139 | -13,844 |
| Canadian Archipelago | 853,214 | 685,441 | -167,774 | -70,628 | -45,269 | -20,201 | -24,665 | -9,035 |
| Greenland Sea | 603,416 | 347,900 | -255,516 | -186,943 | -65,476 | -61,545 | -48,490 | -2,759 |
| Barents Sea | 645,917 | 79,847 | -566,070 | -102,676 | -16,457 | -14,165 | -10,705 | -2,398 |
| Hudson Bay | 1,260,903 | 190,058 | -1,070,845 | -679,341 | -279,459 | -99,954 | -63,224 | -1,103 |
| Bering Sea | 697,324 | 15 | -697,308 | -24,071 | -8,643 | -7,329 | -1,323 | 0 |
| Baltic Sea | 15,337 | 0 | -15,337 | 0 | 0 | 0 | 0 | 0 |
| Sea of Okhotsk | 853,240 | 0 | -853,240 | 0 | 0 | 0 | 0 | 0 |
| Yellow Sea | 0 | 0 | 0 | 0 | 0 | 0 | 0 | 0 |
| Central Arctic | 3,221,921 | 3,193,981 | -27,941 | -40,662 | -9,398 | -3,303 | -2,248 | 2,611 |
| Laptev Sea | 897,845 | 353,118 | -544,727 | -290,647 | -68,636 | -6,843 | -24,403 | 6,547 |
| Chukchi Sea | 966,006 | 641,806 | -324,200 | -109,851 | -9,047 | 3,585 | -5,570 | 13,239 |
| Beaufort Sea | 1,070,445 | 831,750 | -238,695 | -111,070 | -8,839 | 19,239 | 6,139 | 14,003 |
| East Siberian Sea | 1,087,137 | 990,921 | -96,217 | -35,106 | 17,263 | 6,655 | -15,058 | 14,910 |
| Northern Hemisphere (Total) | 14,805,115 | 7,811,139 | -6,993,976 | -2,659,139 | -791,713 | -361,718 | -309,432 | -10,205 |
| NH (Average Loss per Day) | -58,773 | -94,969 | -56,551 | -51,674 | -103,144 | -10,205 |
A new graph

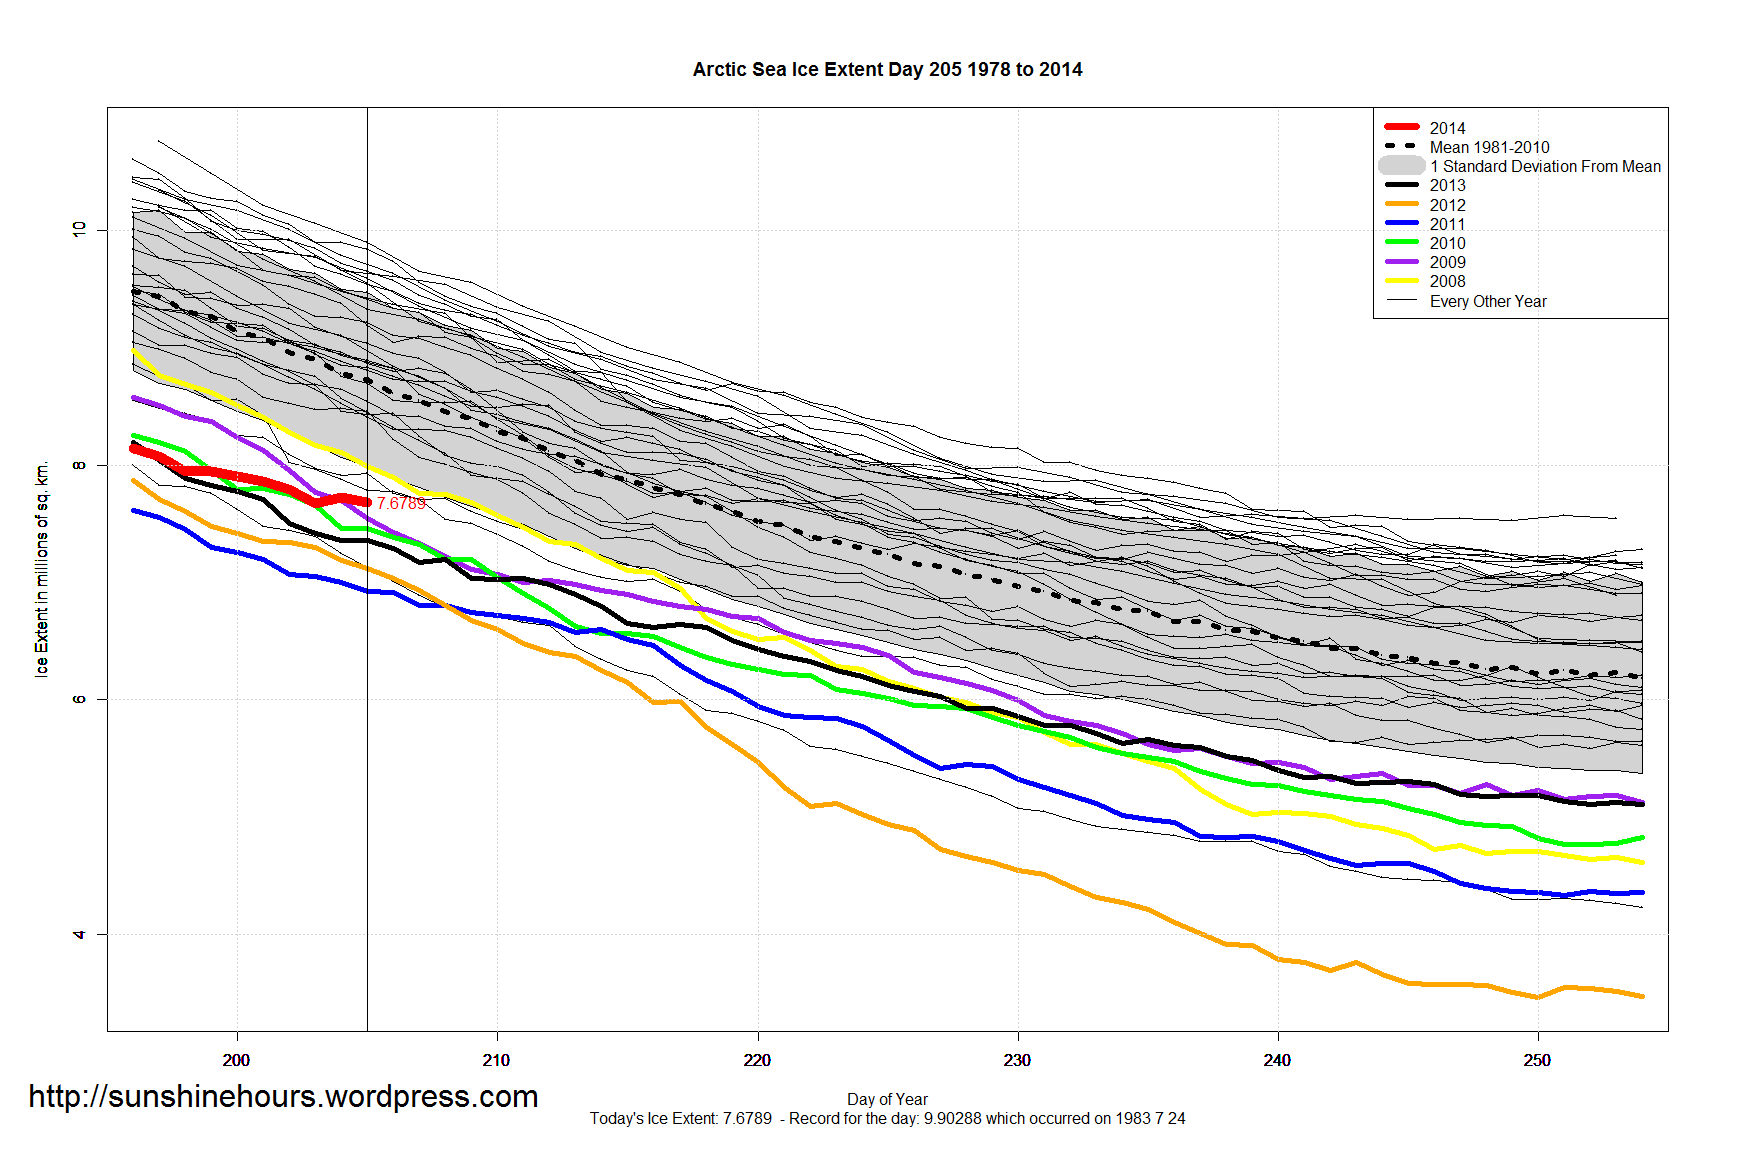
Arctic Sea Ice Extent seems to be aiming to break the one standard deviation mark … maybe in 6 or 7 days.
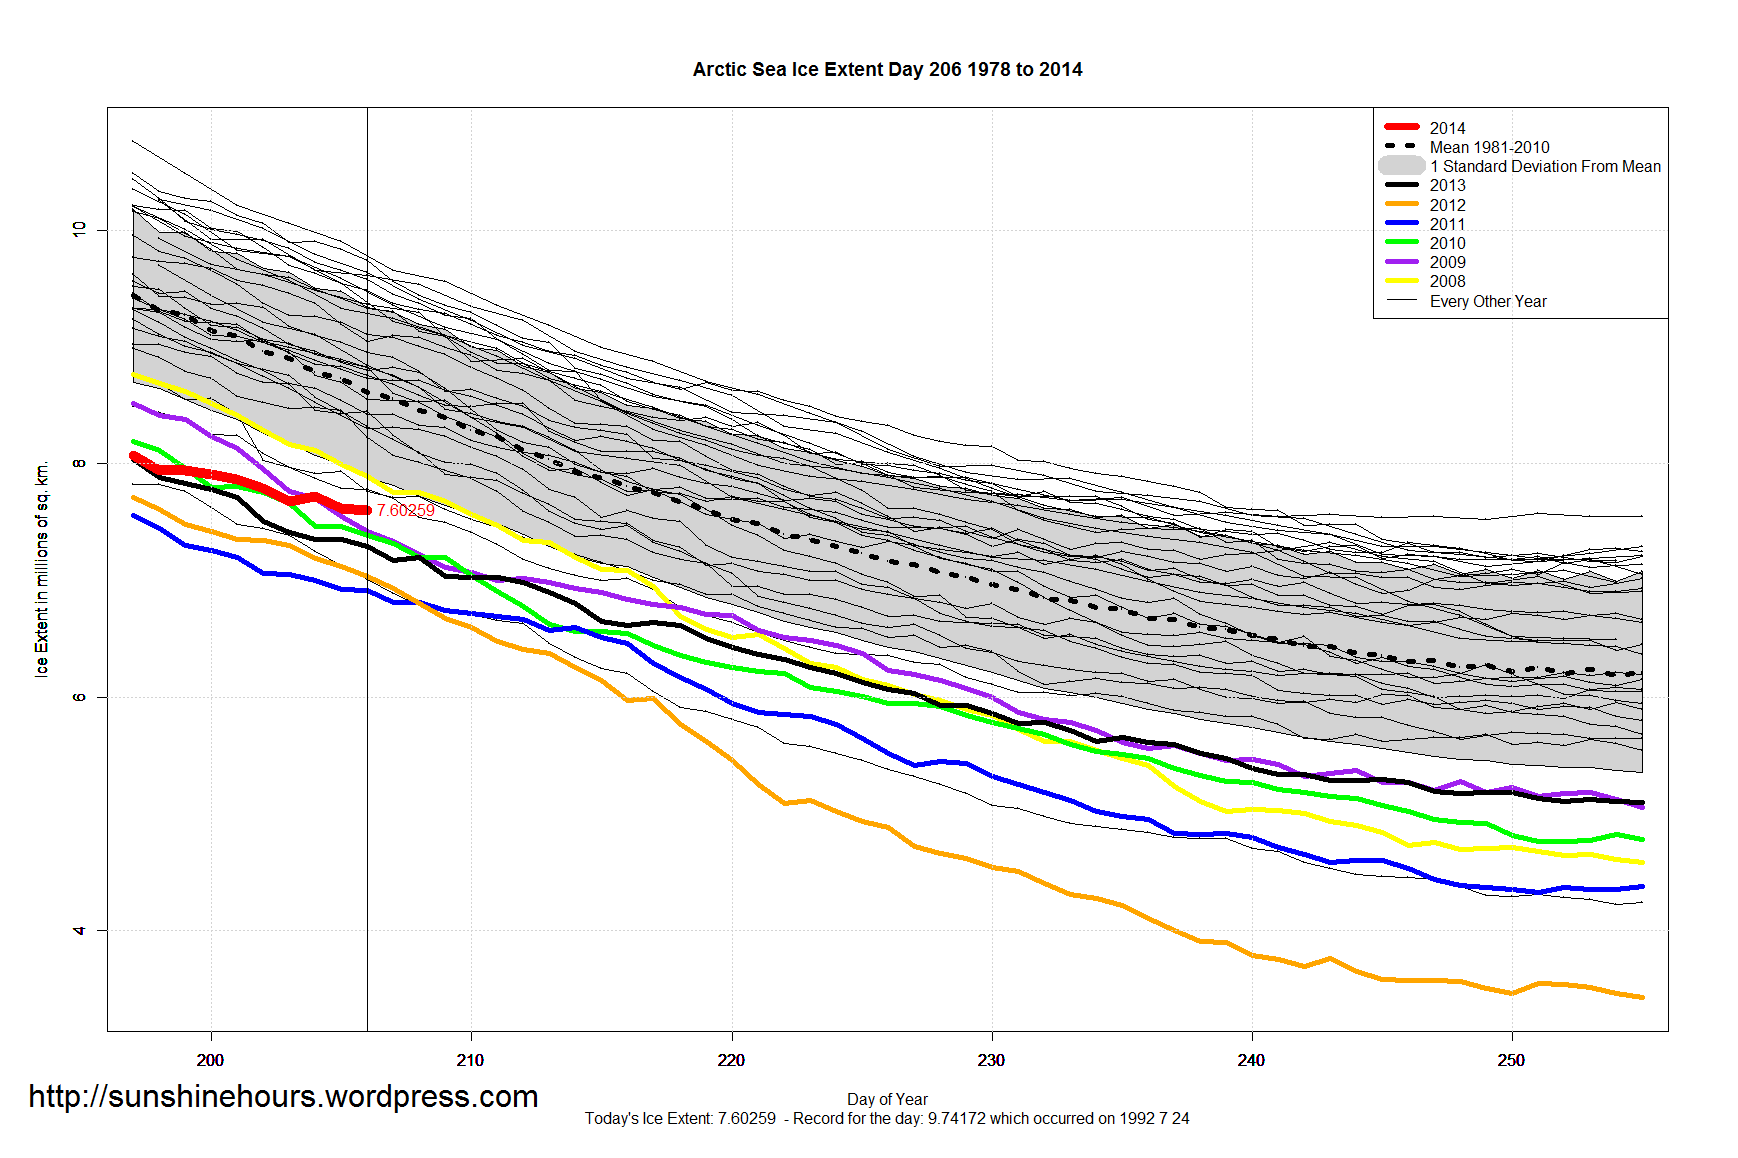
In 2011 Arctic Sea Ice Extent on day 205 was 6.9 million sq km. In 2014, on the same day, it is 7.7 million sq km. That is 800,000 sq km higher.
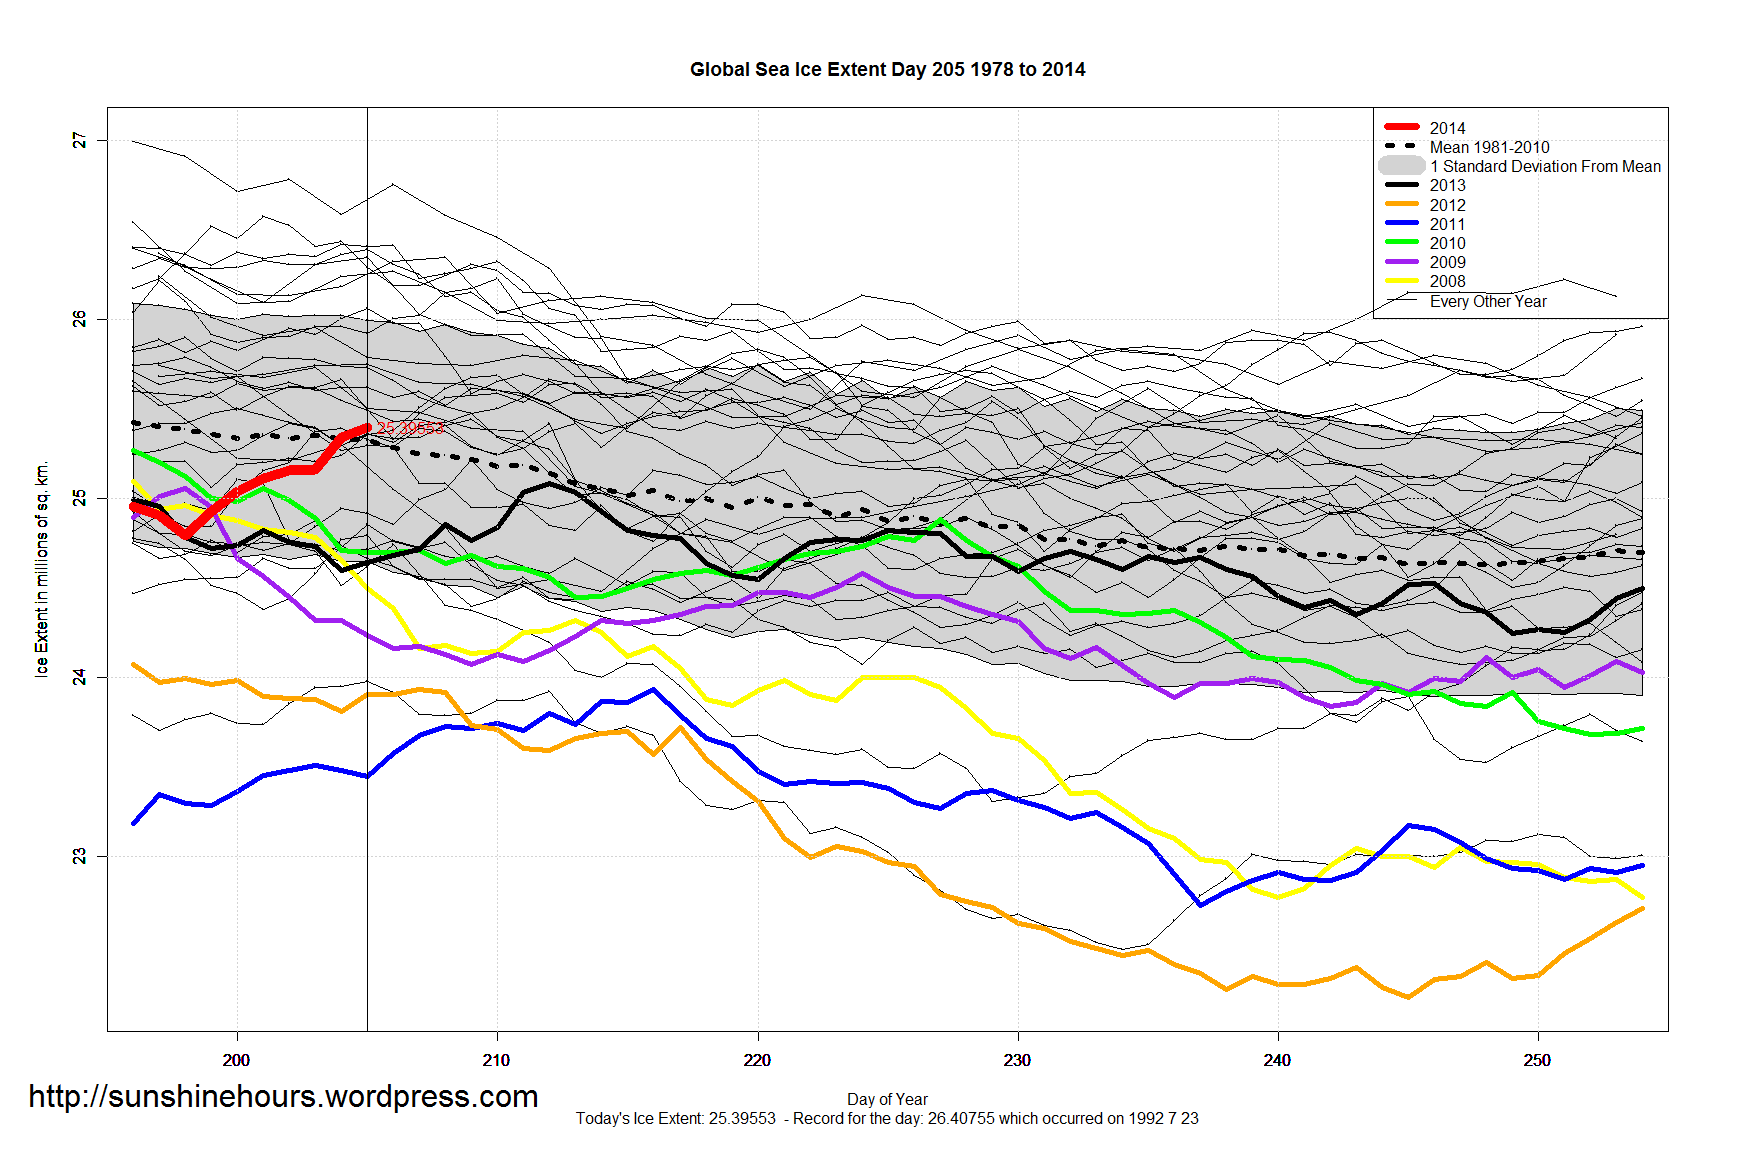
The last time global sea ice was higher than it is on day 205 was way back in 2004. Global Sea Ice Extent is 14,000 sq km above the 1981-2010 mean.
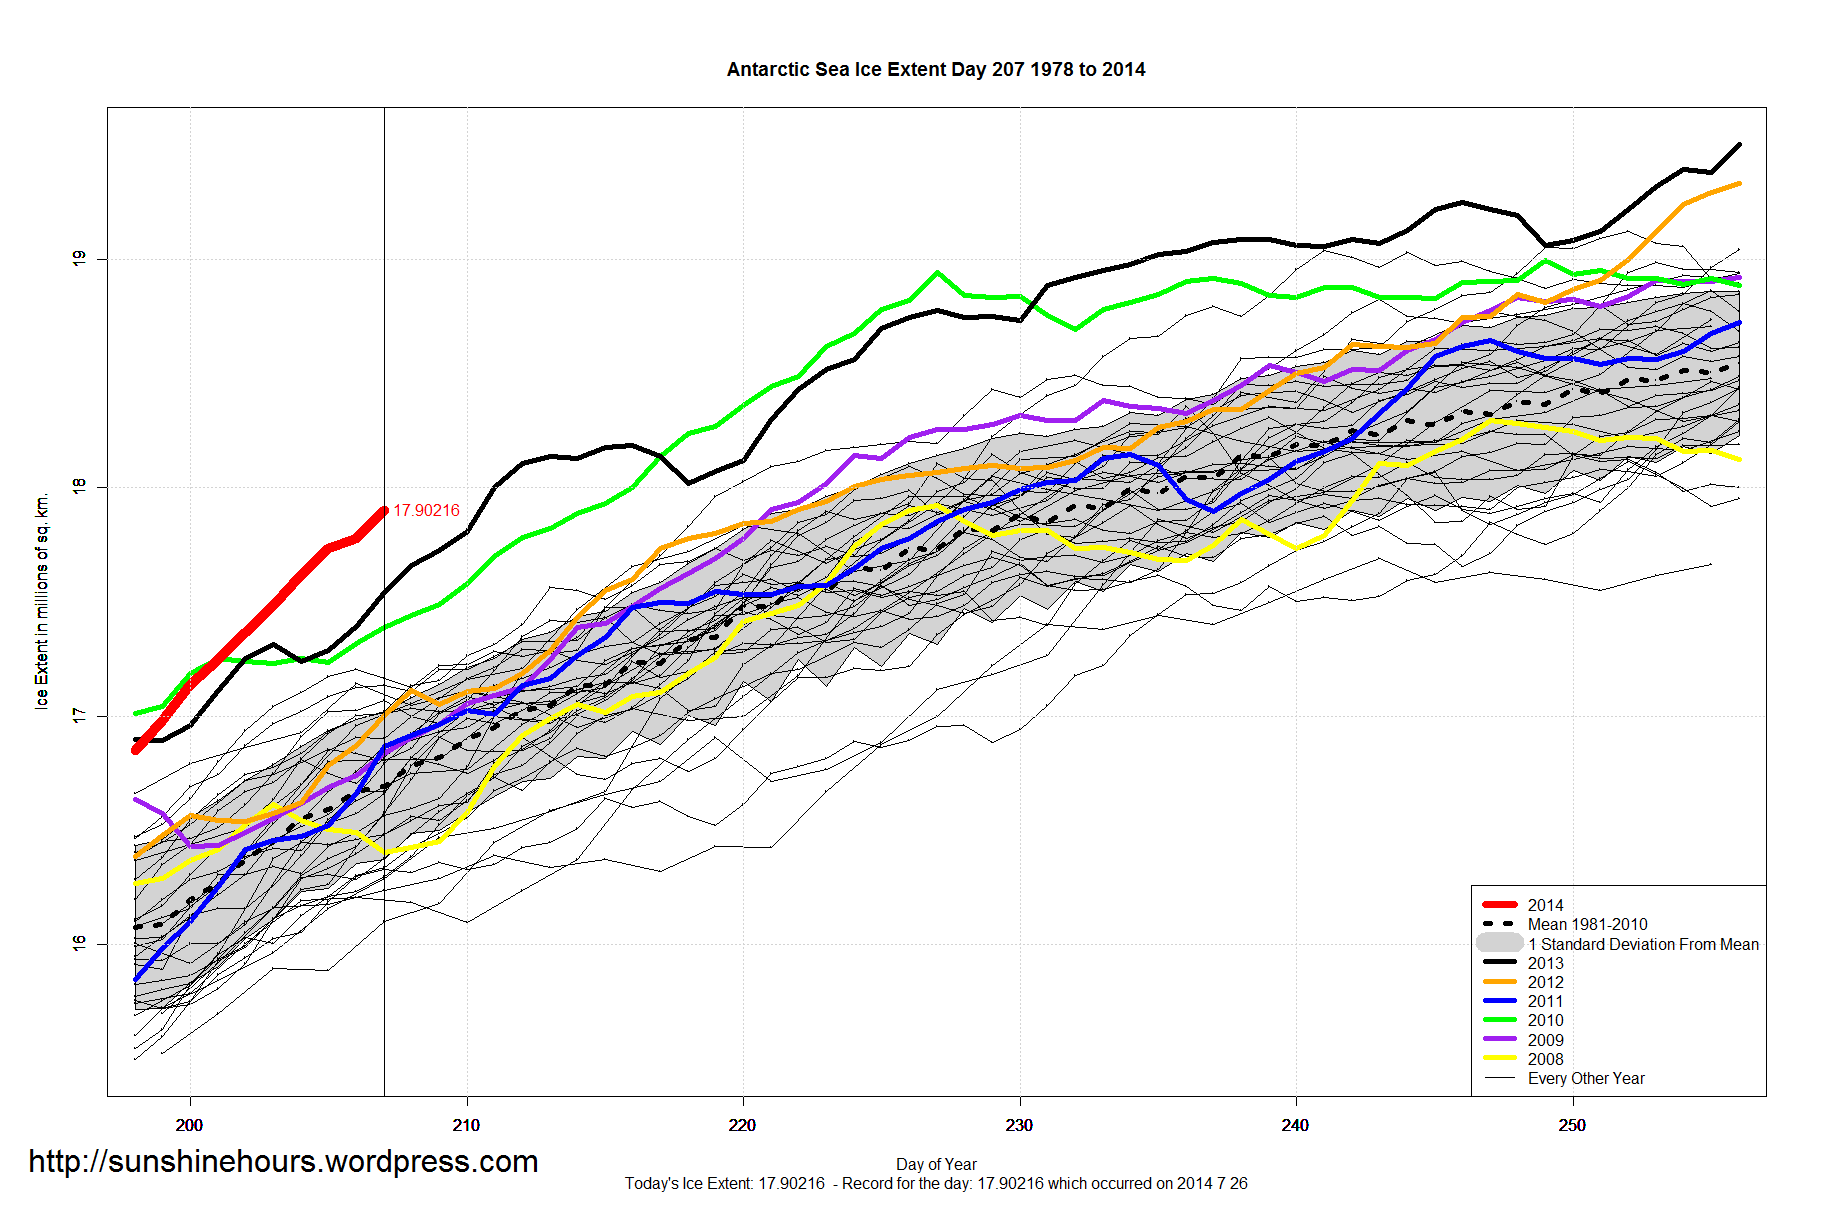
Antarctic Sea Ice Extent is 1,131,000 sq km above the 1981-2010 mean.
That obliterates the previous daily record by 500,000 sq km. And is also the 127th daily record for the year.

Cleaner Air = More Sunshine = Warmer
“A paper published today in Geophysical Research Letters finds that clean air laws which greatly reduced sulfur dioxide emissions explain 81% of the “brightening” of sunshine and 23% of the surface warming in Europe since 1980.”
Read about it here.
28,504 Low Max Records were set in last 365 days according to the NOAA.
A “Low Max” means that the maximum temperatures for the day was the lowest it has ever been.
This indicates daytime cooling.
Only 13205 High Max records were set. That is over a 2:1 ratio. Brrr.

(h/t IceAgeNow)
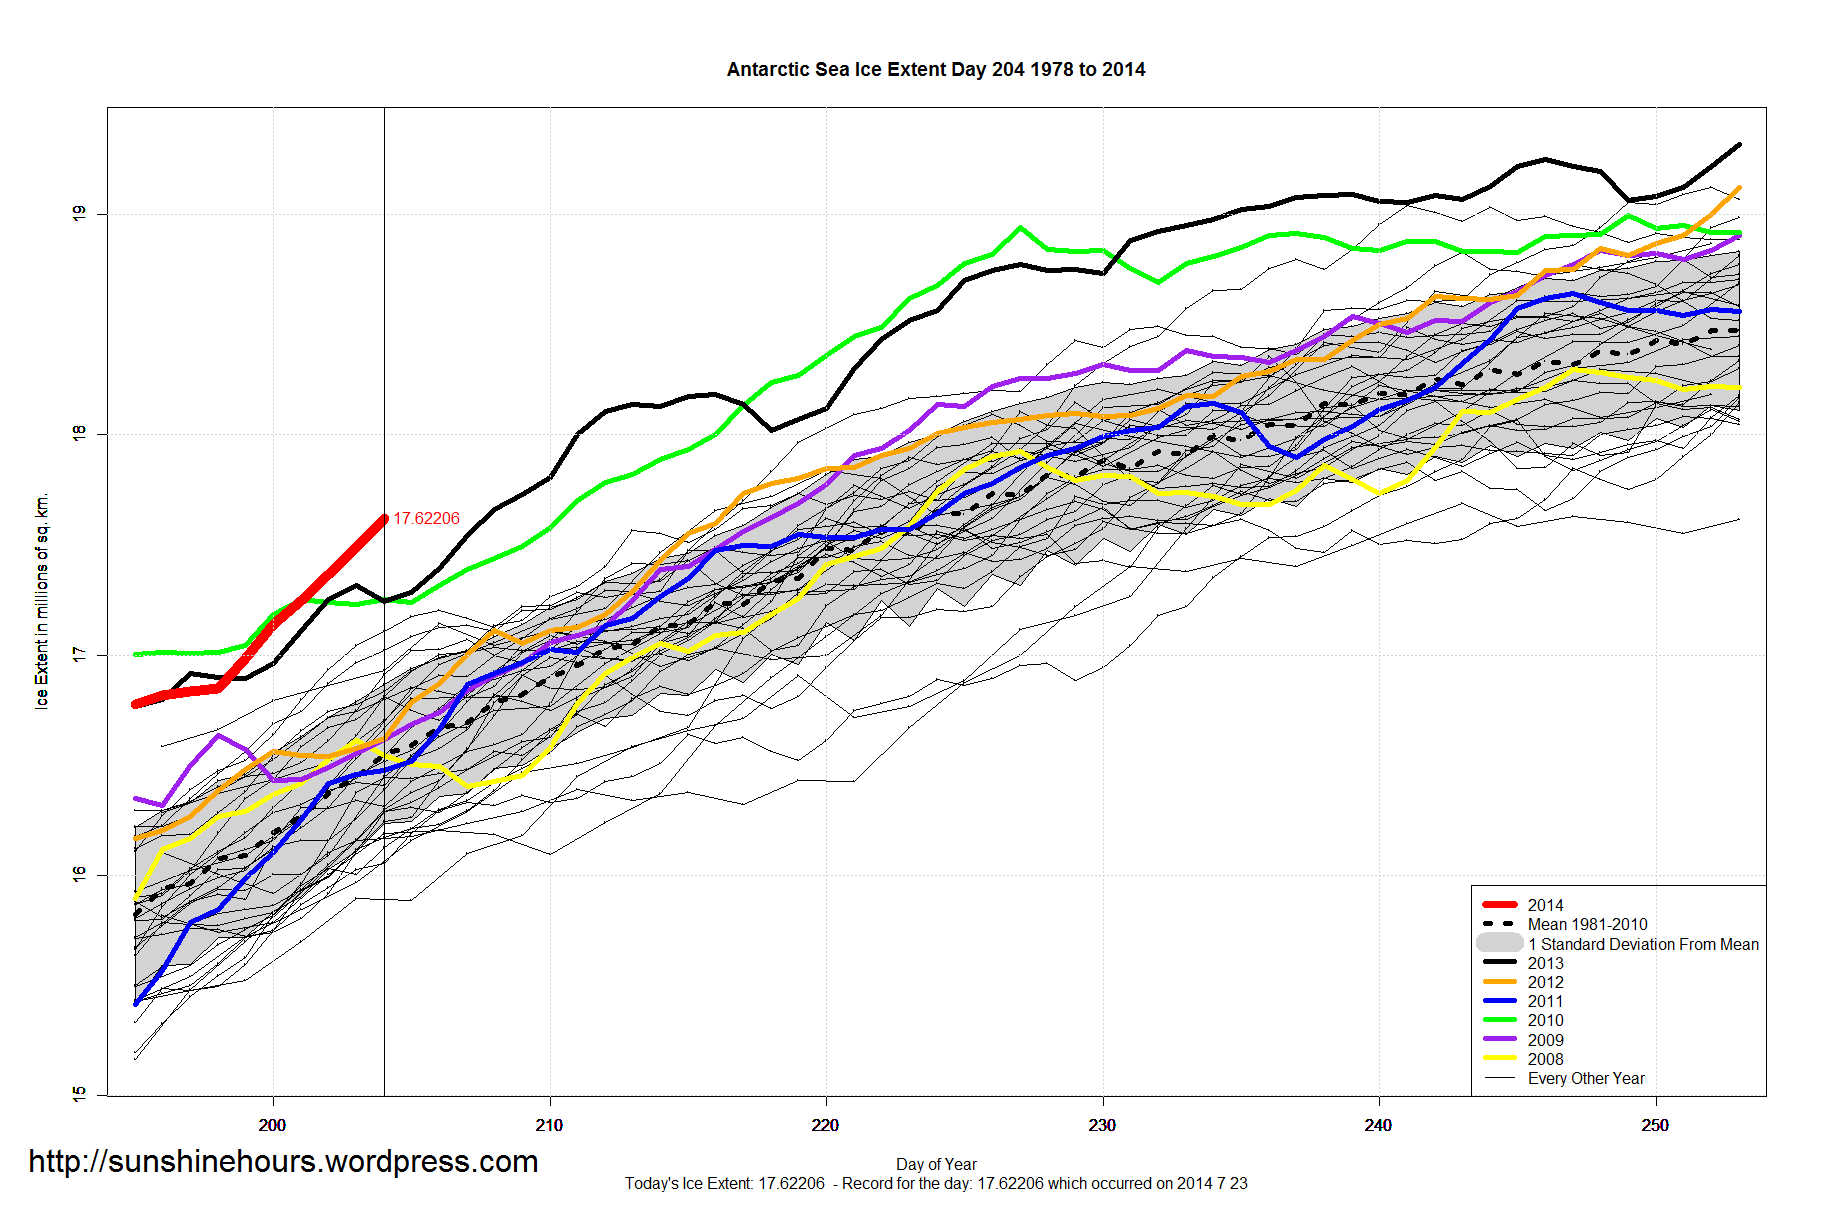
Antarctic Sea Ice Extent is 1,102,000 sq km above the 1981-2010 mean
That smashes the previous daily record by 240,000 sq km. And is also the 126th daily record for the year.