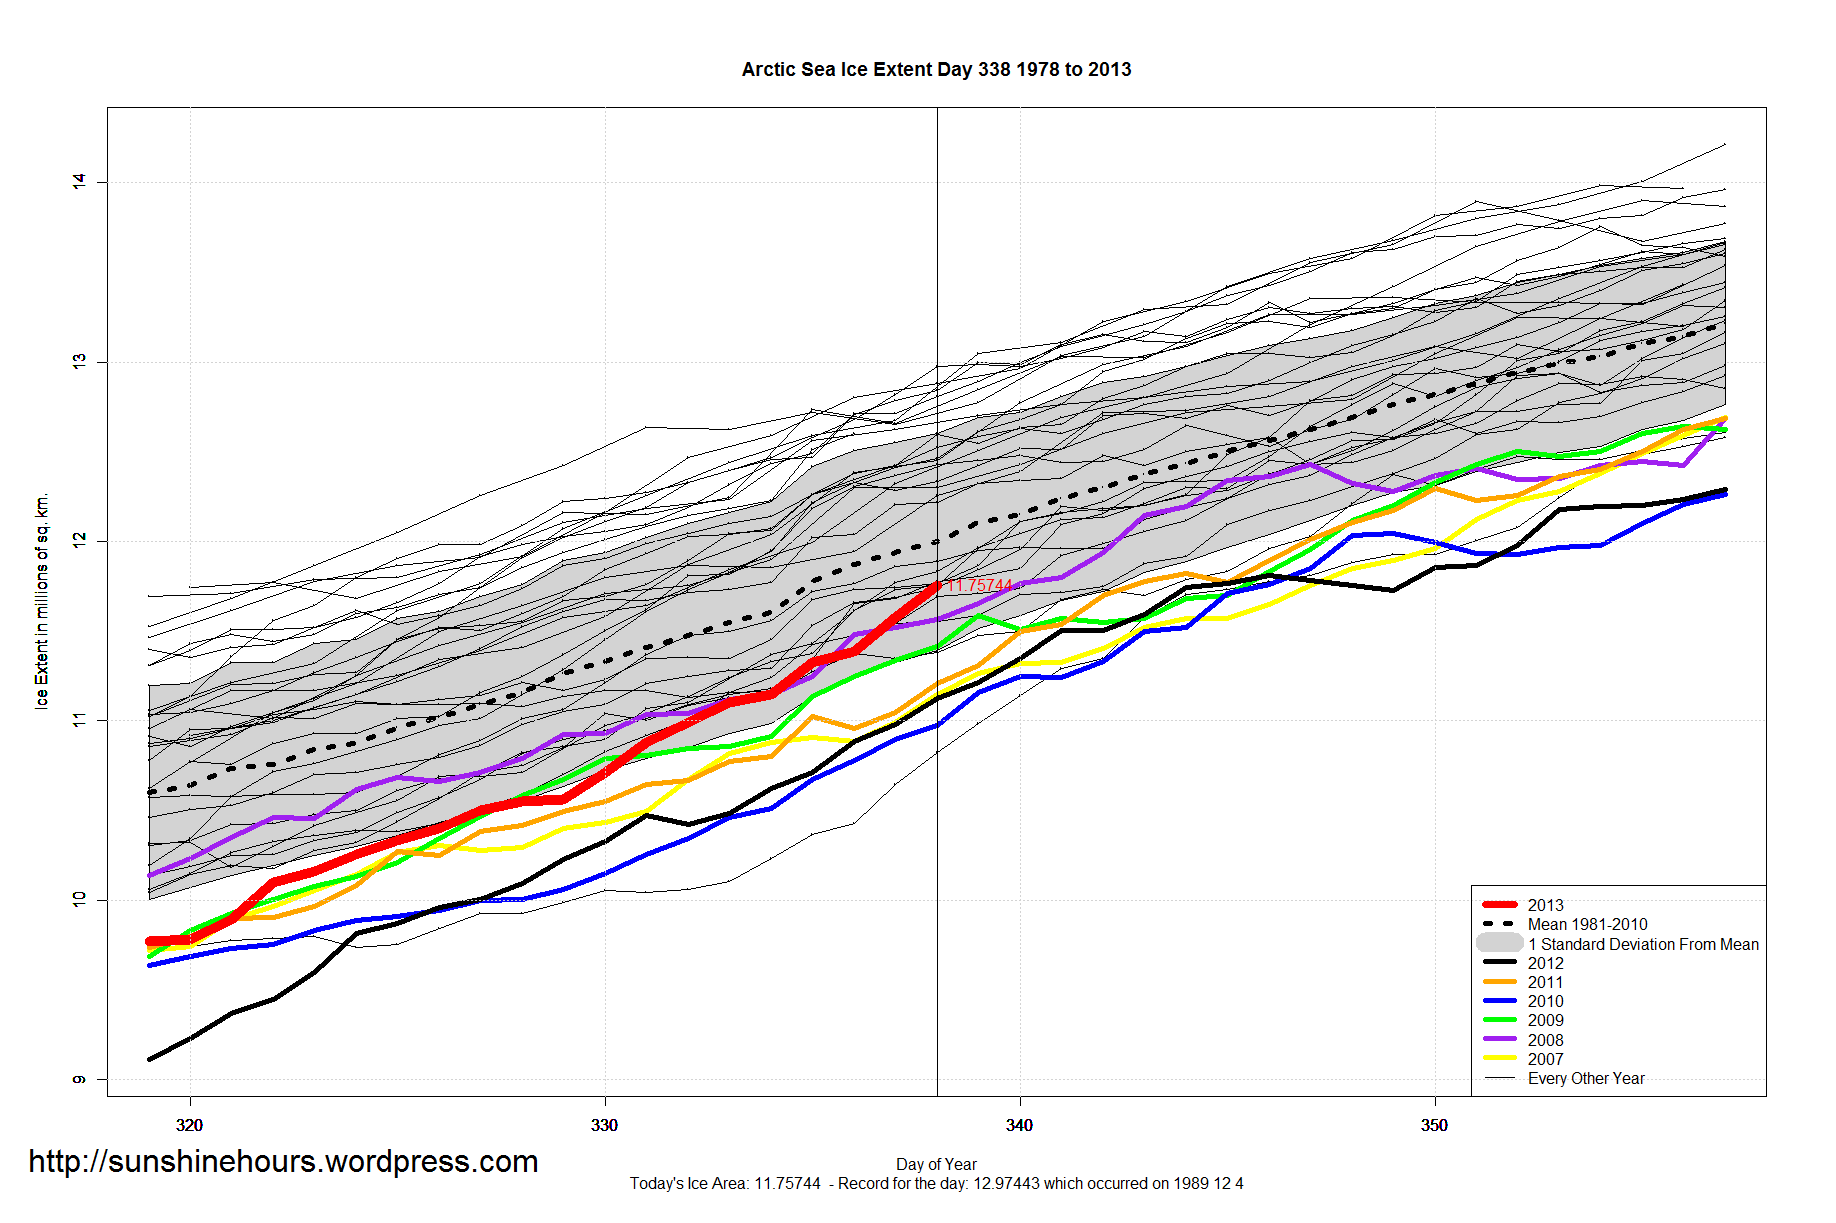
Arctic Sea Ice Extent is Only 240,000 sq km Below 1981-2010 Mean. Which is 2%. And now 2013 is higher than 2 years in the 1990s: 1996 and 1998.
Arctic Sea Ice Extent is Only 240,000 sq km Below 1981-2010 Mean. Which is 2%. And now 2013 is higher than 2 years in the 1990s: 1996 and 1998.
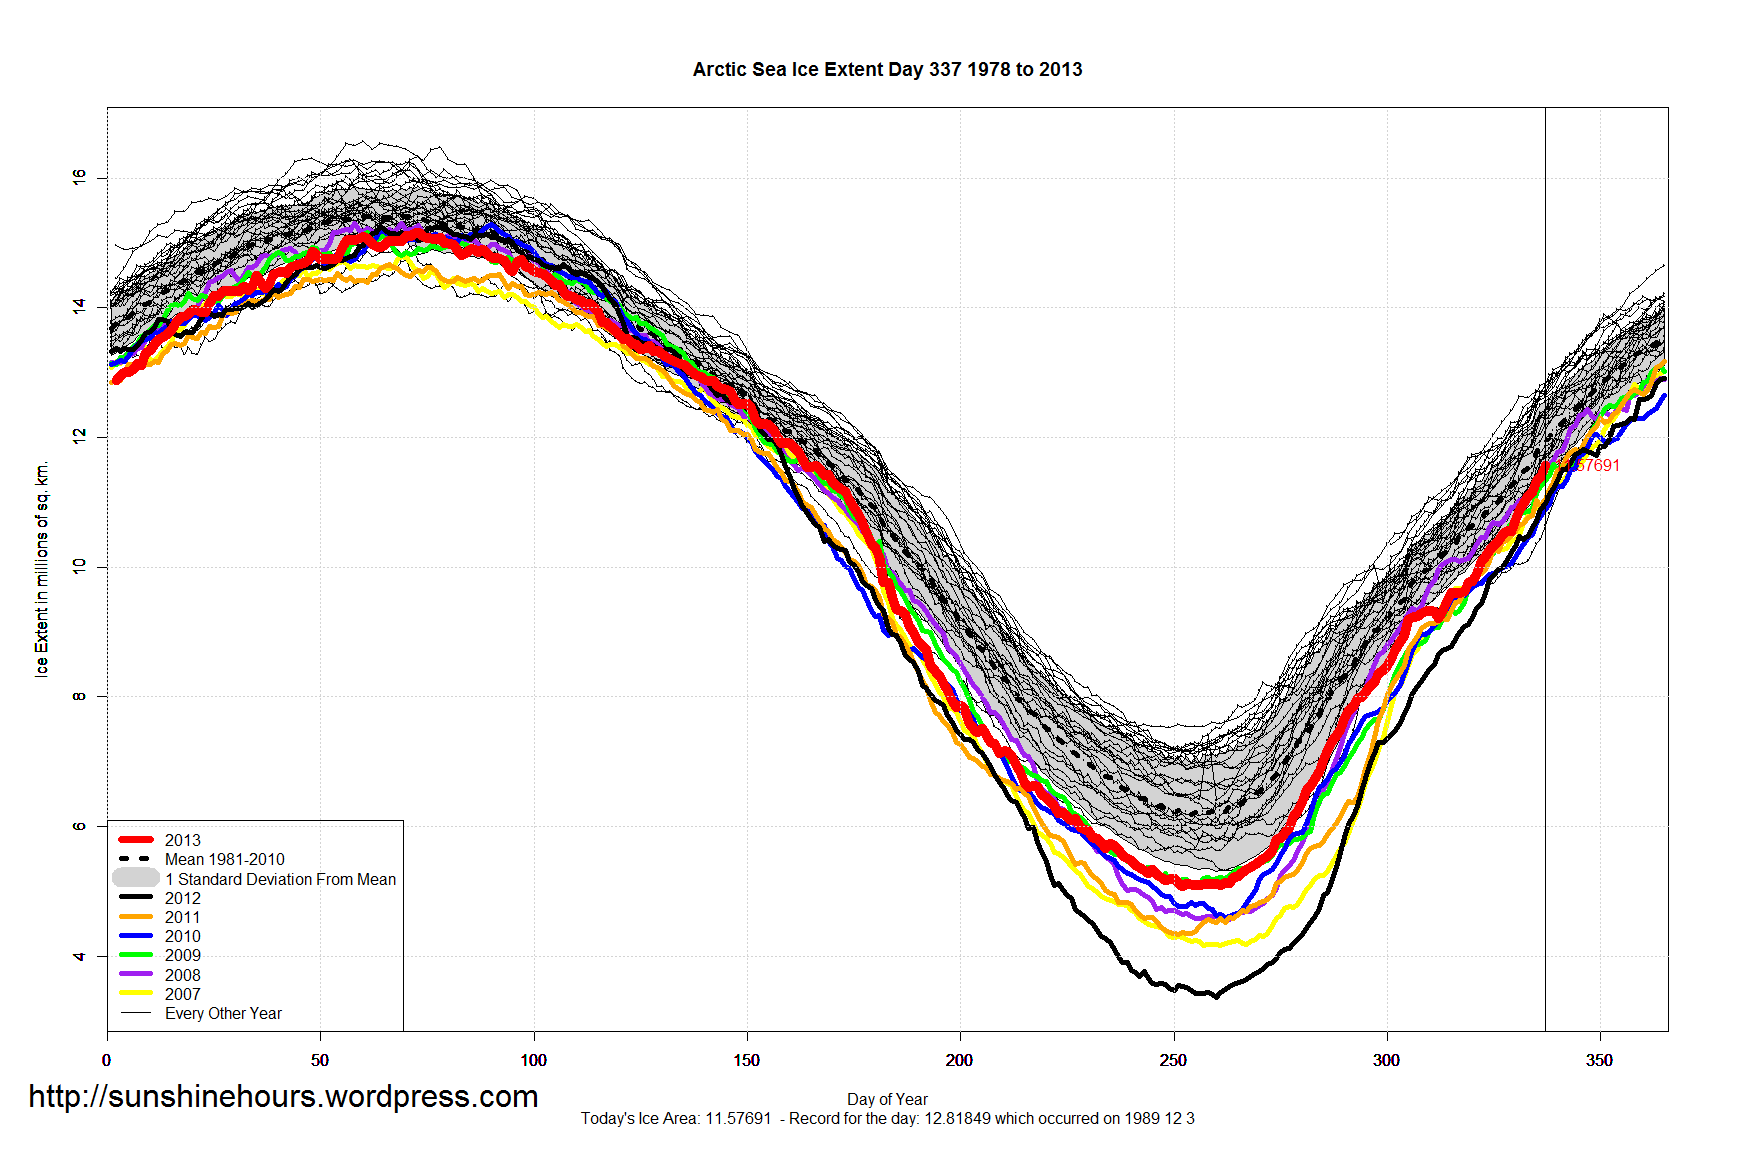
Arctic Sea Ice Extent is well within one standard deviation for this day, and is now heading for the 1981-2010 mean.
2004 was the last time it was higher for this day.

A paper in the Journal For Nature Conservatism points out that the level of Red Kite deaths at wind turbines in German is very high. They estimate 308 deaths in 2012 out of 9972 individual Red Kites.
With the projected increase in wind turbines, and the fact it is young breeding pairs being killed, the whole population may be threatened.
“Mortality from collisions with increasing numbers of wind turbines is a potential hazard to raptor populations, but the actual effects on a population scale have rarely been studied based on field data. We estimated annual collision numbers for Red Kites Milvus milvus in the German federal state of Brandenburg (29,483 km2). A hierarchical model considering carcass persistence rate, searcher efficiency and the probability that a killed animal falls into a searched area was applied to results of carcass searches at 617 turbines. Collision risk varied significantly with season. The model estimated 308 (95% CrI 159–488) Red Kite fatalities at 3044 turbines operating during 2012, representing 3.1% of the estimated post-breeding population of 9972 individuals. Using the potential biological removal (PBR) method, mortality thresholds of 4.0% were obtained for migratory Red Kite populations. This level of mortality may be reached when turbine numbers increase within a few years. Since wind turbine collisions may affect Red Kites throughout the global range, a more detailed assessment of the actual impacts on populations is needed, especially because the PBR does not account for the predominance of adult birds among the collision victims.”
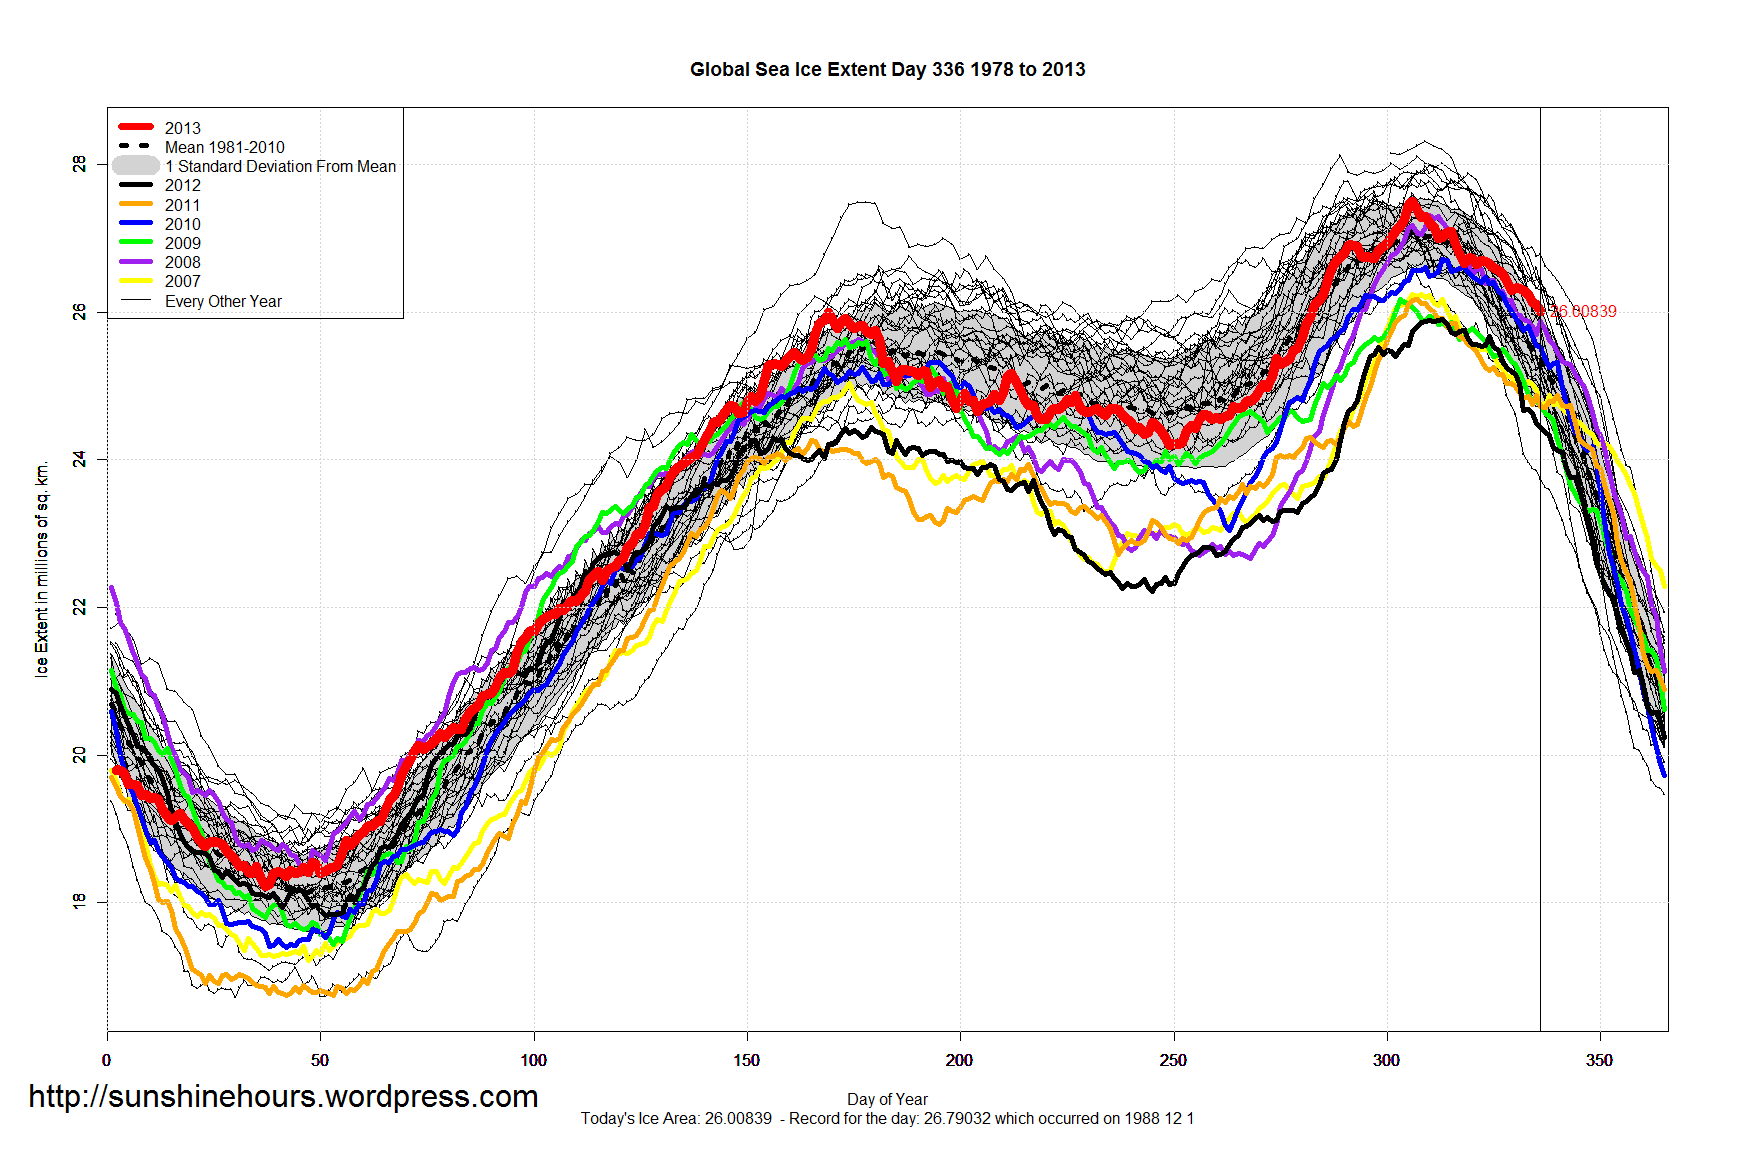
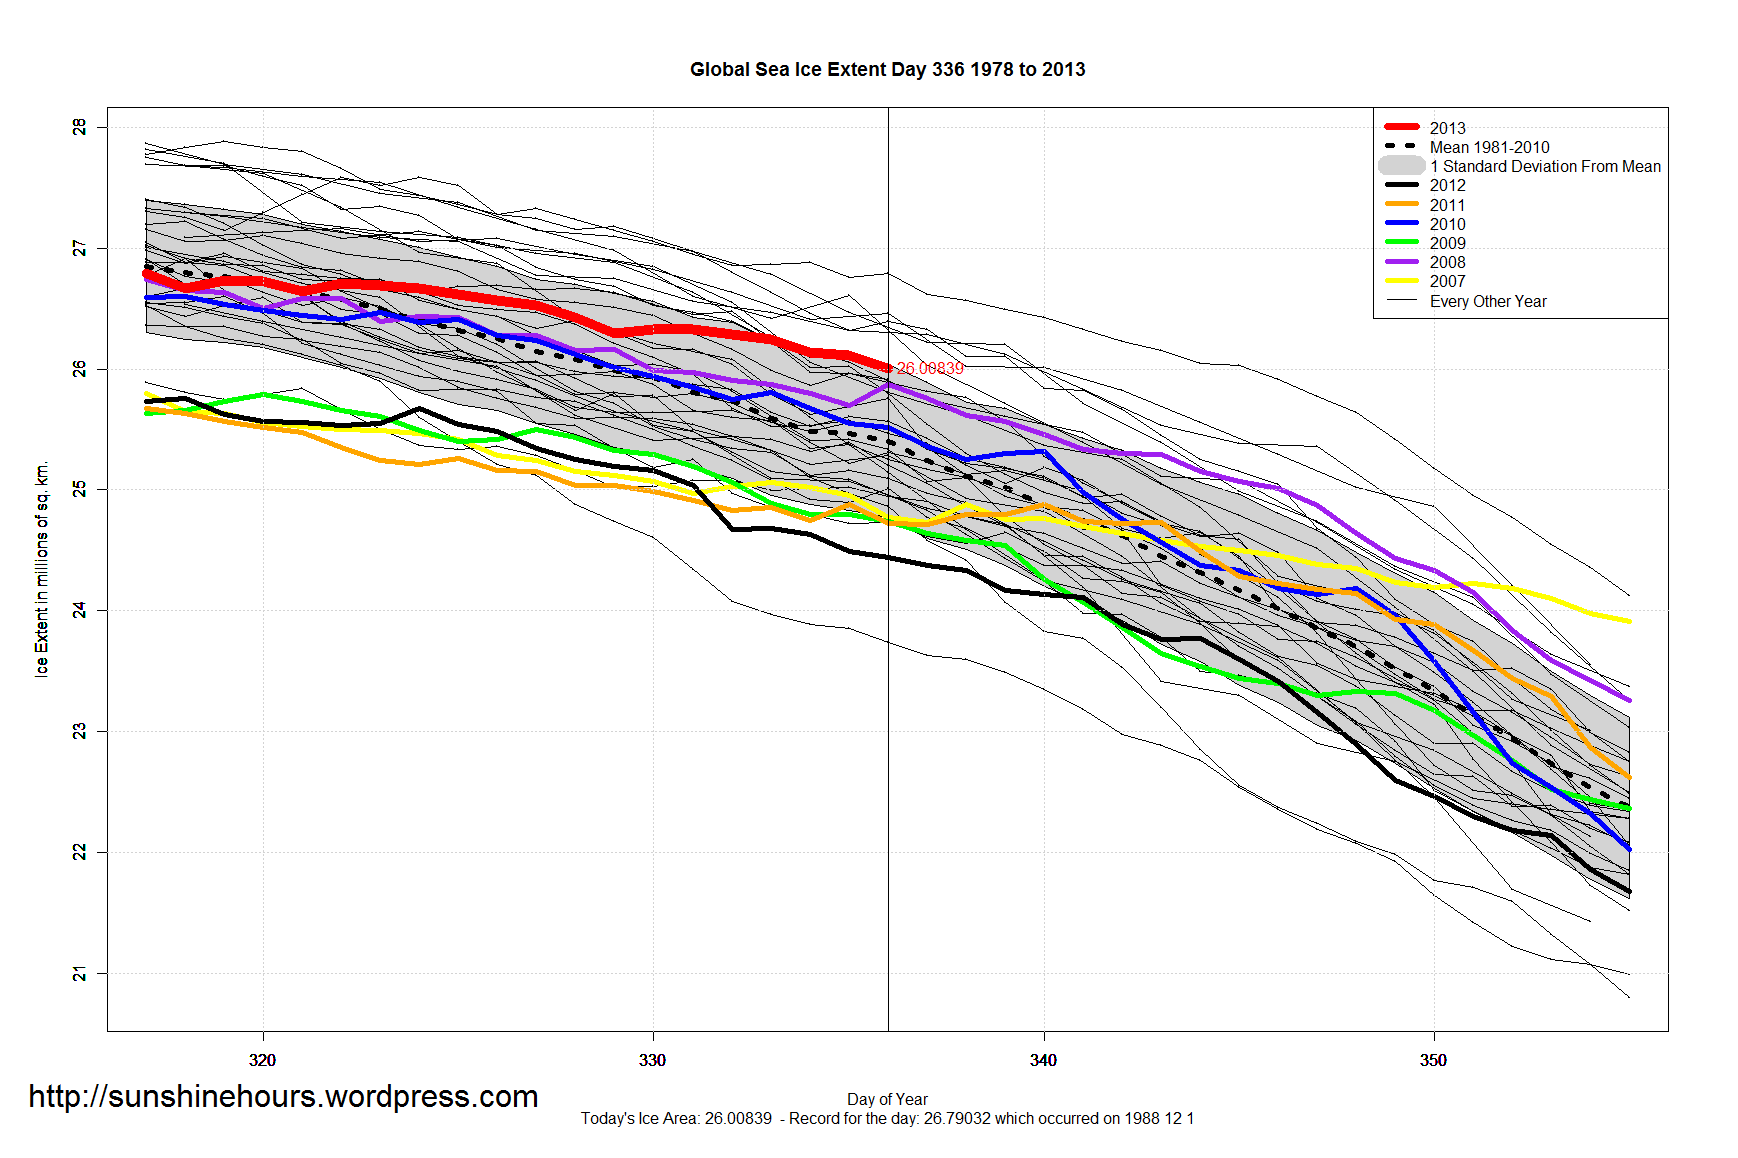
Global Sea Ice is above the 1981-2010 mean by 600,000 sq km.
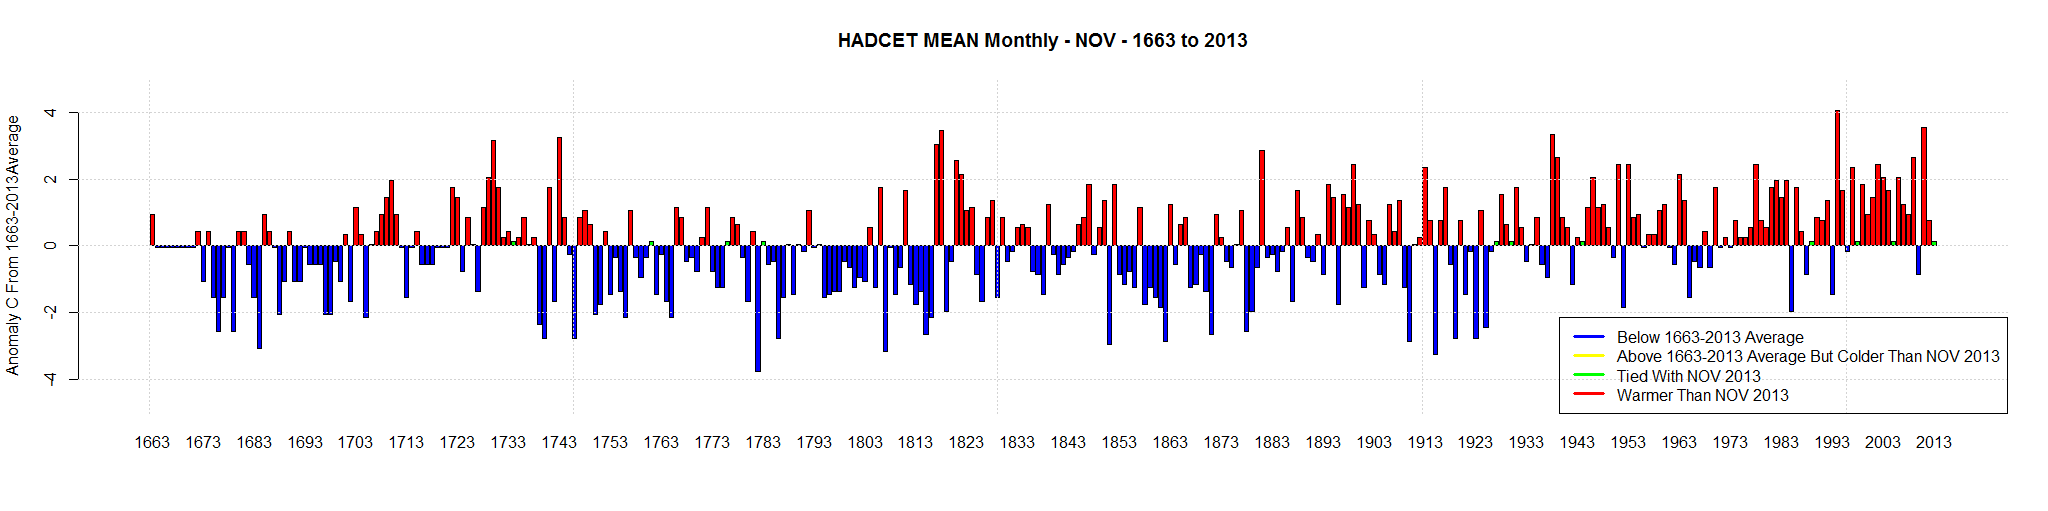
HADCET TMean data goes back to 1663. TMin and TMax data is from 1878.
November 2013 Tmean was slightly above the 350 year average. All the red bars were Novembers warmer than 2013. The green bars were tied with 2013.
The 15 warmest TMean were: 1994,2011,1818,1938,1743,1730,1817,1881,1939,2009,1821,1899,1951,1953,1978. Click images to make bigger.
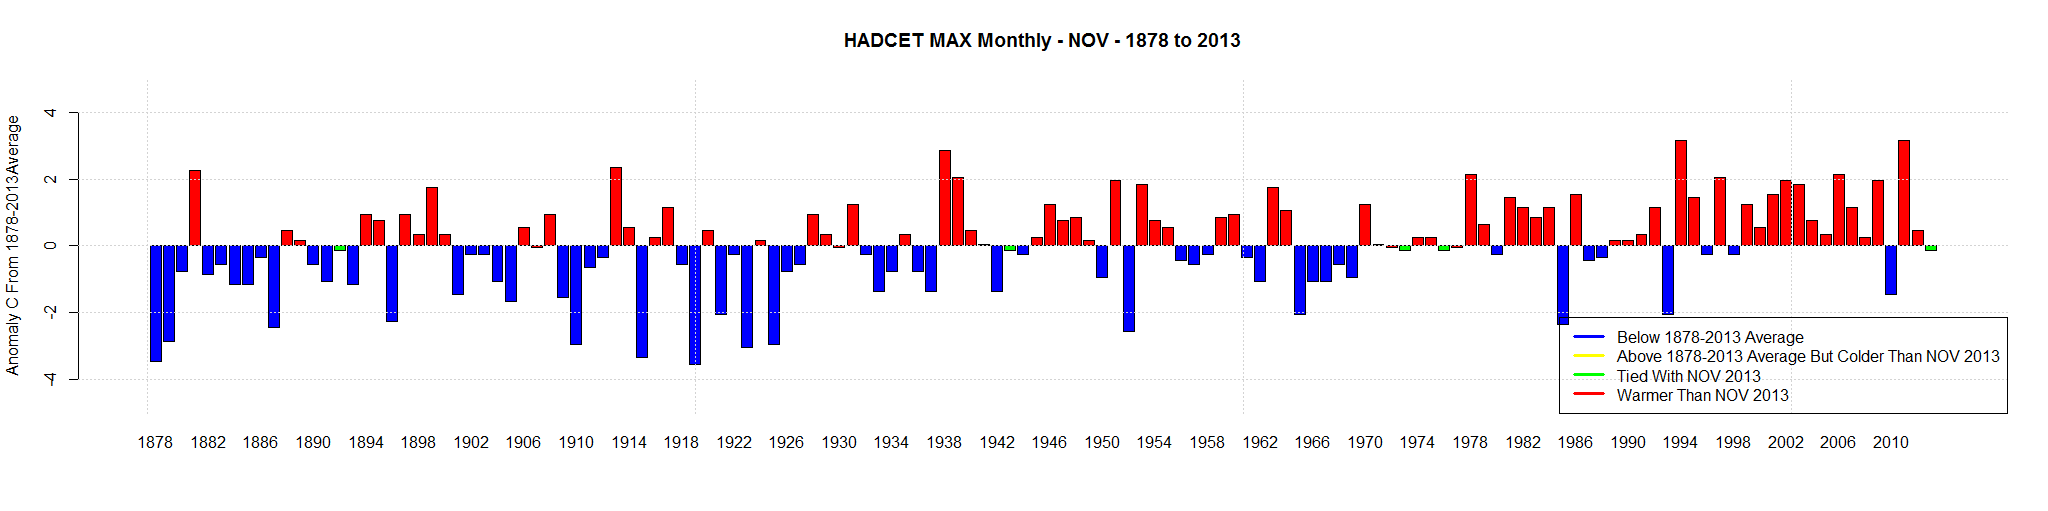
This report is using TMax data for HADCET (Central England Temperature) which is available from 1878.
November 2013 was .82C colder than the 1981-2010 average and .12C colder than the 1878-2013 average.
17 of the days were colder than the 1878-2013 average and 21 were colder than the 1981-2010 average.
Note that 5 of the daily records were from 1938 and 2 of the daily records are from 1895.
| Date | TMax | 1878-2013 Mean | 1878-2013 Anomaly | 1981-2010 Mean | 1981-2010 Anomaly | Warmest Year | Warmest TMax | Difference (Warmest – TMax) |
| 2013-11-1 | 12.2 | 11.4 | 0.8 | 12.6 | -0.4 | 1984 | 16.3 | 4.1 |
| 2013-11-2 | 13.1 | 11.3 | 1.8 | 11.9 | 1.2 | 1927 | 17.7 | 4.6 |
| 2013-11-3 | 11 | 11.1 | -0.1 | 11.9 | -0.9 | 2011 | 16.8 | 5.8 |
| 2013-11-4 | 9.7 | 10.9 | -1.2 | 11.6 | -1.9 | 1946 | 18.7 | 9 |
| 2013-11-5 | 10.5 | 10.8 | -0.3 | 11.6 | -1.1 | 1938 | 17.6 | 7.1 |
| 2013-11-6 | 12.6 | 10.4 | 2.2 | 11.3 | 1.3 | 1972 | 16.1 | 3.5 |
| 2013-11-7 | 10.6 | 10.3 | 0.3 | 11.2 | -0.6 | 1978 | 15.1 | 4.5 |
| 2013-11-8 | 9 | 10.2 | -1.2 | 11.4 | -2.4 | 1998 | 15.5 | 6.5 |
| 2013-11-9 | 7.3 | 10 | -2.7 | 10.9 | -3.6 | 1977 | 15.9 | 8.6 |
| 2013-11-10 | 9.4 | 10.2 | -0.8 | 11.1 | -1.7 | 1977 | 16.2 | 6.8 |
| 2013-11-11 | 12.9 | 10.3 | 2.6 | 11.2 | 1.7 | 1938 | 15.3 | 2.4 |
| 2013-11-12 | 11.4 | 10 | 1.4 | 10.9 | 0.5 | 1938 | 16.3 | 4.9 |
| 2013-11-13 | 9.7 | 9.5 | 0.2 | 10.2 | -0.5 | 1938 | 16.1 | 6.4 |
| 2013-11-14 | 8.7 | 9.1 | -0.4 | 9.9 | -1.2 | 1994 | 14.8 | 6.1 |
| 2013-11-15 | 8.5 | 9 | -0.5 | 10.1 | -1.6 | 1895 | 15.2 | 6.7 |
| 2013-11-16 | 9 | 8.7 | 0.3 | 9.6 | -0.6 | 1895 | 15.7 | 6.7 |
| 2013-11-17 | 9.5 | 8.5 | 1 | 9.2 | 0.3 | 1997 | 14.8 | 5.3 |
| 2013-11-18 | 8.5 | 8.6 | -0.1 | 9.5 | -1 | 1978 | 15.2 | 6.7 |
| 2013-11-19 | 6.5 | 8.7 | -2.2 | 9 | -2.5 | 1994 | 15.6 | 9.1 |
| 2013-11-20 | 6.7 | 8.6 | -1.9 | 8.7 | -2 | 1947 | 15.3 | 8.6 |
| 2013-11-21 | 8.2 | 8.4 | -0.2 | 8.8 | -0.6 | 1947 | 15.7 | 7.5 |
| 2013-11-22 | 7.5 | 8.5 | -1 | 8.6 | -1.1 | 1906 | 15.4 | 7.9 |
| 2013-11-23 | 5.6 | 8.6 | -3 | 8.7 | -3.1 | 1947 | 14.3 | 8.7 |
| 2013-11-24 | 7.3 | 8.7 | -1.4 | 9.2 | -1.9 | 1980 | 14 | 6.7 |
| 2013-11-25 | 6 | 8.5 | -2.5 | 9.1 | -3.1 | 1983 | 13.8 | 7.8 |
| 2013-11-26 | 8.8 | 8.2 | 0.6 | 8.8 | 0 | 1979 | 14.5 | 5.7 |
| 2013-11-27 | 10.6 | 8.2 | 2.4 | 8.8 | 1.8 | 2000 | 13.6 | 3 |
| 2013-11-28 | 9 | 8.1 | 0.9 | 8.5 | 0.5 | 2000 | 14.7 | 5.7 |
| 2013-11-29 | 9.5 | 8 | 1.5 | 8.4 | 1.1 | 1939 | 14 | 4.5 |
| 2013-11-30 | 7.7 | 7.8 | -0.1 | 8.9 | -1.2 | 2001 | 14.3 | 6.6 |
Yup. Thats why I call the AGW Cult a cult.
“Lord (Nigel) Lawson, chairman of the Global Warming Policy Foundation, partly lifts the veil on a curious “secret meeting” held at the House of Lords between a team from his GWPF and six scientists from the Royal Society. ”
“As one present put it, “it was like talking to members of a cult”. What particularly struck the GWPF team was their opposite numbers’ refusal to discuss the policy implications of their beliefs”
I know March was months ago. But I’m playing around with a new report and I thought I would look at TMax data for HADCET (Central England Temperature). TMax data is only available since 1878.
23 out of the 31 days were colder than the warmest day (since 1878) by double digits. March 23rd was 18.6C colder than the warmest March 23rd.
| Date | TMax 2013 | Warmest Year | Warmest TMax | Difference (Warmest – 2013) |
| 2013-3-1 | 6.8 | 1959 | 14.9 | 8.1 |
| 2013-3-2 | 6.4 | 1977 | 16.5 | 10.1 |
| 2013-3-3 | 7.5 | 1957 | 14.3 | 6.8 |
| 2013-3-4 | 8.9 | 1928 | 16 | 7.1 |
| 2013-3-5 | 13.8 | 1961 | 16 | 2.2 |
| 2013-3-6 | 9.1 | 1961 | 15.3 | 6.2 |
| 2013-3-7 | 8.8 | 1906 | 14.9 | 6.1 |
| 2013-3-8 | 8 | 1961 | 15.1 | 7.1 |
| 2013-3-9 | 5.3 | 1948 | 19.9 | 14.6 |
| 2013-3-10 | 2.7 | 1929 | 17.4 | 14.7 |
| 2013-3-11 | 1.2 | 1957 | 18.4 | 17.2 |
| 2013-3-12 | 4.1 | 1957 | 18.4 | 14.3 |
| 2013-3-13 | 6 | 1991 | 17.2 | 11.2 |
| 2013-3-14 | 6.7 | 1948 | 17.9 | 11.2 |
| 2013-3-15 | 8.1 | 1961 | 17.9 | 9.8 |
| 2013-3-16 | 8.5 | 1961 | 20 | 11.5 |
| 2013-3-17 | 6.8 | 1990 | 19.3 | 12.5 |
| 2013-3-18 | 6.5 | 1990 | 19.6 | 13.1 |
| 2013-3-19 | 7.1 | 1972 | 17.6 | 10.5 |
| 2013-3-20 | 3.9 | 1929 | 17.5 | 13.6 |
| 2013-3-21 | 4.9 | 1927 | 17.8 | 12.9 |
| 2013-3-22 | 3.6 | 1918 | 16.3 | 12.7 |
| 2013-3-23 | 0.8 | 1945 | 19.4 | 18.6 |
| 2013-3-24 | 1.2 | 2012 | 18.9 | 17.7 |
| 2013-3-25 | 2.7 | 1953 | 19.1 | 16.4 |
| 2013-3-26 | 2.3 | 2012 | 18.8 | 16.5 |
| 2013-3-27 | 3 | 2012 | 19.5 | 16.5 |
| 2013-3-28 | 4.3 | 1929 | 20.3 | 16 |
| 2013-3-29 | 4.8 | 1965 | 22.1 | 17.3 |
| 2013-3-30 | 5.9 | 1929 | 19 | 13.1 |
| 2013-3-31 | 5.7 | 1907 | 18.7 | 13 |
“The summer Australian Antarctic Division program will have to be modified because its icebreaker the Aurora Australis has been delayed in heavy ice.
The ship was due to return to Hobart more than a week ago after a resupply mission, but it is still navigating through heavy ice about 180 nautical miles off the Davis research station.’
As of day 329 of 2013, the number of daily records and 2nd place finishes puts 2013 well out in front, but 2008 (typo corrected) still holds the most daily records.
I include 2nd place finishes to show you how remarkable 2013 has been. For 70% of the year, sea extent in the Antarctic has been a daily record or a close 2nd. And that is unusual as you see by the relatively paltry number of 2nd place days in 2008 and 2010. And of couse many of those 2nd place spots for 2010 were daily records before 2013 came along.
| Year | First | Second | Top2 |
| 2013 | 105 | 125 | 230 |
| 2008 | 123 | 49 | 172 |
| 2010 | 91 | 42 | 133 |
| 2009 | 8 | 33 | 41 |
| 2012 | 8 | 22 | 30 |
| 2006 | 1 | 26 | 27 |
| 2007 | 21 | 1 | 22 |
| 1979 | 2 | 12 | 14 |
| 2000 | 4 | 3 | 7 |
| 2004 | 3 | 4 | 7 |
Of course, there were a lot more records for 2008 and 2010 before January 1st.
This table is the number of 1st and 2nd place finishes at the end of 2012:
| Year | First | Second | Top2 |
| 2008 | 133 | 50 | 183 |
| 2010 | 129 | 27 | 156 |
| 2009 | 8 | 51 | 59 |
| 2006 | 27 | 28 | 55 |
| 2012 | 27 | 13 | 40 |
| 2005 | 3 | 21 | 24 |
| 2007 | 21 | 2 | 23 |
| 1979 | 2 | 20 | 22 |
| 2000 | 6 | 15 | 21 |
| 1998 | 4 | 16 | 20 |
| 2004 | 5 | 4 | 9 |
| 1980 | 1 | 3 | 4 |
