According to the NOAA, May 2015 was ranked 49th coldest out of 121.
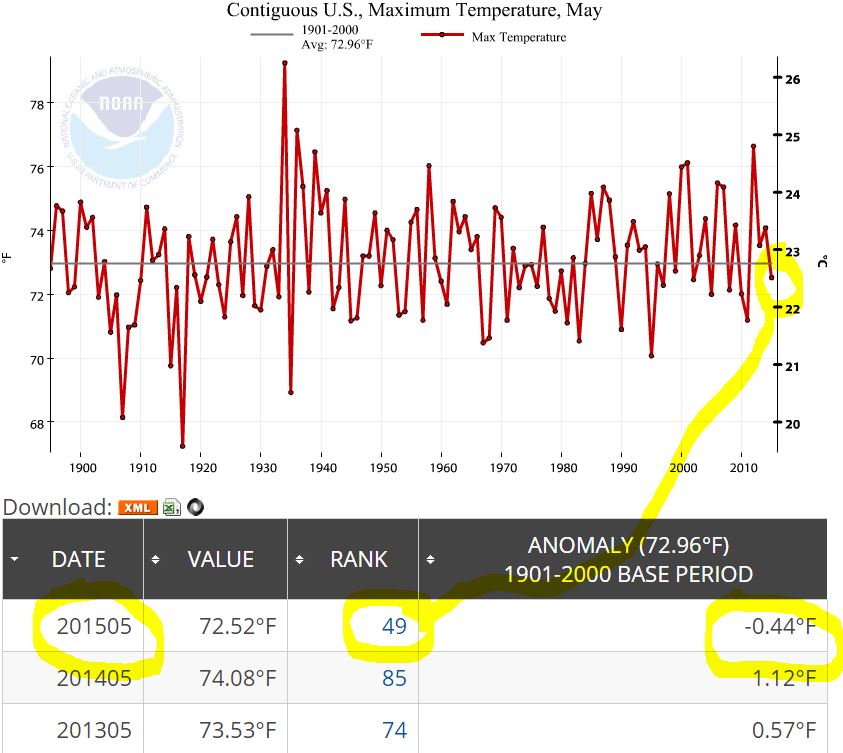
According to the NOAA, May 2015 was ranked 49th coldest out of 121.
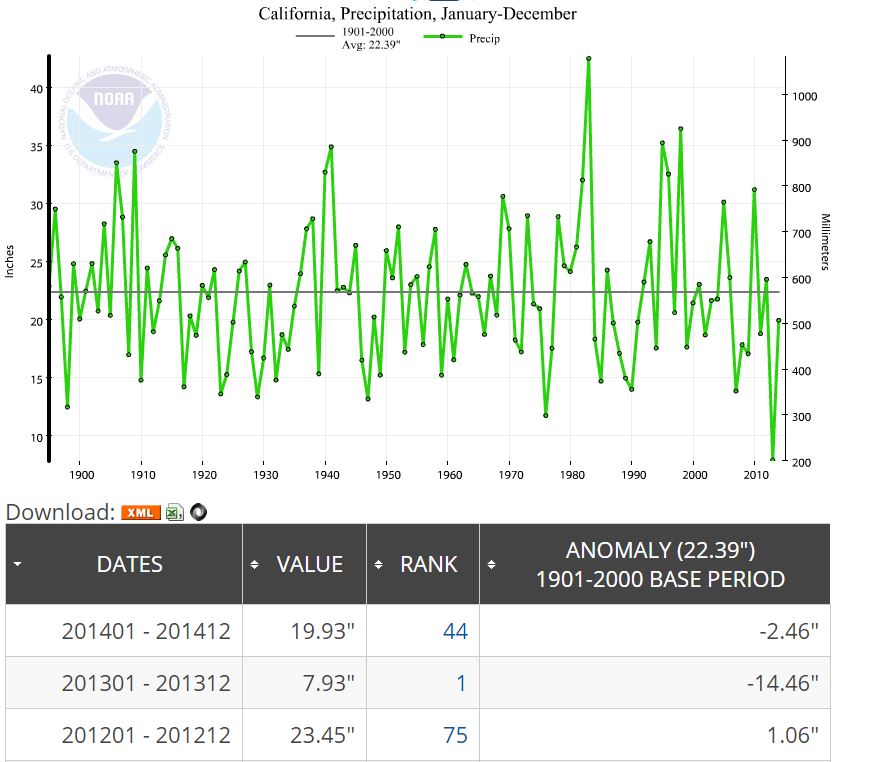
According to the NOAA, 2014 precipitation in California was -2.46″ below the 1901-2000 average.
That is Only 11%. What Megadrought? (The real problem is a doubling of population and no big dams built since 1982).
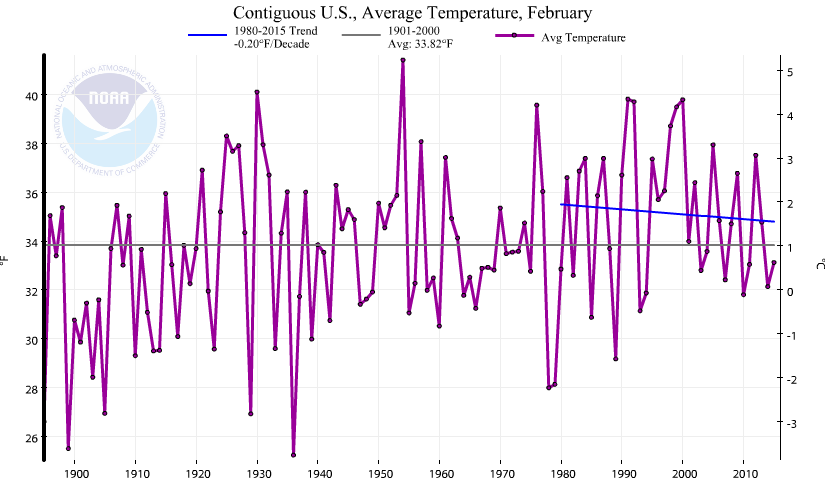
February’s in the USA have been cooling for over 30 years.
February 2015 was ranked 53 out of 121 (121 being warmest).
Ooops: This post originally said “Low Min”. The values are “Low Max”.
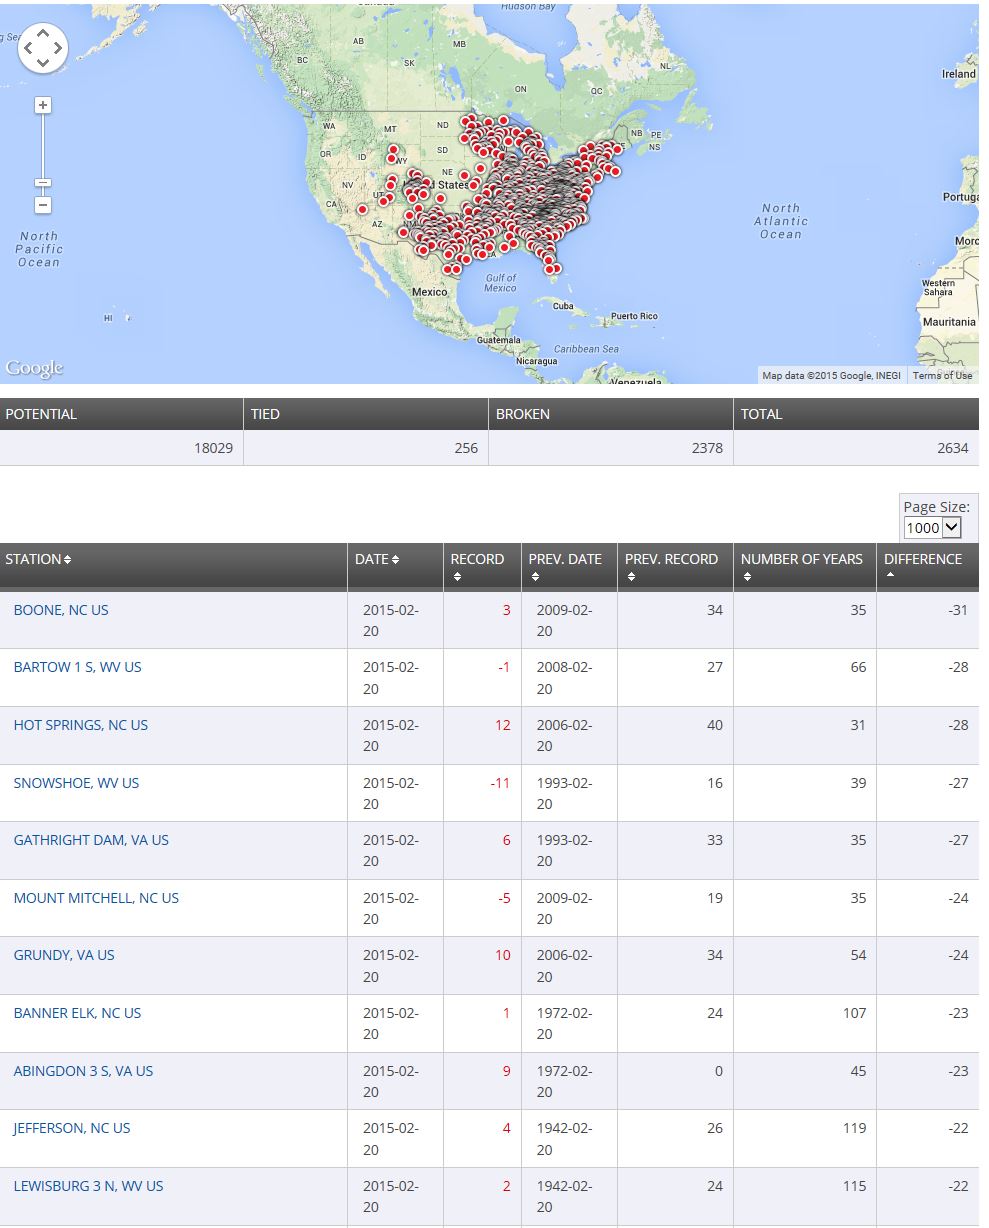
759 Low Max Records Broken or tied in last 3 Days according to the NOAA.
Below is a screenshot showing location and the biggest difference between old record and new record.
The list is just the ones I could capture in a screenshot. Wow. Many records broken by over 20F.
Some of the records broken were over 100 years old.

(This is a different post than the Low Min one)
Low Max records track the lowest maximum temperature for the day.
2634 Low Max Records Broken or tied From 2015-02-19 to 2015-02-25 according to the NOAA. (That is 15% of all the measurements for that period)
Below is a screenshot showing location and the biggest difference between old record and new record.
The list is just the ones I could capture in a screenshot. Wow. Many records broken by over 20F.
UPDATE #2 – Even more records have been broken.
UPDATE: I also have a blog post on the LOW MAX records.
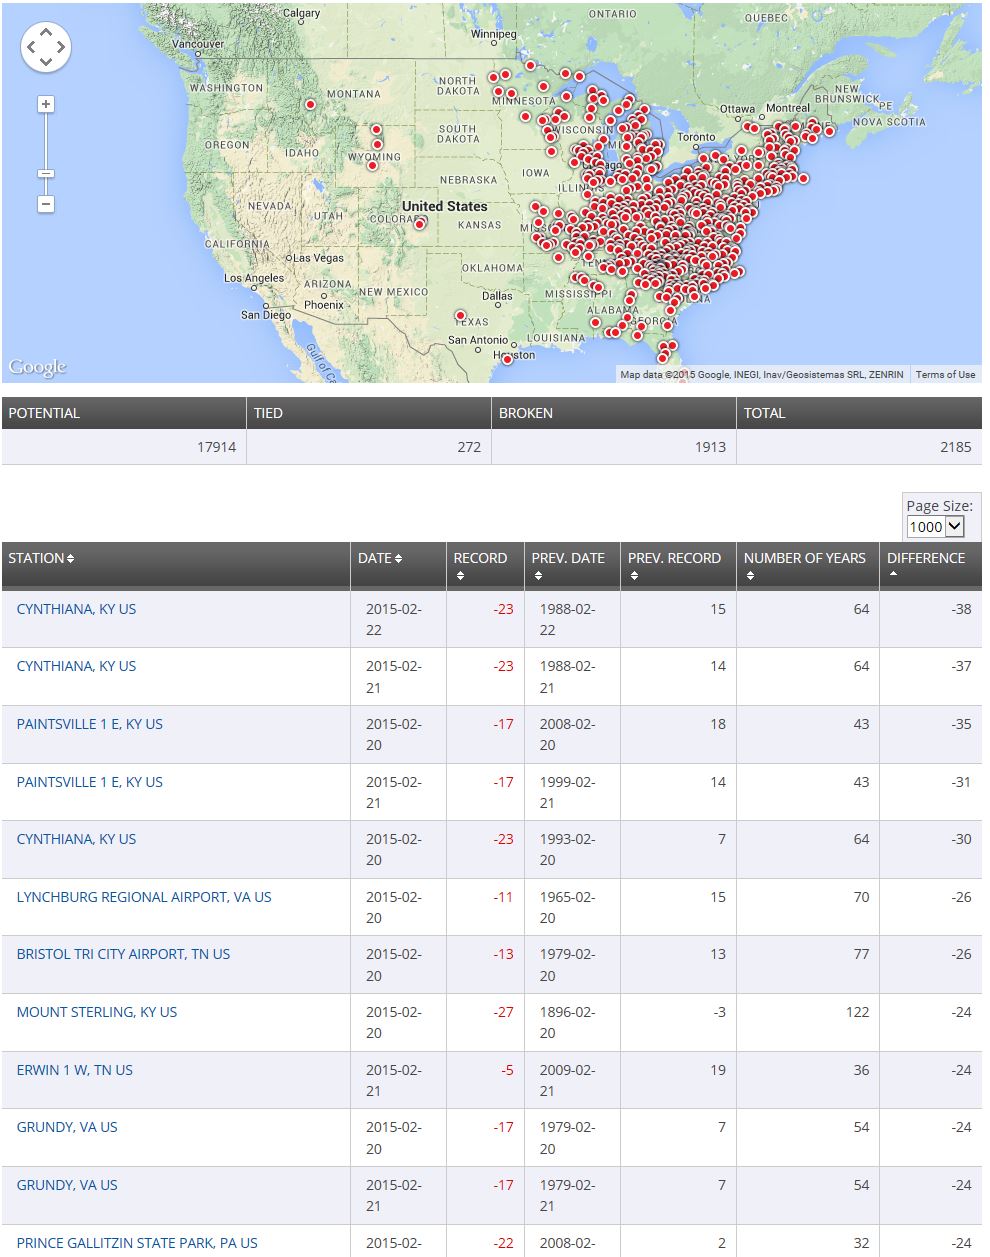
1913 Low Min Records Broken in Last 7 Days (272 tied) according to the NOAA.
Below is a screenshot showing location and the biggest difference between old record and new record.
The list is just the ones I could capture in a screenshot. Wow. Many records broken by over 30F.
Oooops: I initially used C/Decade. It is F/Decade.And I have to check the Trend.
Update: The trend is correct once I corrected the units.
Update: Here is a link to NOAA for California. Ohio is doing the opposite since 1998.
January 2015 Tmax Ordered By State Rank
Only 6 States in the top 10. Only 9 in the top 20. 27 out of 48 have a rank of less than 61 (the middle of 121).
And note that 15 states January’s are cooling since 1895 .
And 38 states January’s are cooling since 1998.
| State | Rank (1 = Hottest) | Trend Since 1895 in F/Decade | Trend Since 1998 in F/Decade |
| Oregon | 1 | 0.45 | 1.86 |
| California | 3 | 0.36 | 2.66 |
| Nevada | 4 | 0.29 | 0.79 |
| Utah | 8 | 0.31 | -1.6 |
| Wyoming | 8 | 0.38 | -0.15 |
| Idaho | 9 | 0.26 | 0.33 |
| Washington | 11 | 0.38 | 0.28 |
| Arizona | 19 | 0.34 | -0.63 |
| Colorado | 19 | 0.23 | -0.96 |
| Montana | 22 | 0.44 | 0.83 |
| North Dakota | 23 | 0.45 | 0.85 |
| South Dakota | 25 | 0.3 | -0.61 |
| Minnesota | 27 | 0.24 | -1.38 |
| Kansas | 28 | 0.2 | 0.06 |
| Nebraska | 29 | 0.2 | -1.02 |
| Iowa | 31 | 0.01 | -1.3 |
| Missouri | 44 | -0.03 | -0.62 |
| Oklahoma | 49 | 0.11 | 0.05 |
| Florida | 51 | 0.05 | -0.54 |
| New Mexico | 56 | 0.23 | -1.67 |
| Wisconsin | 60 | 0.12 | -2.32 |
| Arkansas | 68 | -0.11 | -1.43 |
| Illinois | 68 | -0.06 | -1.8 |
| North Carolina | 68 | -0.06 | -1.75 |
| Georgia | 71 | -0.01 | -1.63 |
| South Carolina | 71 | -0.04 | -1.48 |
| Virginia | 71 | -0.02 | -2.29 |
| Alabama | 73 | -0.17 | -1.65 |
| Mississippi | 73 | -0.19 | -1.64 |
| Delaware | 75 | 0.07 | -2.16 |
| Indiana | 78 | -0.13 | -2.57 |
| Kentucky | 78 | -0.15 | -2.67 |
| Maine | 78 | 0.13 | 0.3 |
| Maryland | 79 | 0.06 | -2.46 |
| New Jersey | 79 | 0.17 | -2.12 |
| Tennessee | 79 | -0.18 | -2.24 |
| Louisiana | 80 | -0.12 | -2.02 |
| Michigan | 81 | 0.13 | -1.92 |
| West Virginia | 82 | -0.16 | -2.84 |
| New Hampshire | 85 | 0.08 | -0.63 |
| New York | 85 | 0.06 | -1.18 |
| Vermont | 86 | 0.04 | -0.66 |
| Connecticut | 87 | 0.1 | -1.24 |
| Ohio | 88 | -0.09 | -2.85 |
| Massachusetts | 89 | 0.11 | -1 |
| Pennsylvania | 89 | 0.04 | -2.6 |
| Texas | 90 | 0.05 | -2.3 |
| Rhode Island | 92 | 0.13 | -1.14 |
A rank of 121 in Oregon indicates the warmest (since NOAA records started in 1895). This data is Maximum temperature average for the month..
On the other hand, a rank of 30 indicates 91 January’s were warmer.
es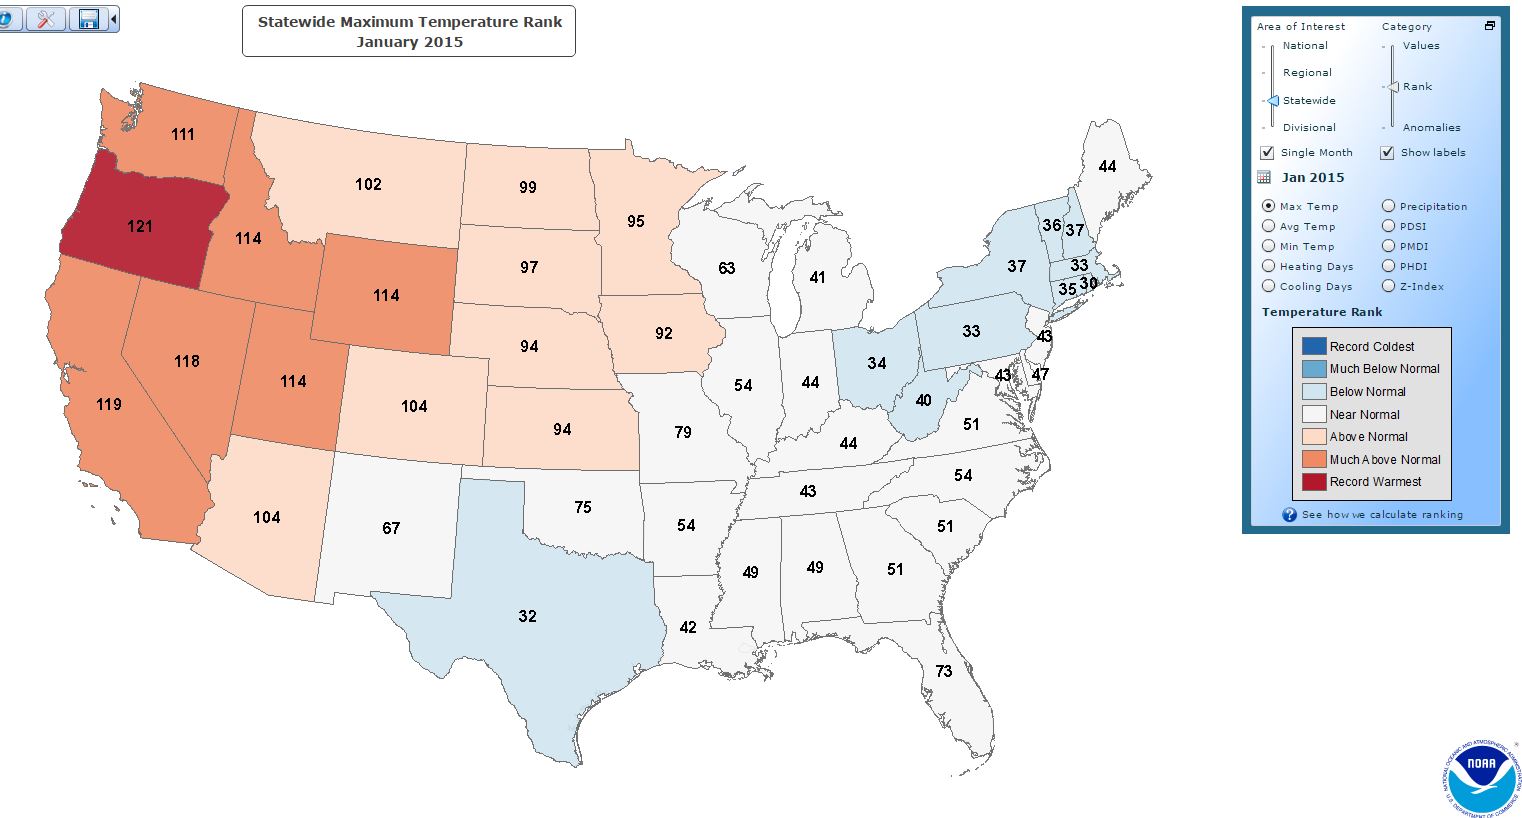
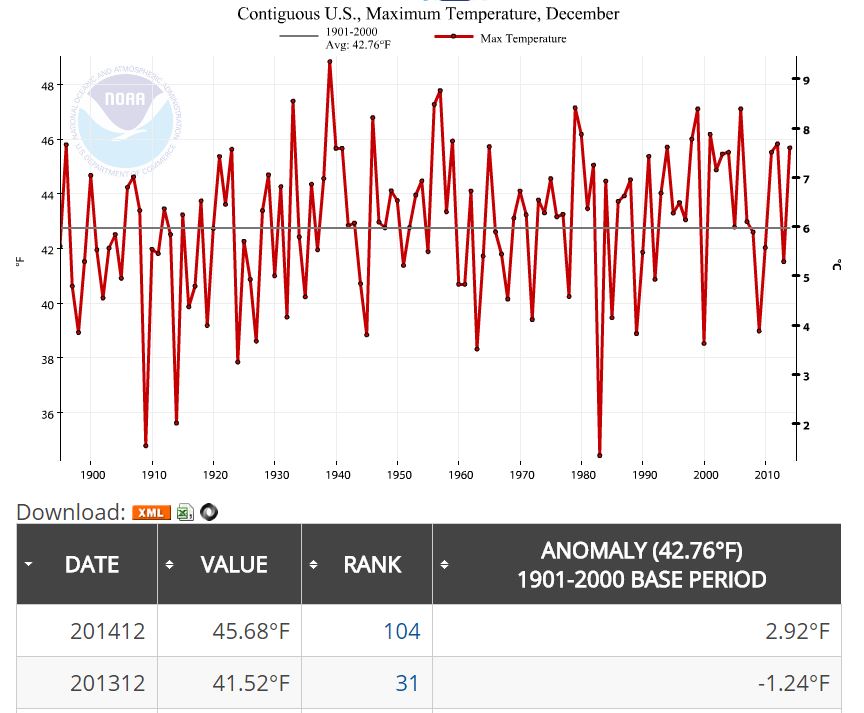
Using Tmax, 2014 was 2.41F Colder Than December 1934 and 3.34F colder than December 2012.

Using Tmax, December 2014 was 3.15F Colder Than December 1939.
Even December 1896 was warmer than December 2014. Warm Decembers are pretty spread out over the last 120 years.