Every once in a while I visit the data for the weather station closest to my hometown on the west coast of Canada.
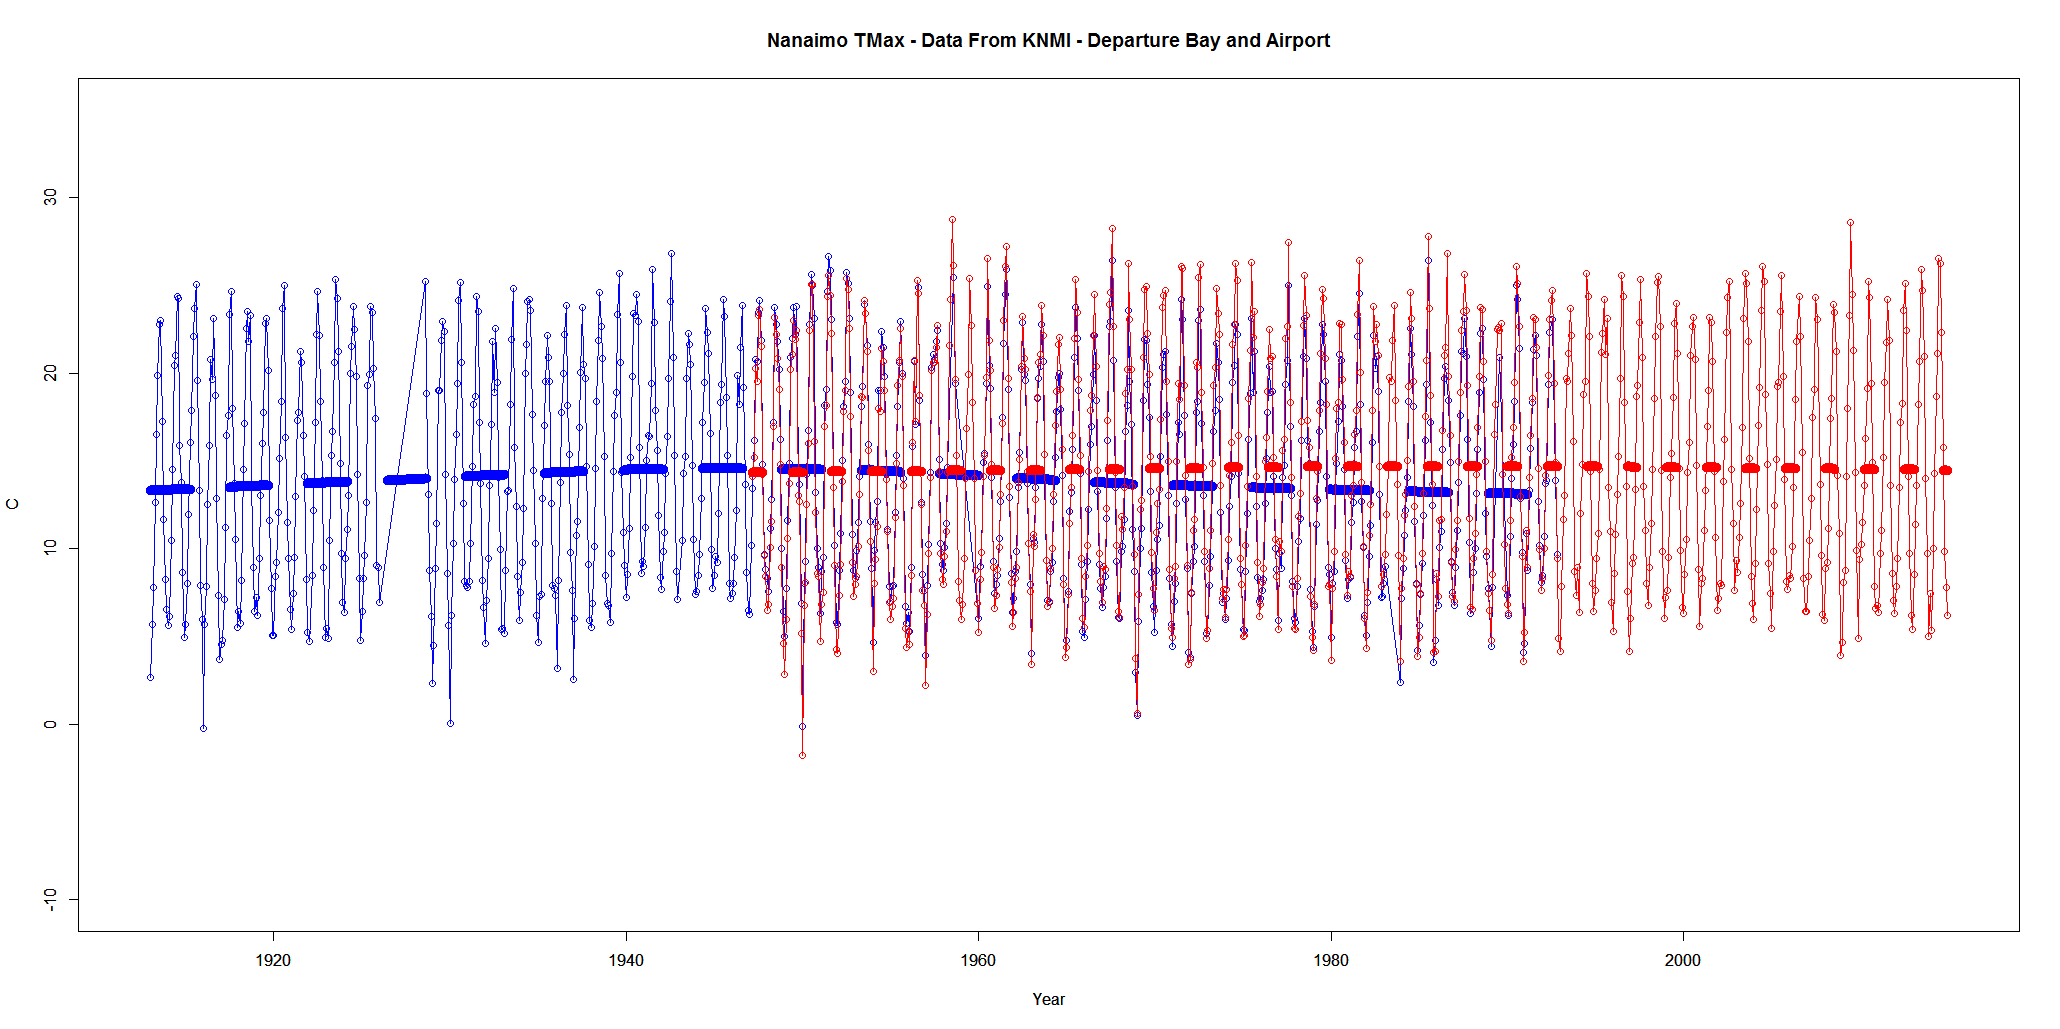
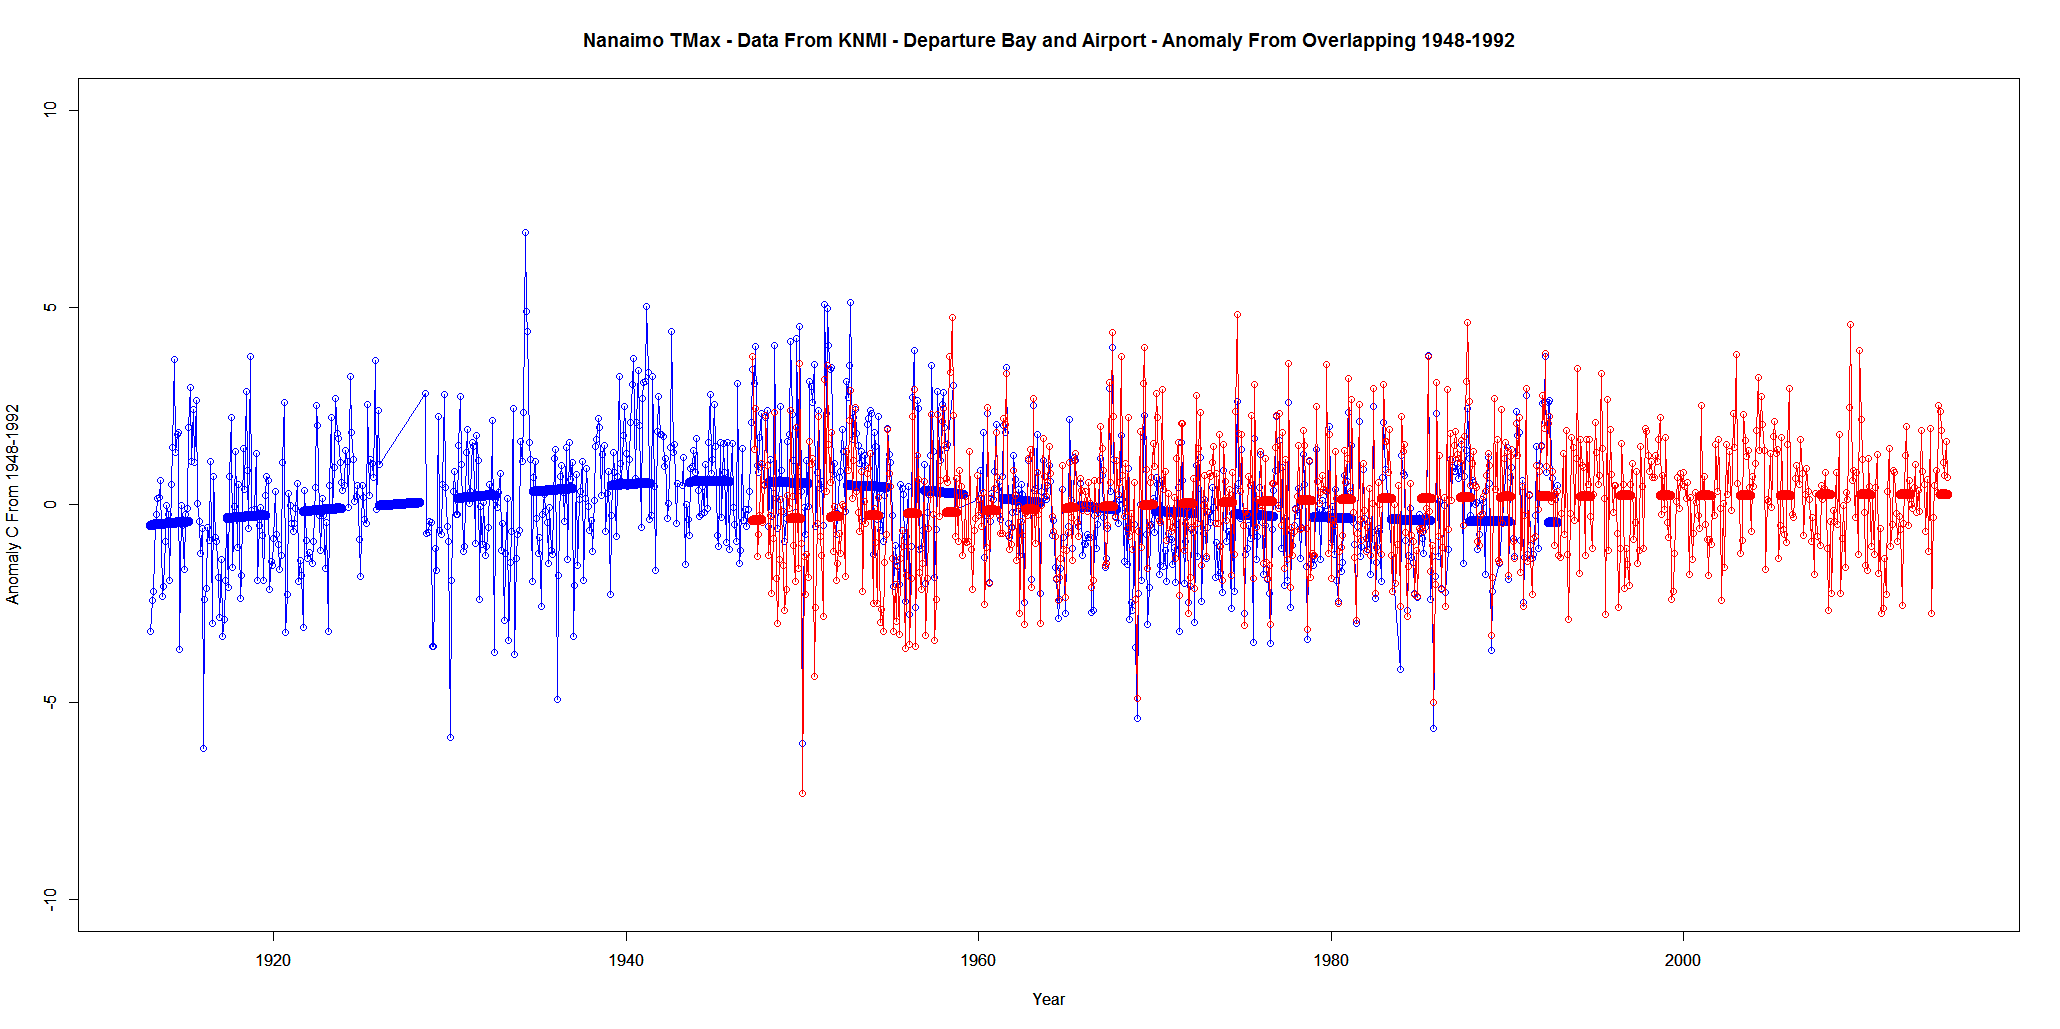
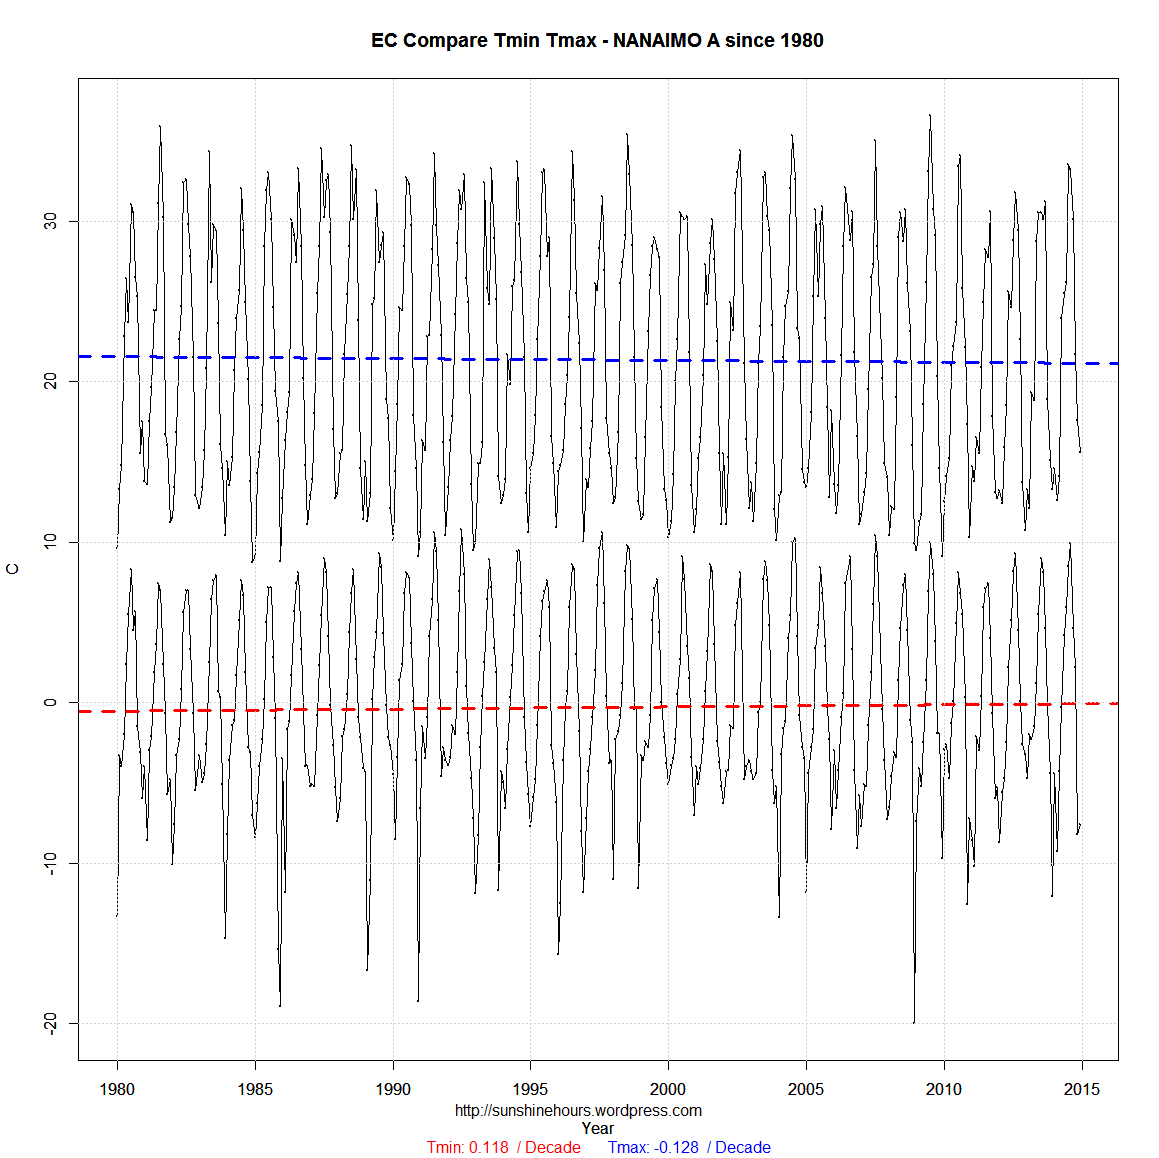
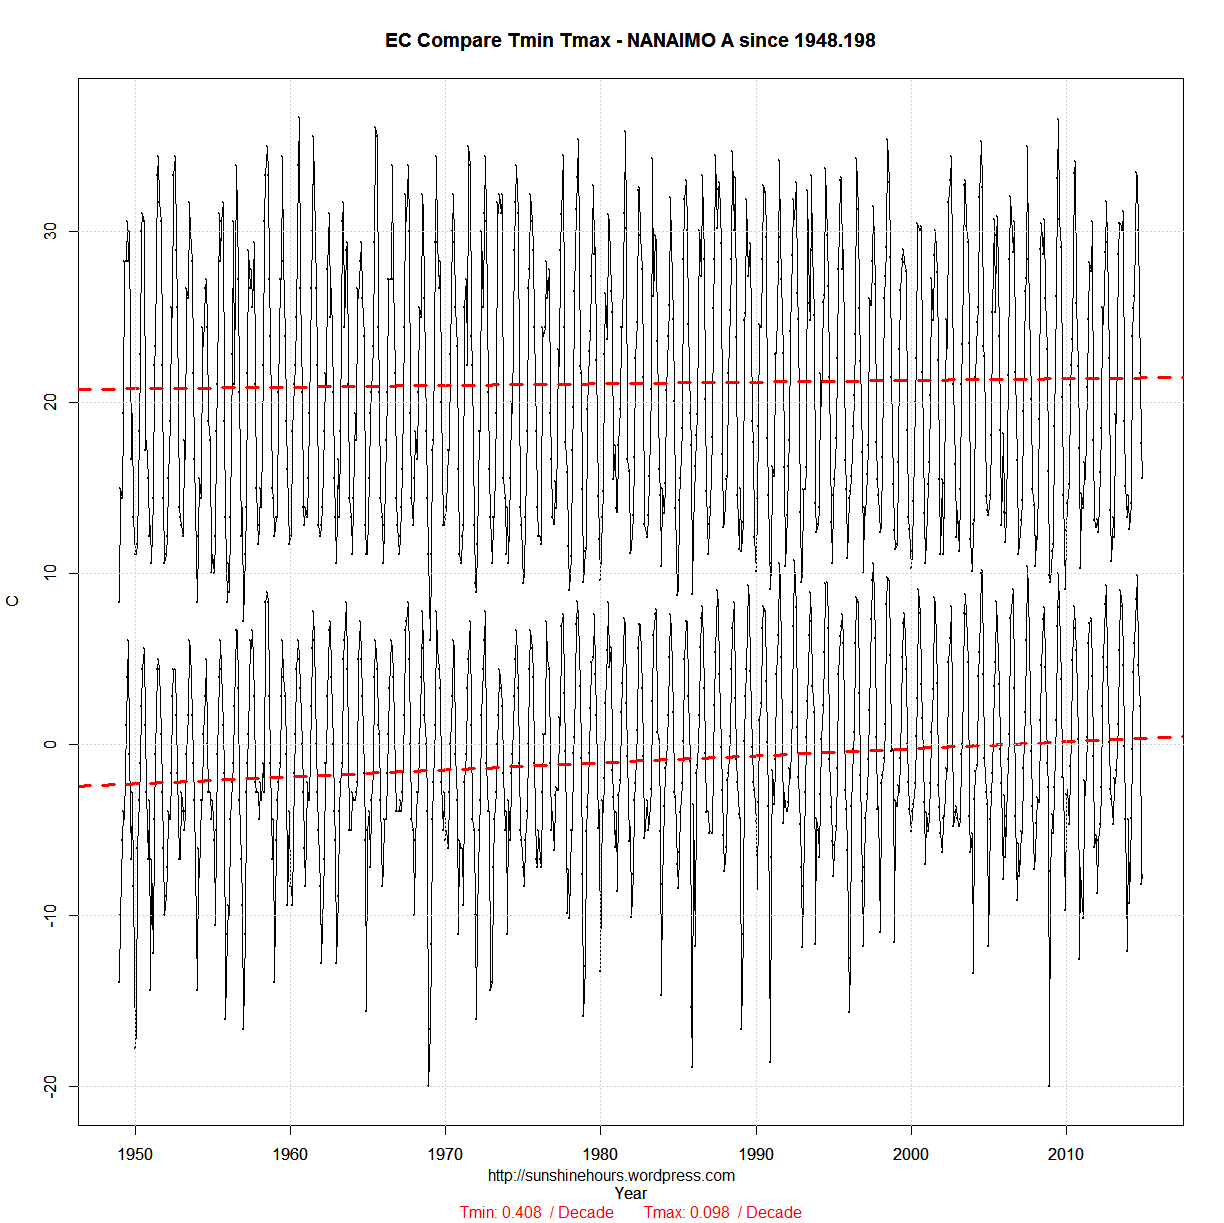
Today I am looking at daily data (using KNMI) from Departure Bay (1913 – 1992) and Nanaimo Airport (1947 – 2014).
I’ve summarized the data by monthly mean.
The data does overlap. The first graph is just Tmax. The second graph is Tmax anomaly from the overlap period of 1948 to 1992