Could Climate Change Have Caused the Polar Vortex?

According to Time Magazine: “Climate change skeptics are pointing to the record cold weather as evidence that the globe isn’t warming. But it could be that melting Arctic ice is making sudden cold snaps more likely—not less

Do you want to see what a cold snap really looks like according to the NOAA?

February 1936 – Coldest Month in USA History (click on the image for the full effect)

cag_[ Statewide Temperature Anomalies (Feb 1936) ]


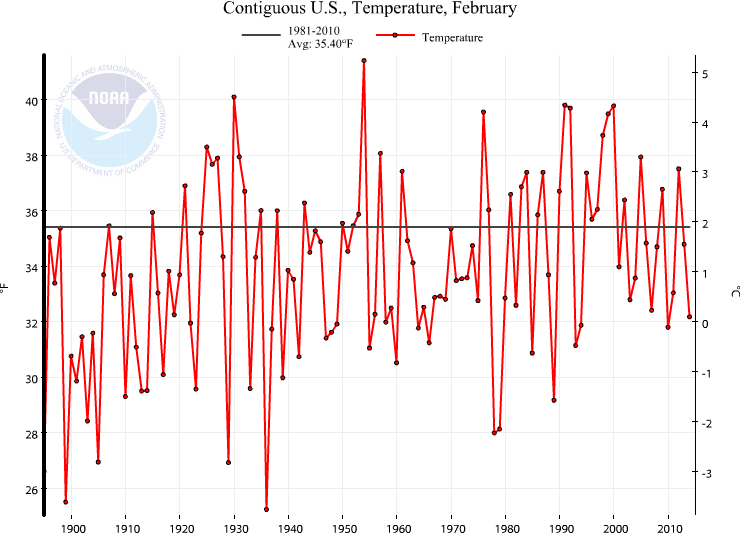
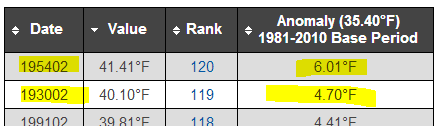
In 2014, Feb was -1.69°F below the 1901-2000 average. In February 1936 the USA was -8.59°F below average. Big difference.
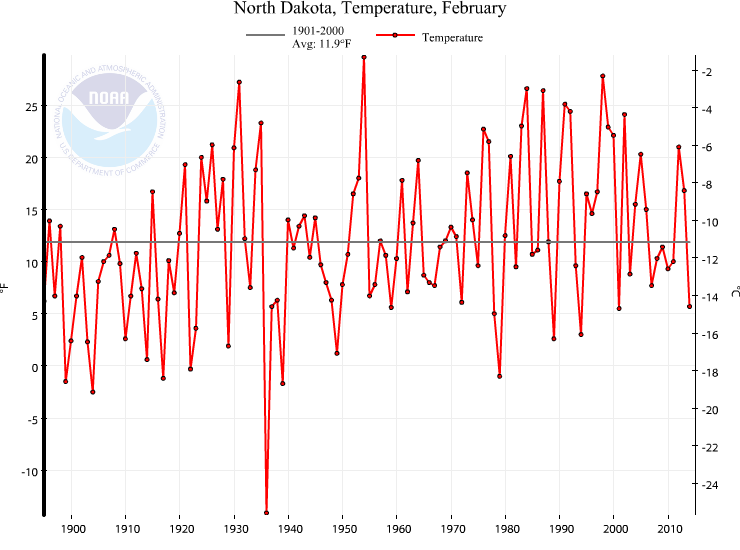
NOAA_Feb_1936_Lower_48


In North Dakota, February 1936 was 26.0°F below the 1901-2000 average. The whole month averaged -14.1°F below 0.

NOAA_Feb_1936_North_Dakota

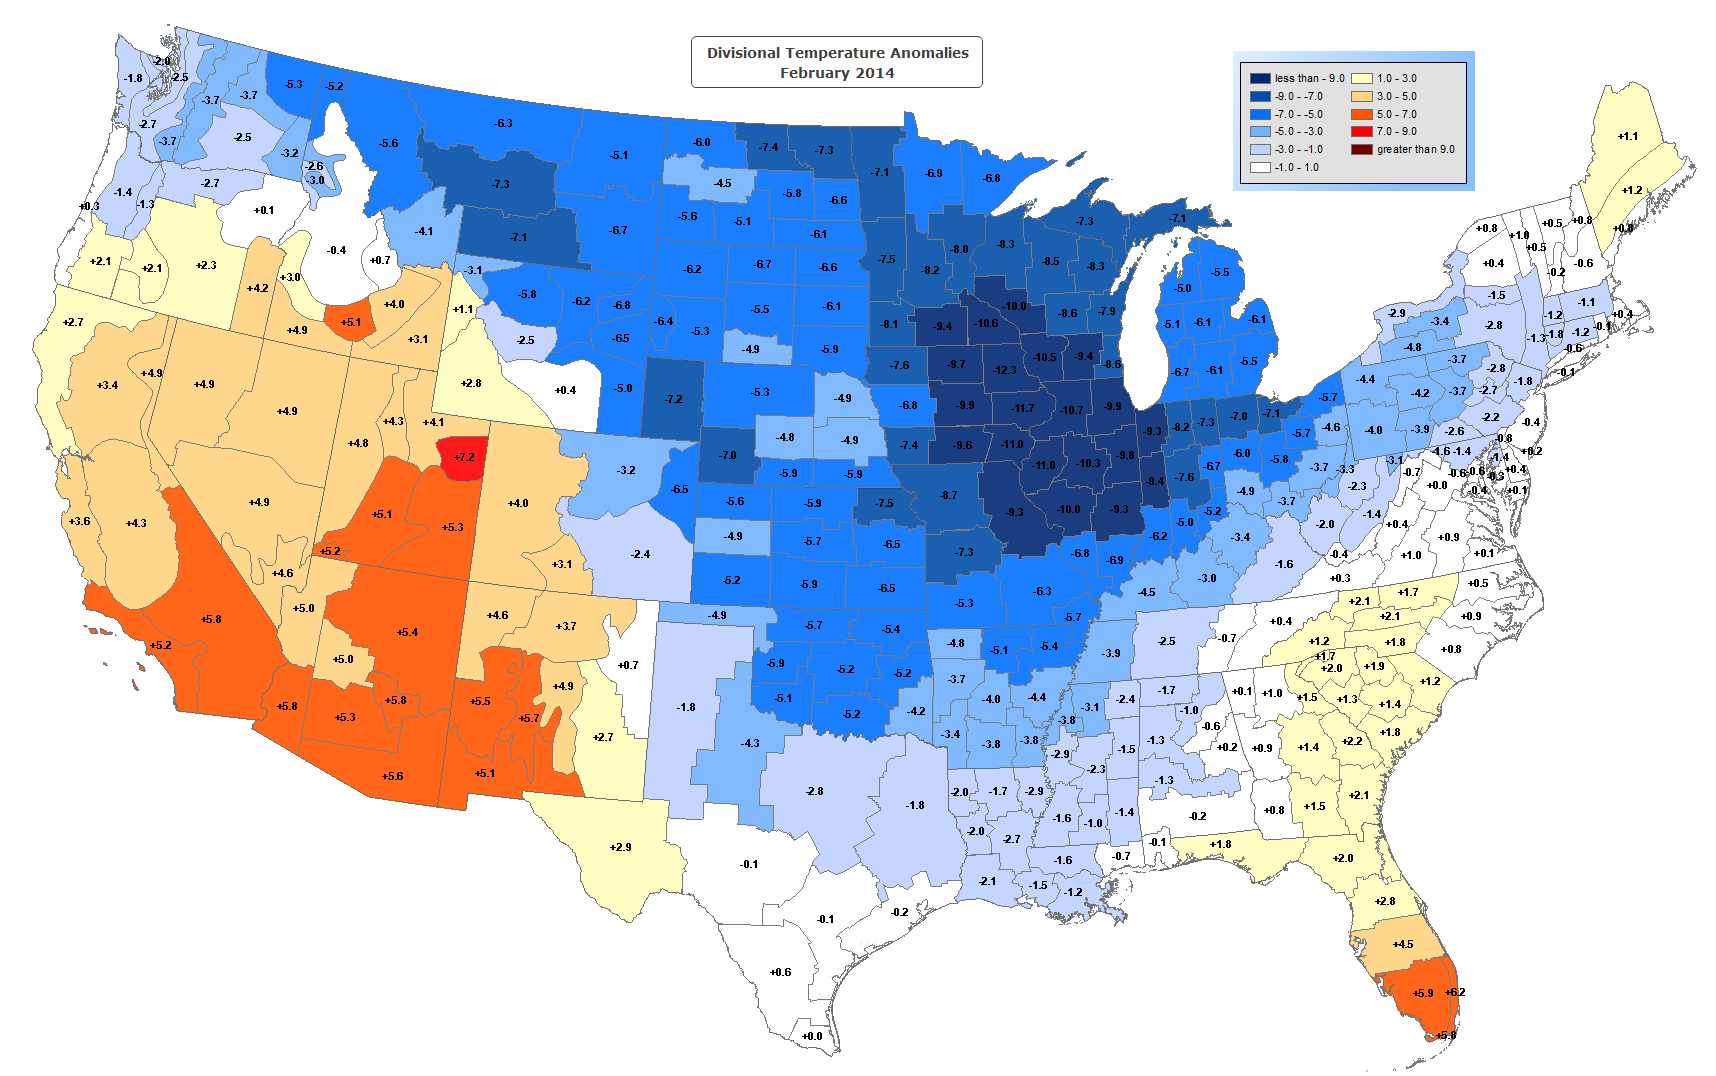
In comparison, lets take a look at Feb 2014:

cag_[ Statewide Temperature Anomalies (Feb 2014) ]

USA March 1910 versus March 2014 (according to the NOAA)

March 1910 (Before Global Warming) 7.94°F Above the 1901-2000 Average

cag_[ Divisional Temperature Anomalies (Mar 1910) ]


Some of those divisions are 16F above normal.

March 2014 (After Global Warming)  -0.99°F Below the 1901-2000 Average

cag_[ Divisional Temperature Anomalies (Mar 2014) ]

http://gis.ncdc.noaa.gov/map/cag/#app=cdo

PS I just randomly picked 1934 without checking. And then I noticed 1910 … but I’ll post the 1934 map so it doesn’t go to waste.

March 1934 (Before Global Warming) 1.28°F Above the 1901-2000 Average

cag_[ Divisional Temperature Anomalies (Mar 1934) ]


USA NOAA March 2014 – 43rd Coldest – Colder Than 1898,1900,1901,1902,1903,1904,1905,1907 …

According to the NOAA March 2014 was 43rd coldest out of 120 March’s.

That is the 2nd March in a row colder than the 1901-2000 average.

This is a partial list of the March’s warmer than 2014: 1898,1900,1901,1902,1903,1904,1905,1907,1908,1910,1911,1914,1916,1918,1919,1921,1925,1927,1928,1929,1933,1934,1935,1936,1938,1939 … 

NOAA_Mar_2014


NOAA Precipitation Update as of Feb 2014 – Last 12 Months Were Normal

I missed this when it came out last month, but according to the NOAA Precipitation for the 12 month period ending February 2014 was normal.

It was .19 inches above the 1901-2000 mean.

Wasn’t there supposed to be a permanent “Climate Change” drought?


NOAA_Feb_2014_Precipitation_12 Months


Addendum: If you split the NOAA Climate History in two (March – February), these are the averages:

1895 – 1955 = 29.45 inches

http://www.ncdc.noaa.gov/cag/time-series/us/110/00/pcp/12/02/1895-2014?base_prd=true&firstbaseyear=1896&lastbaseyear=1955

1956 – 2014 = 30.44

http://www.ncdc.noaa.gov/cag/time-series/us/110/00/pcp/12/02/1895-2014?base_prd=true&firstbaseyear=1956&lastbaseyear=2014


One last one:

1980 – 2014 = 30.75 inches

http://www.ncdc.noaa.gov/cag/time-series/us/110/00/pcp/12/02/1895-2014?base_prd=true&firstbaseyear=1980&lastbaseyear=2014


Climate Change … bringer of slightly more precipitation.

NOAA USA – Why is February Such A Key Month?

From 1895 to 1998 the Contiguous USA warmed at a very small rate of .78F per century. The NOAA graph is here.

The interesting thing is that 34% of the warming occurred in the month of February.  January even had a slight cooling trend.

From 1998 to 2013,  the USA cooled at a rate of -3.33F per century. February was responsible for 66% of the cooling.

Any ideas? Is it an NOAA artifact or something else? It seems strange that CO2 would prefer February for 100 years and then forsake it. 🙂

Graphs for each month/period below. (The percentages do not add up properly because some months were going in opposite direction of overall trend, but they give an idea of the magnitude)

Click for bigger.

NOAA USA Contiguous 48 States 1895 to 1998 - Trend 0.78F per Century

NOAA USA Contiguous 48 States 1998 to 2013 - Trend -3.33F per Century

70 Novembers Were Warmer Than November 2013 in the USA Lower 48

According to the NOAA November 2013 was 49th warmest out of 119.  The following 70 Novembers were warmer:

1899,1900,1901,1902,1904,1905,1908,1909,1912,1913,1914,1915,1917,1921,1922,1923,1924,1927,1928

and 1931,1933,1934,1939,1941,1942,1944,1945,1946,1948,1949,1953,1954,1958,1960,1962,1963,1964,1965,1966,1967,1969

and 1971,1973,1974,1975,1977,1980,1981,1983,1984,1987,1988,1989,1990,1994,1995,1998,1999,2001,2002,2003,2004,2005,2006,2007,2008,2009,2010,2011,2012

Only 4 states were “Above Normal”. Tennessee, for example, was over 3F below the 1901-2000 average and was 15th warmest out of 119.

NOAA_NOV_2013_Map

USCRN TMax/Tmin/Tmean October 2013 – Russia is Warming at 225F / Century?

The USCRN is the US Climate Research Network. I had not looked at the data in a little while. So I was confused by the state code of SA.

Well, it turned out that the NOAA has added a station in Tiksi, Russia. Which has been warming (Tmax) at 225F/century over the last 3 Octobers.

The USCRN has no stations in Connecticut or Delaware or New Jersey, but it now has one in Russia.  Bizarre.

Anyway, the data is not that old, but here is the USCRN Tmax, Tmean and Tmin trends for October for most of the states in the USA and Tiksi.

Click for bigger.

Tmax
USCRN Max October data up to 201311

Tmean
USCRN Mean October data up to 201311

Tmin
USCRN Min October data up to 201311