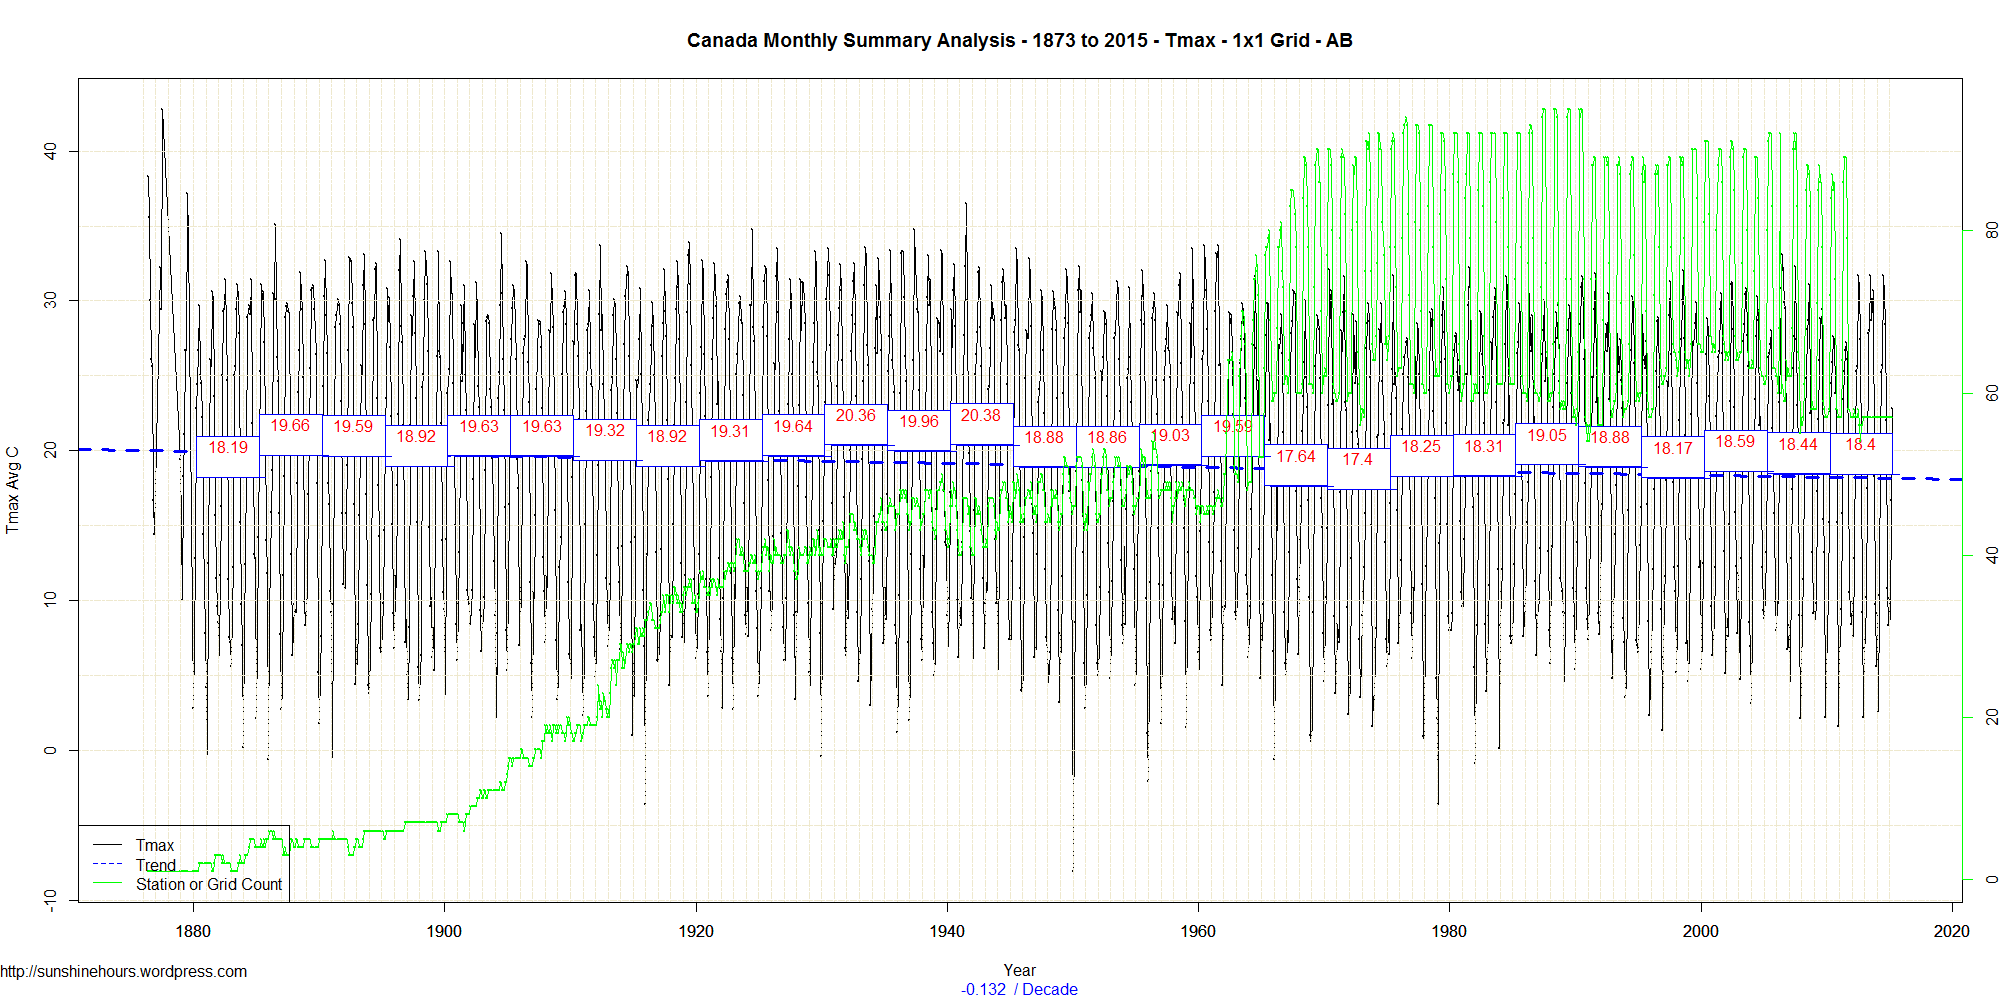
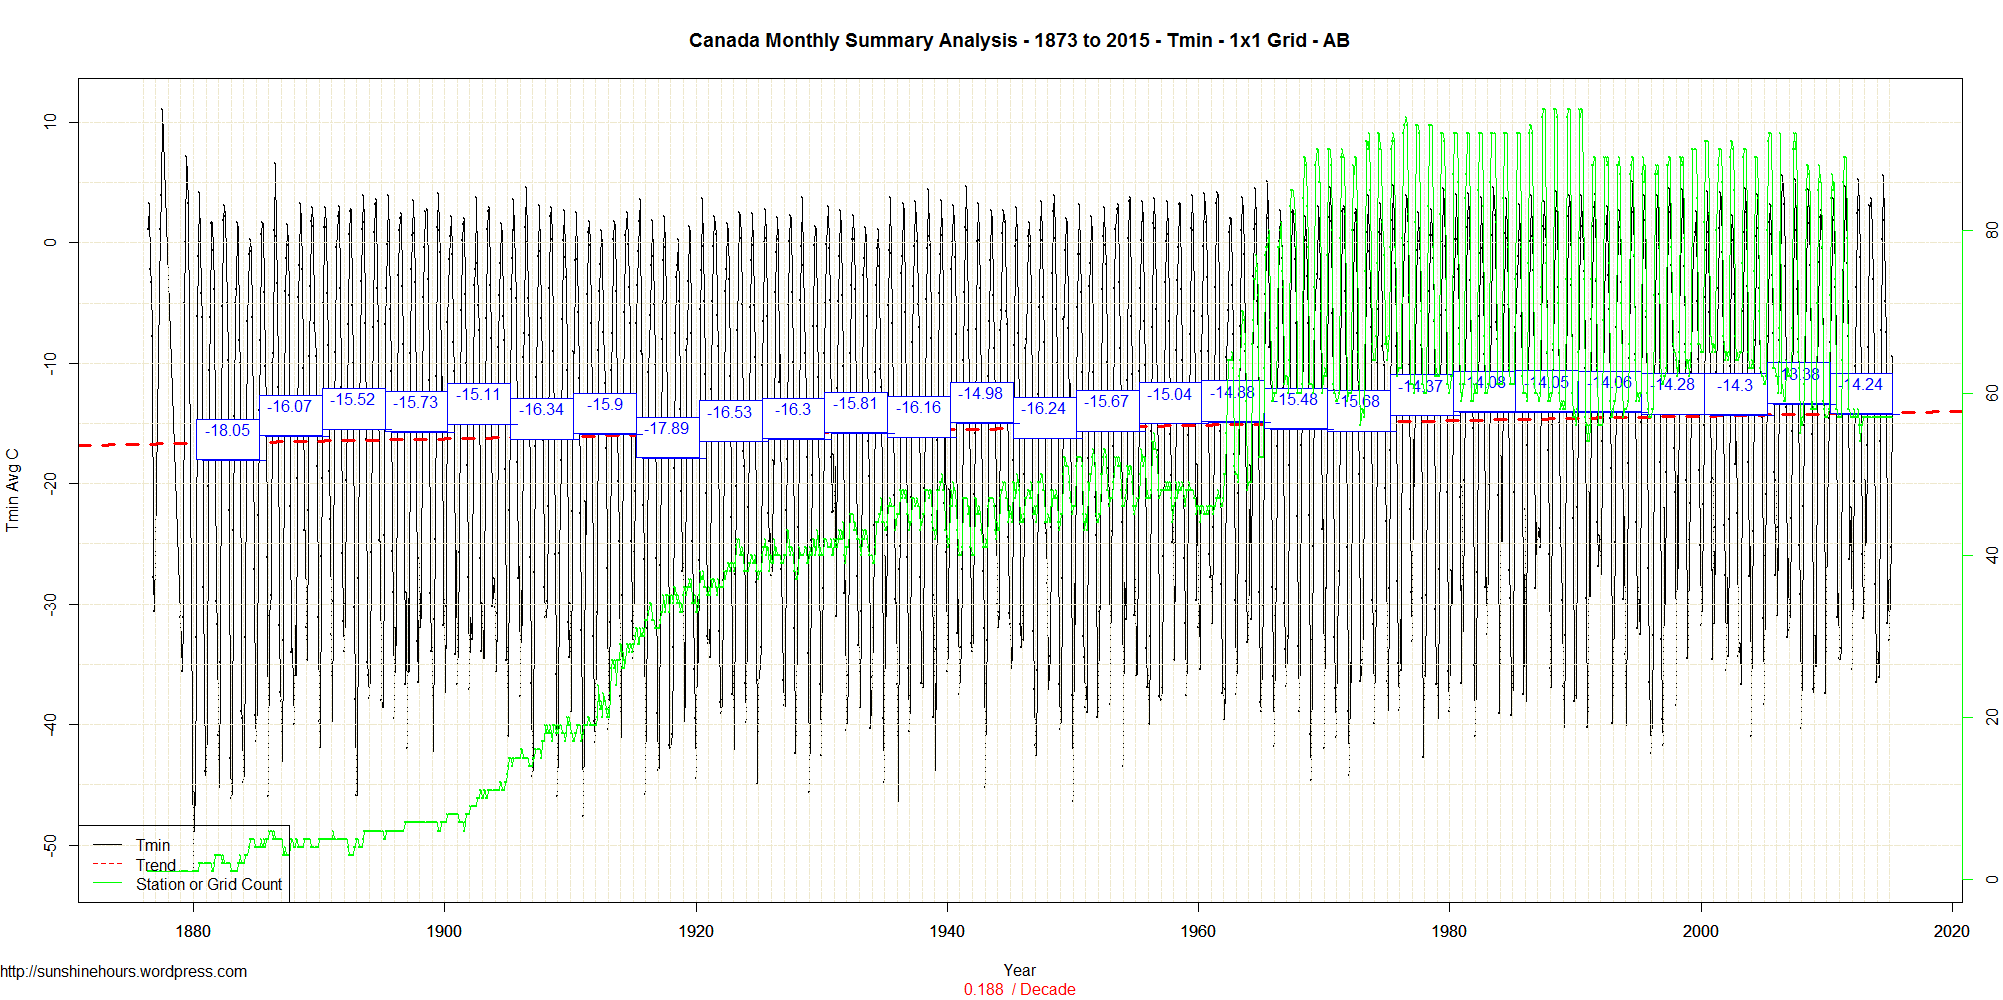
This is the Alberta followup the BC post. You can read the explnations.
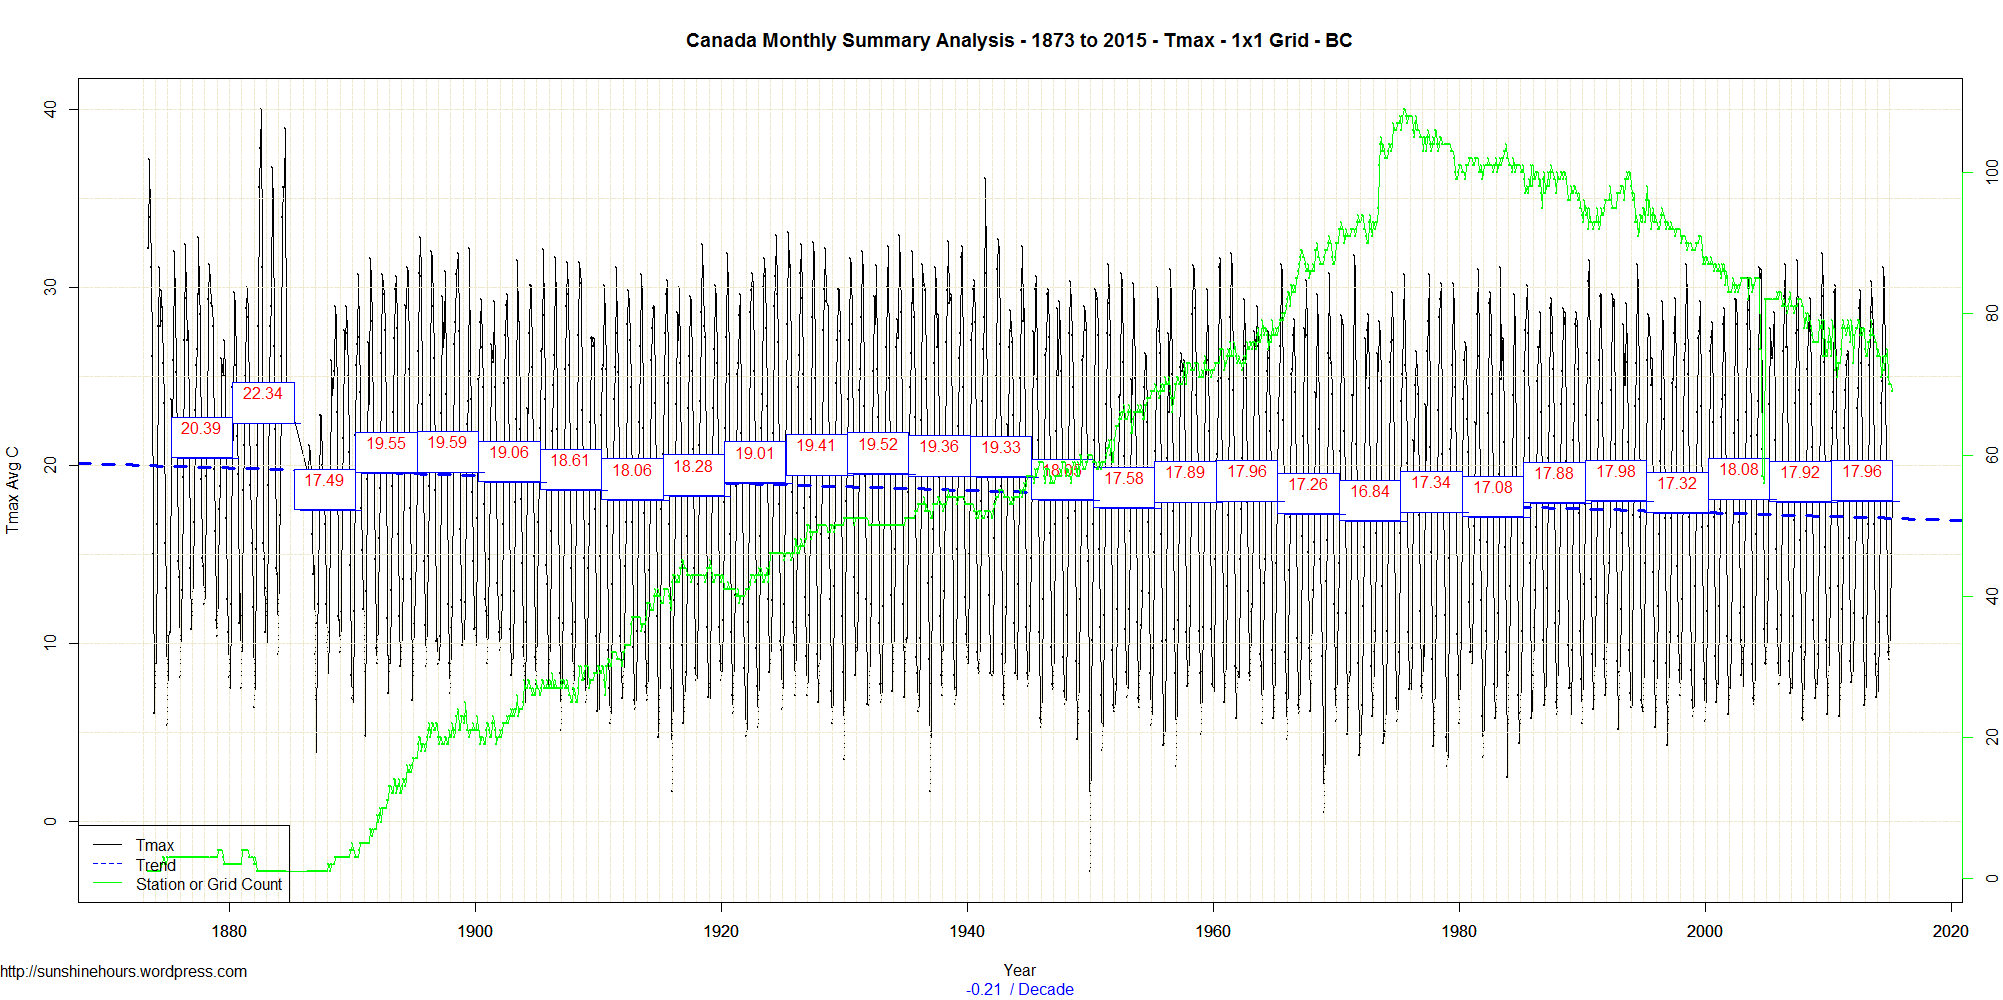
In the terms of Tmax the coldest period in Alberta (using 5 year means) was 1972-1976.
The warmest period was 1940 – 1944. In fact it was 2C warmer in 1940-1944 than 2011 – 2015. (The 1930s were just slightly cooler than the early 40s)
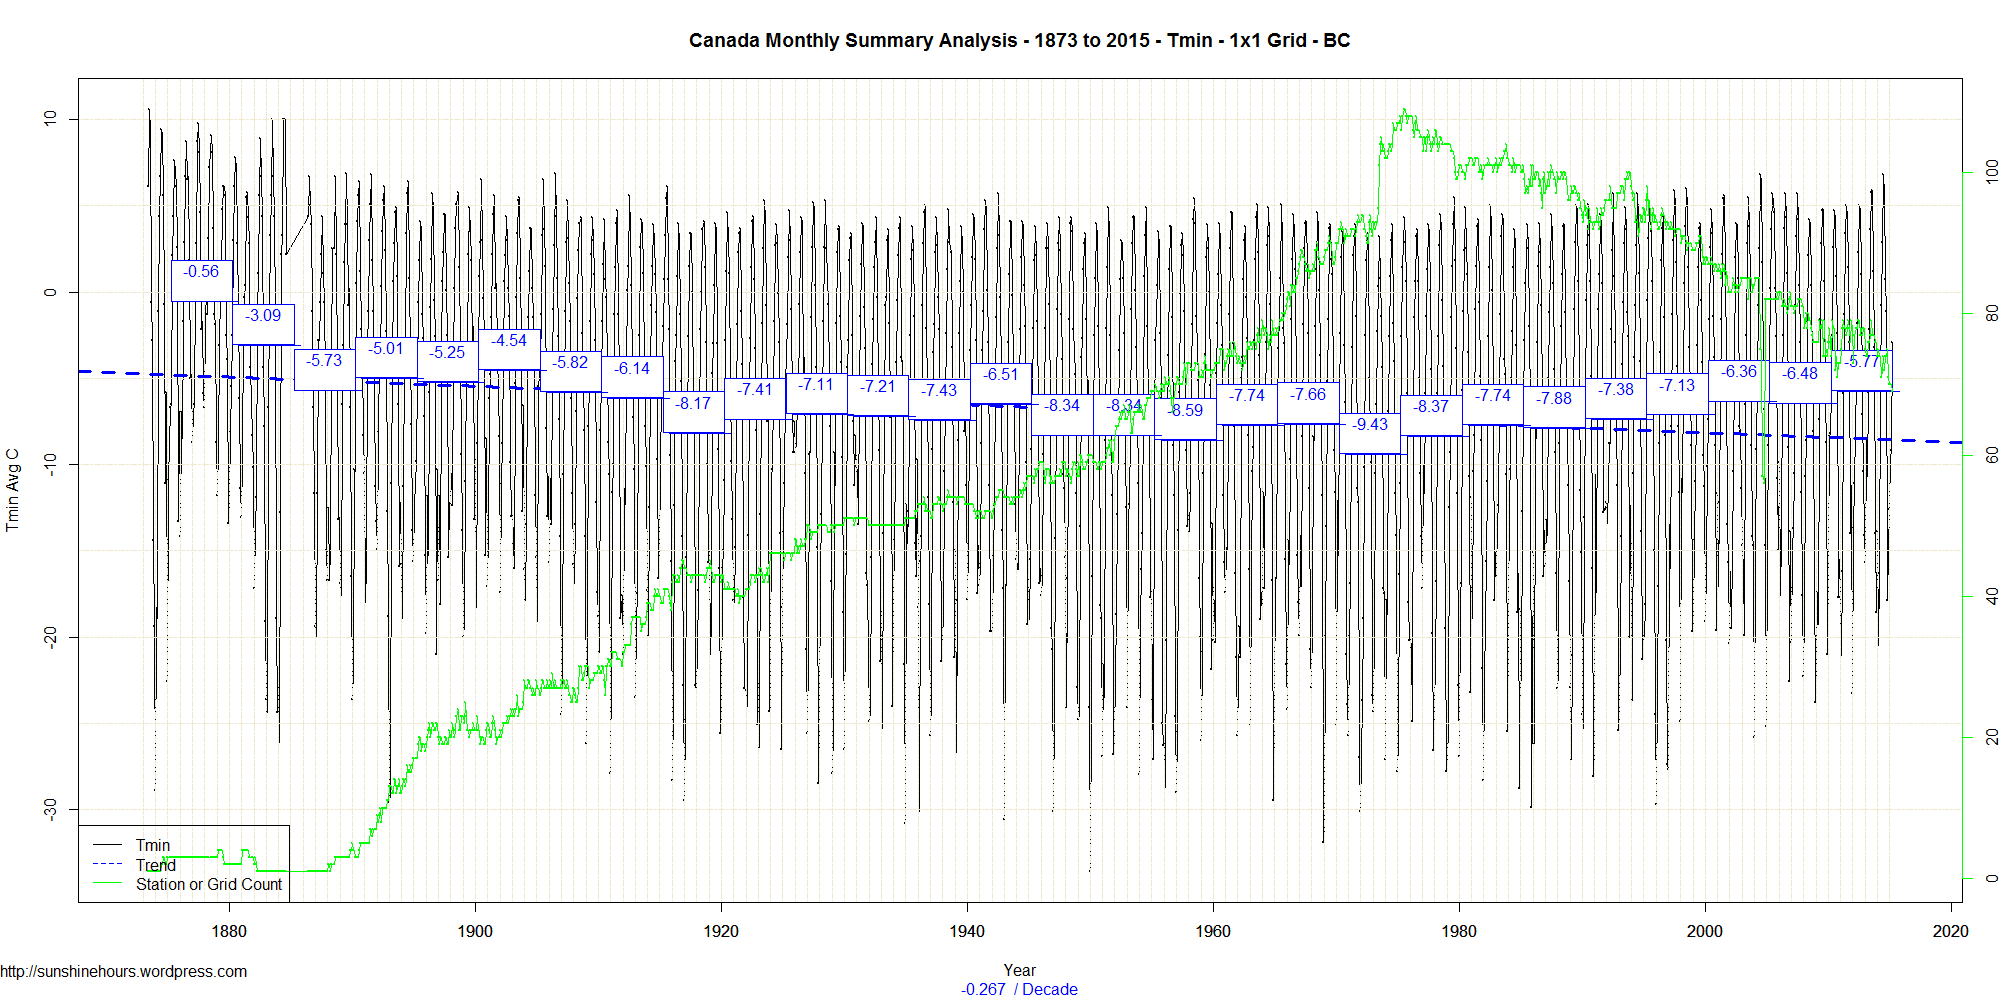
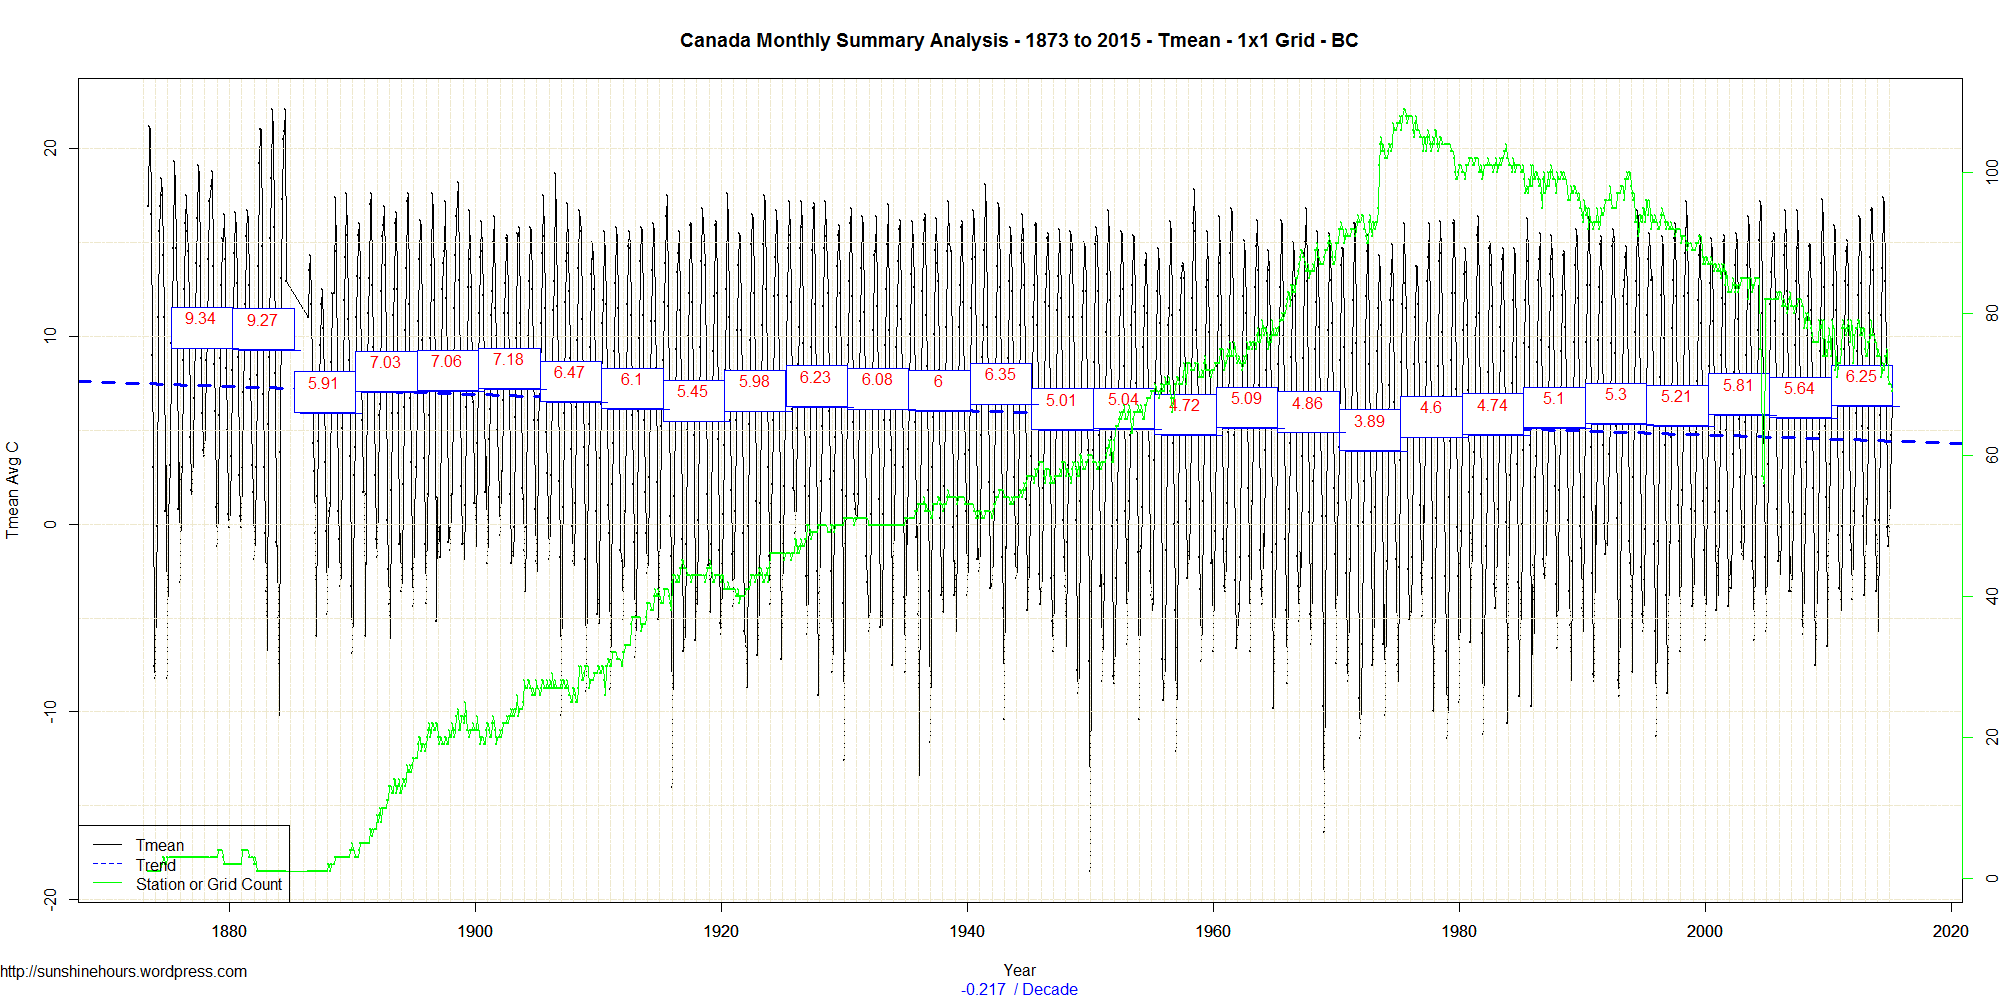
You may ask why the green line of grid counts goes up and down so much. It appears there are many more stations reporting in May/Jun/Jul/Aug/Sep than in the winter.
Tmax
Tmin
Tmean
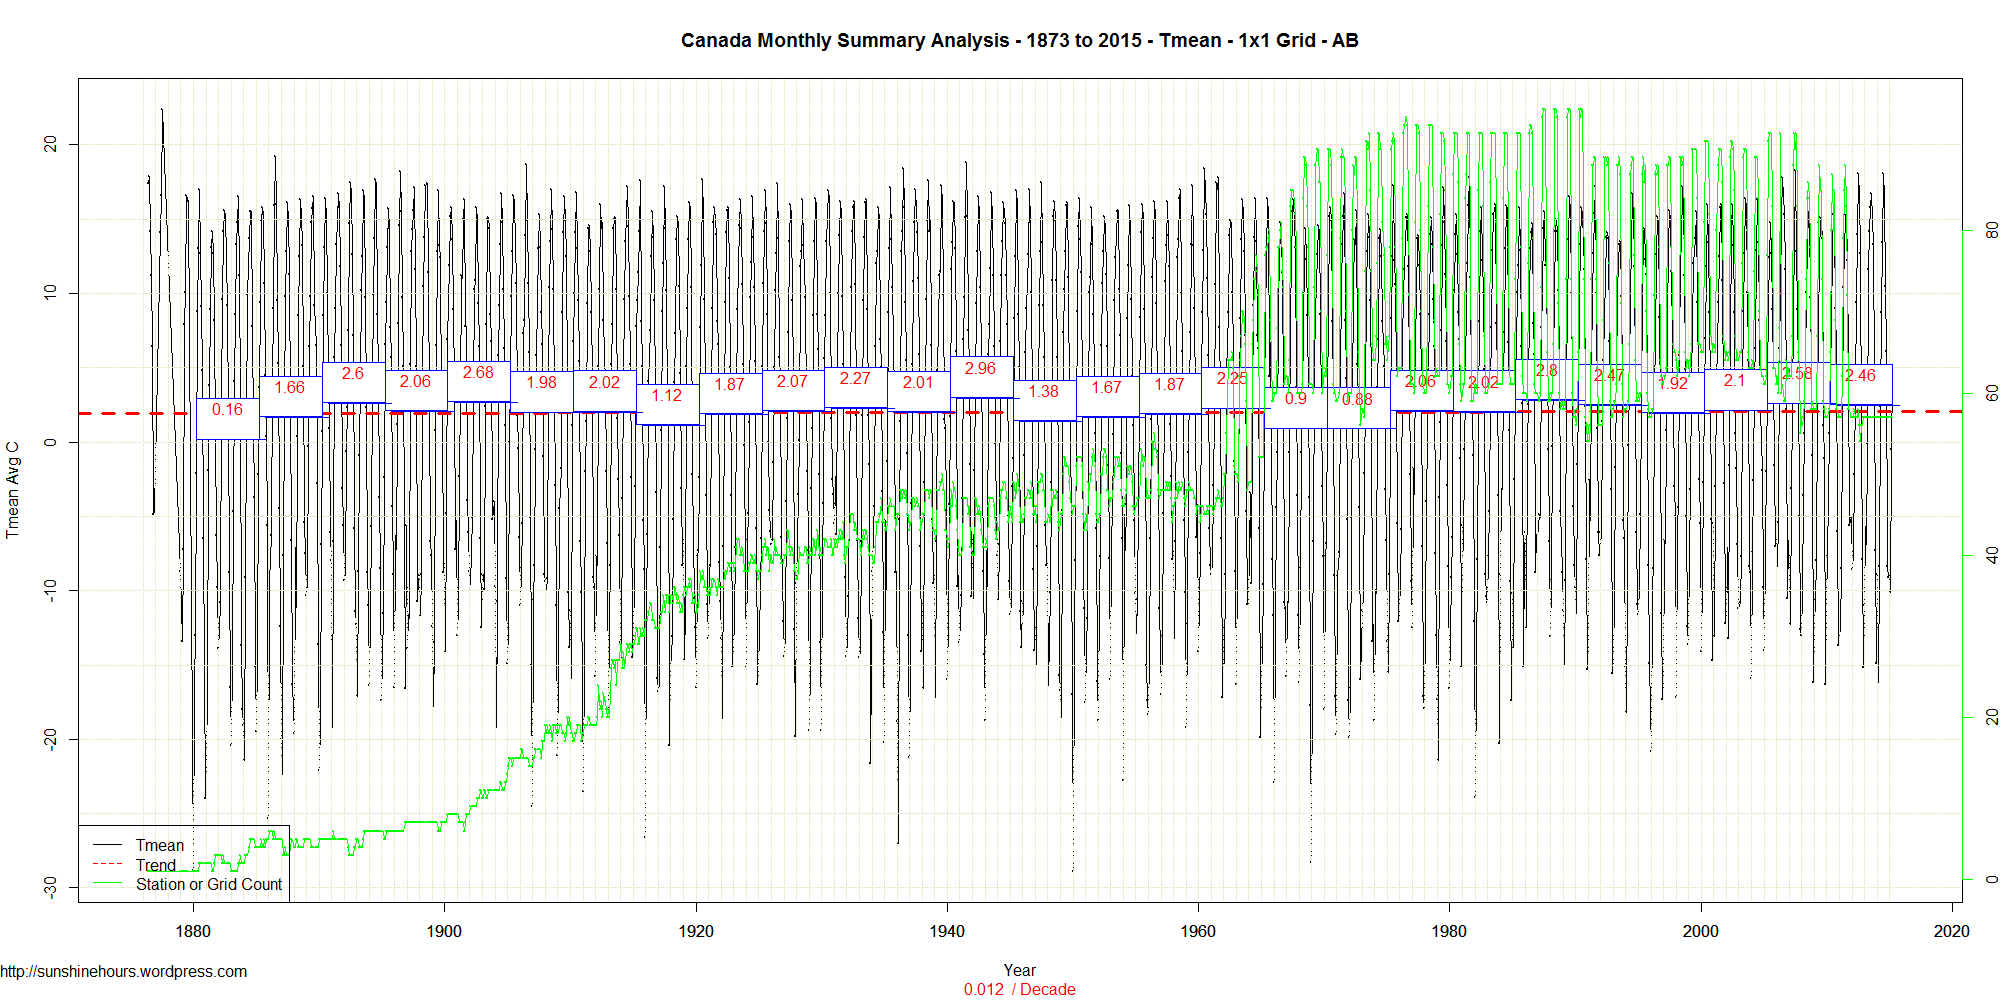
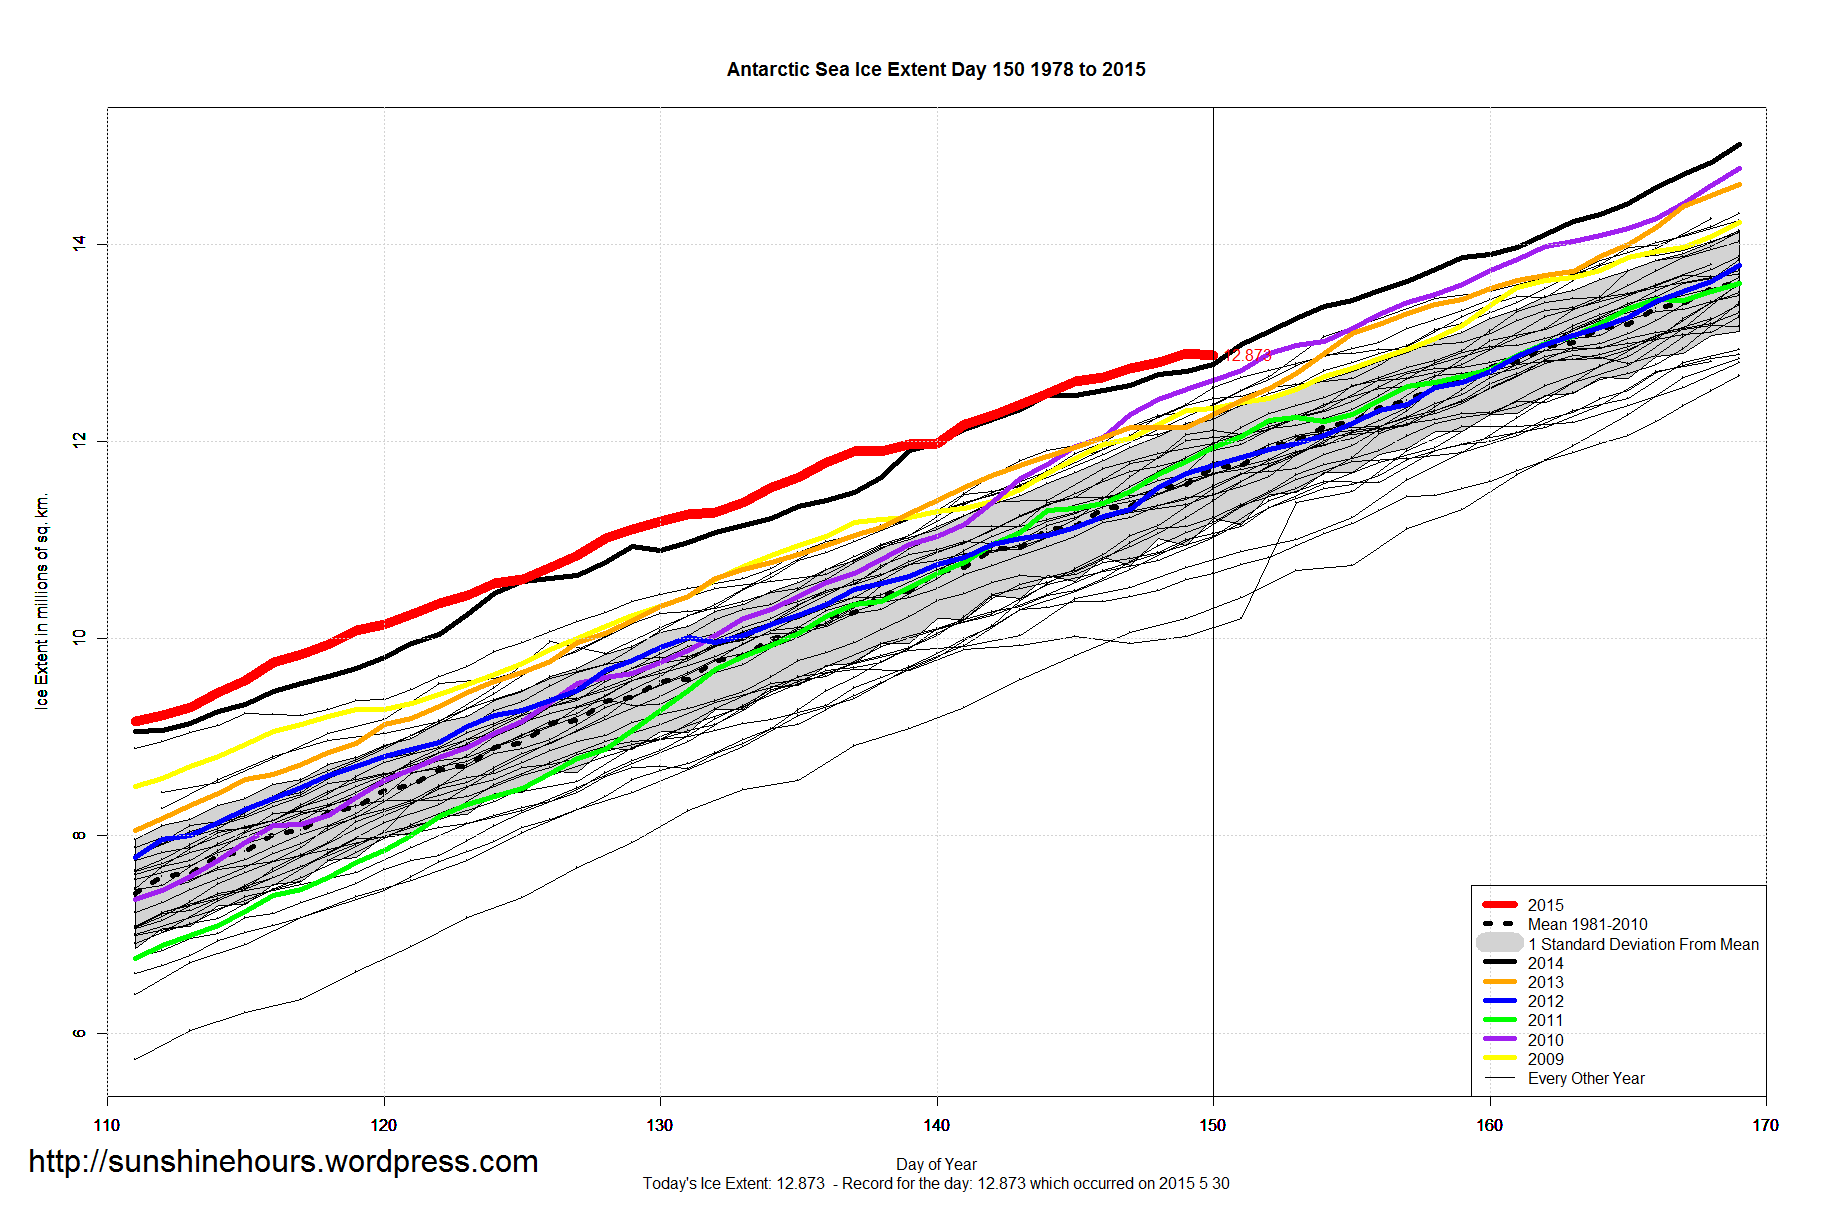
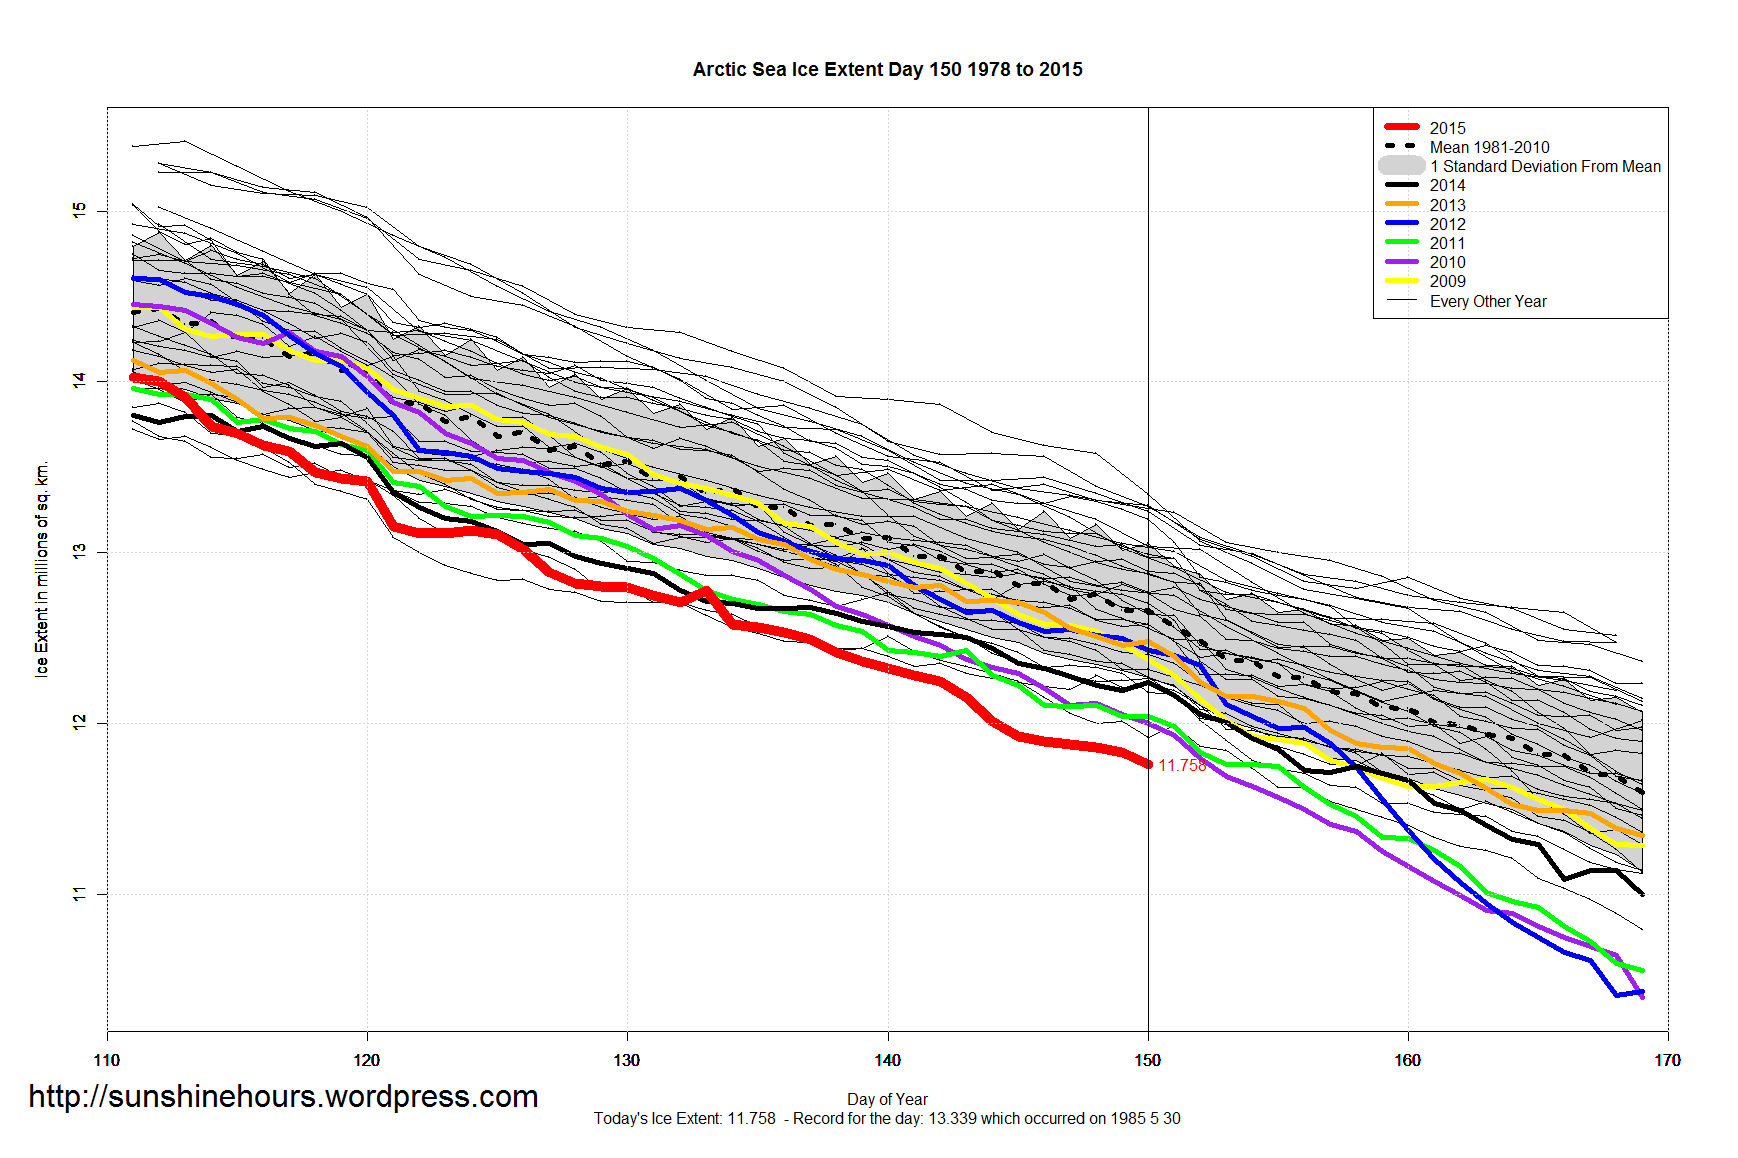
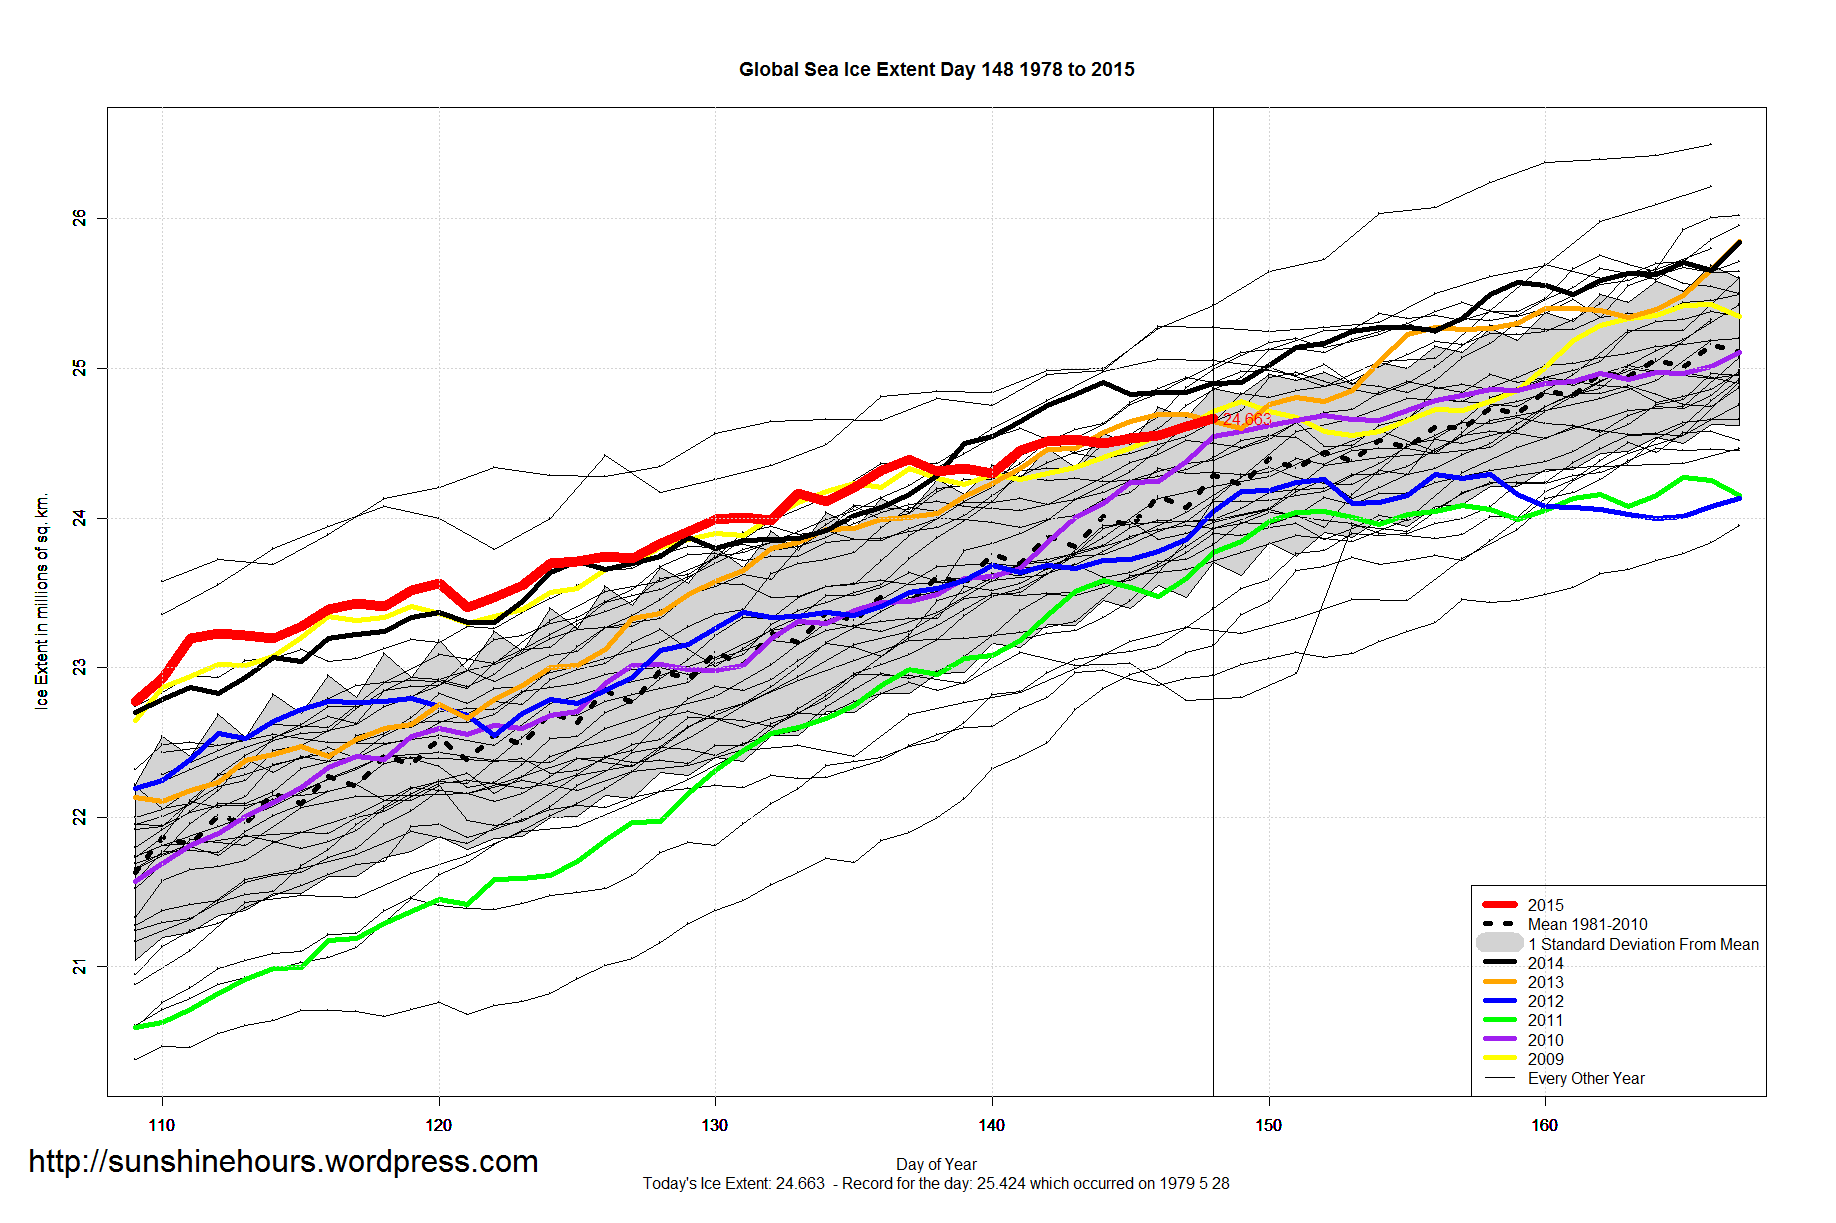
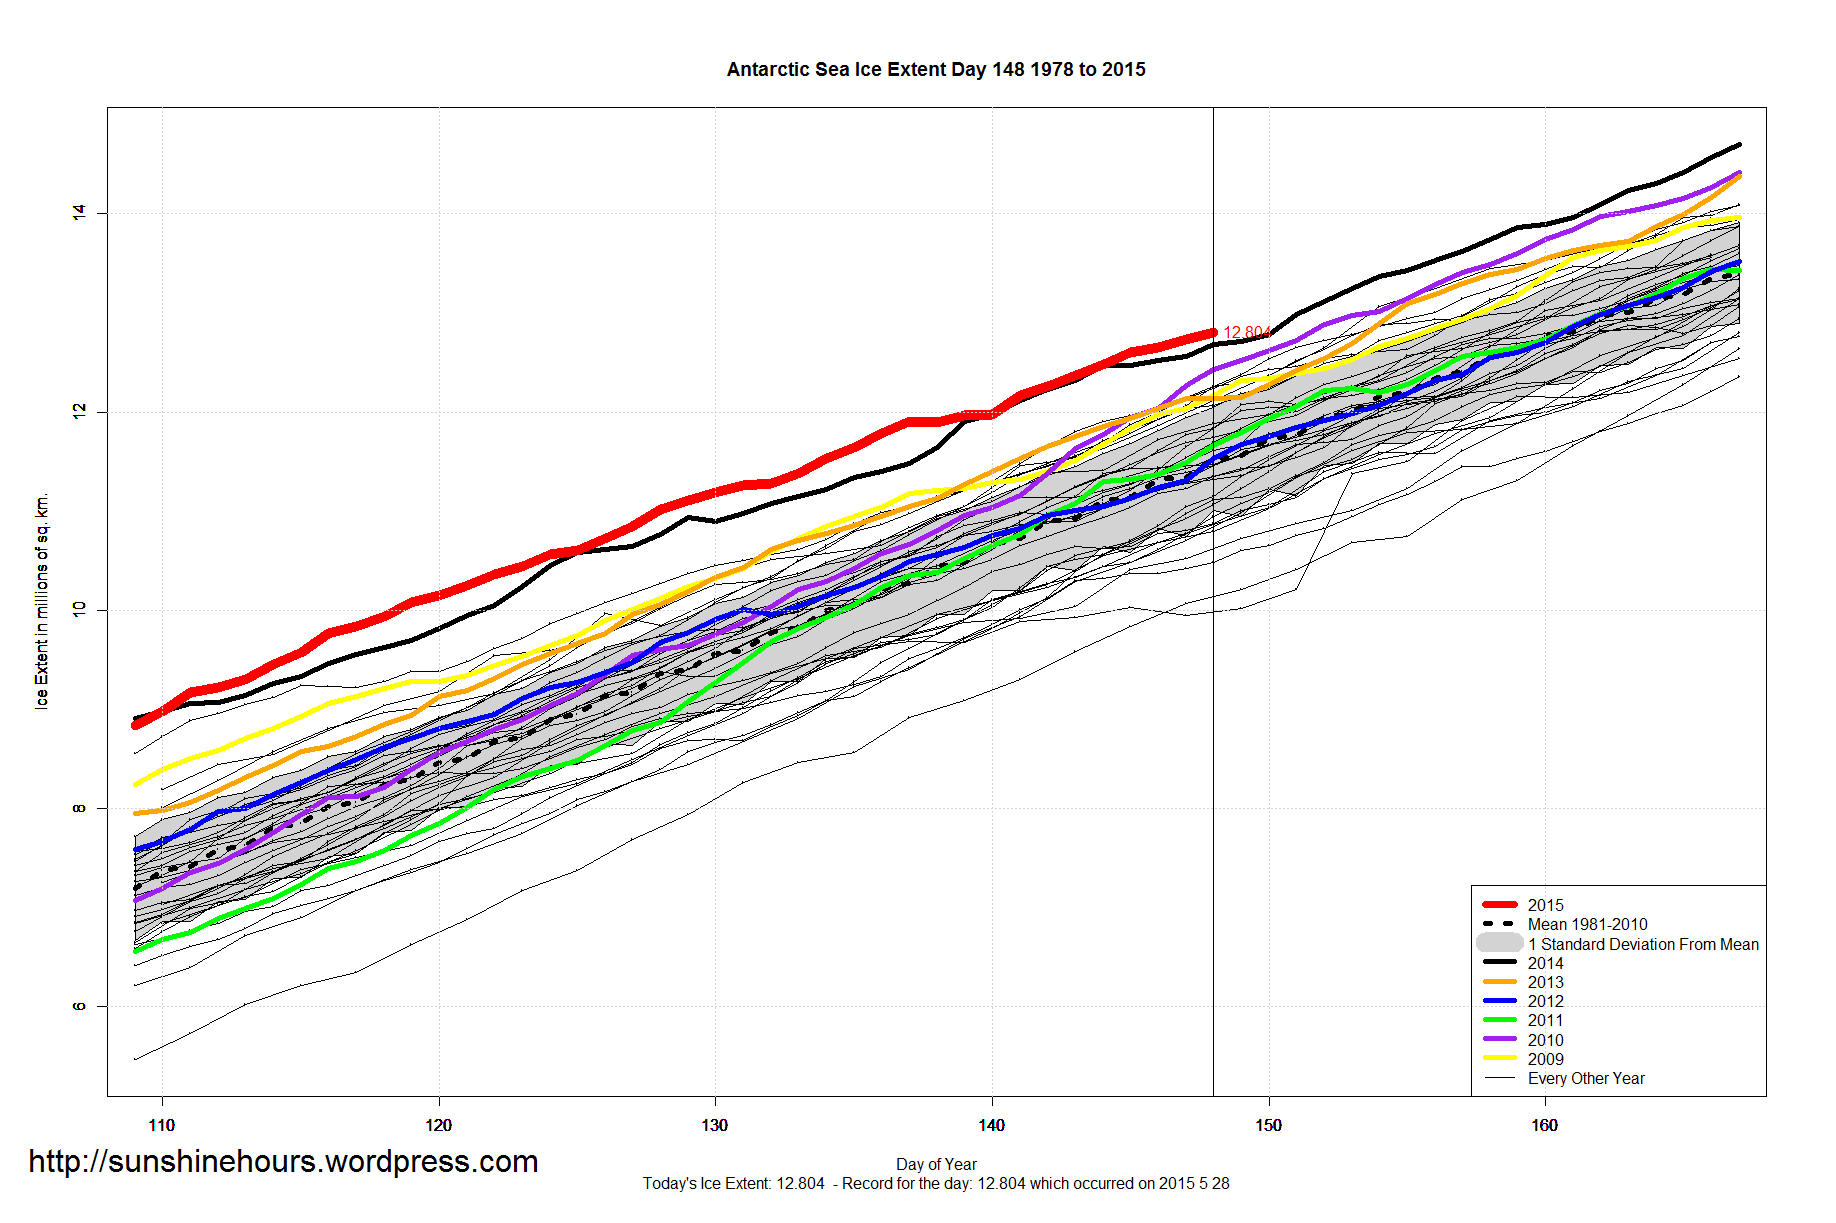
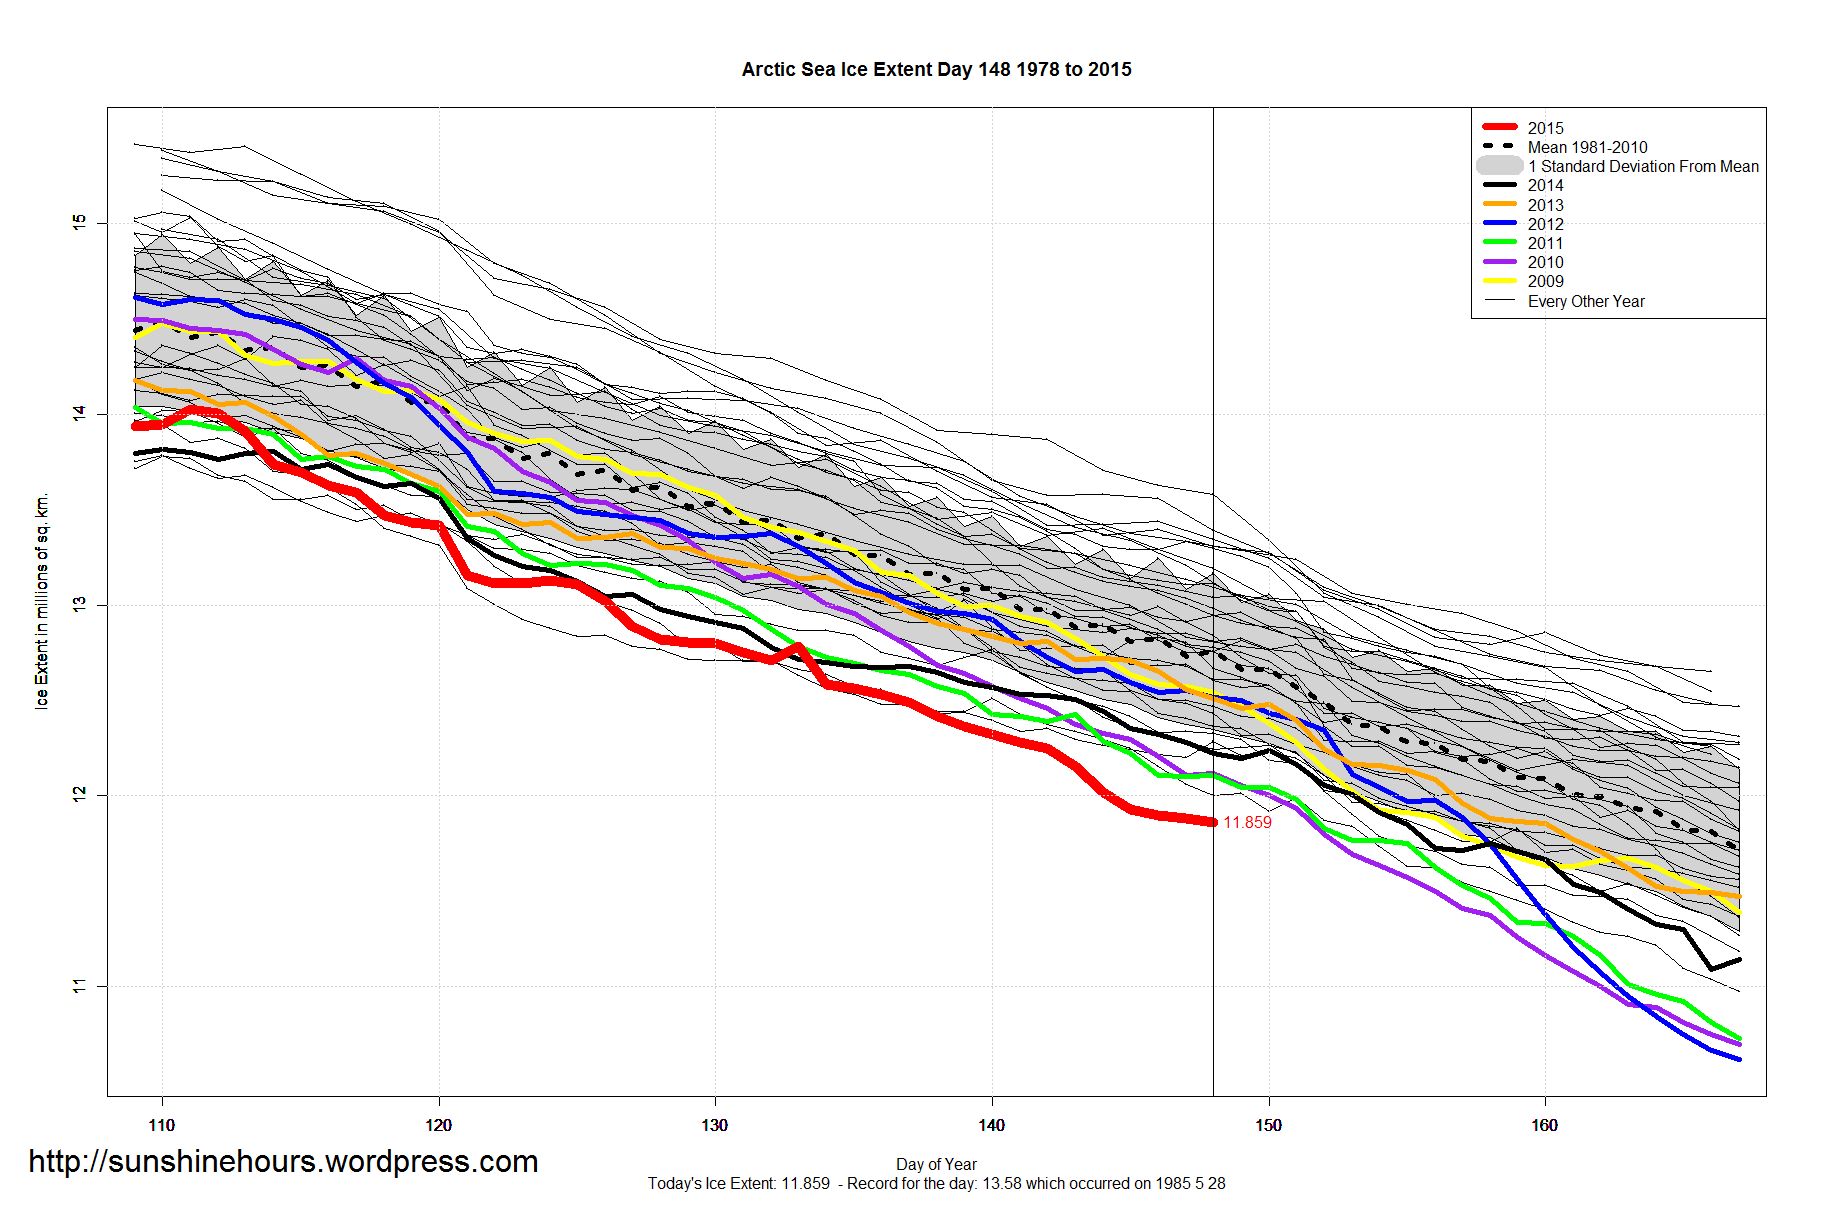
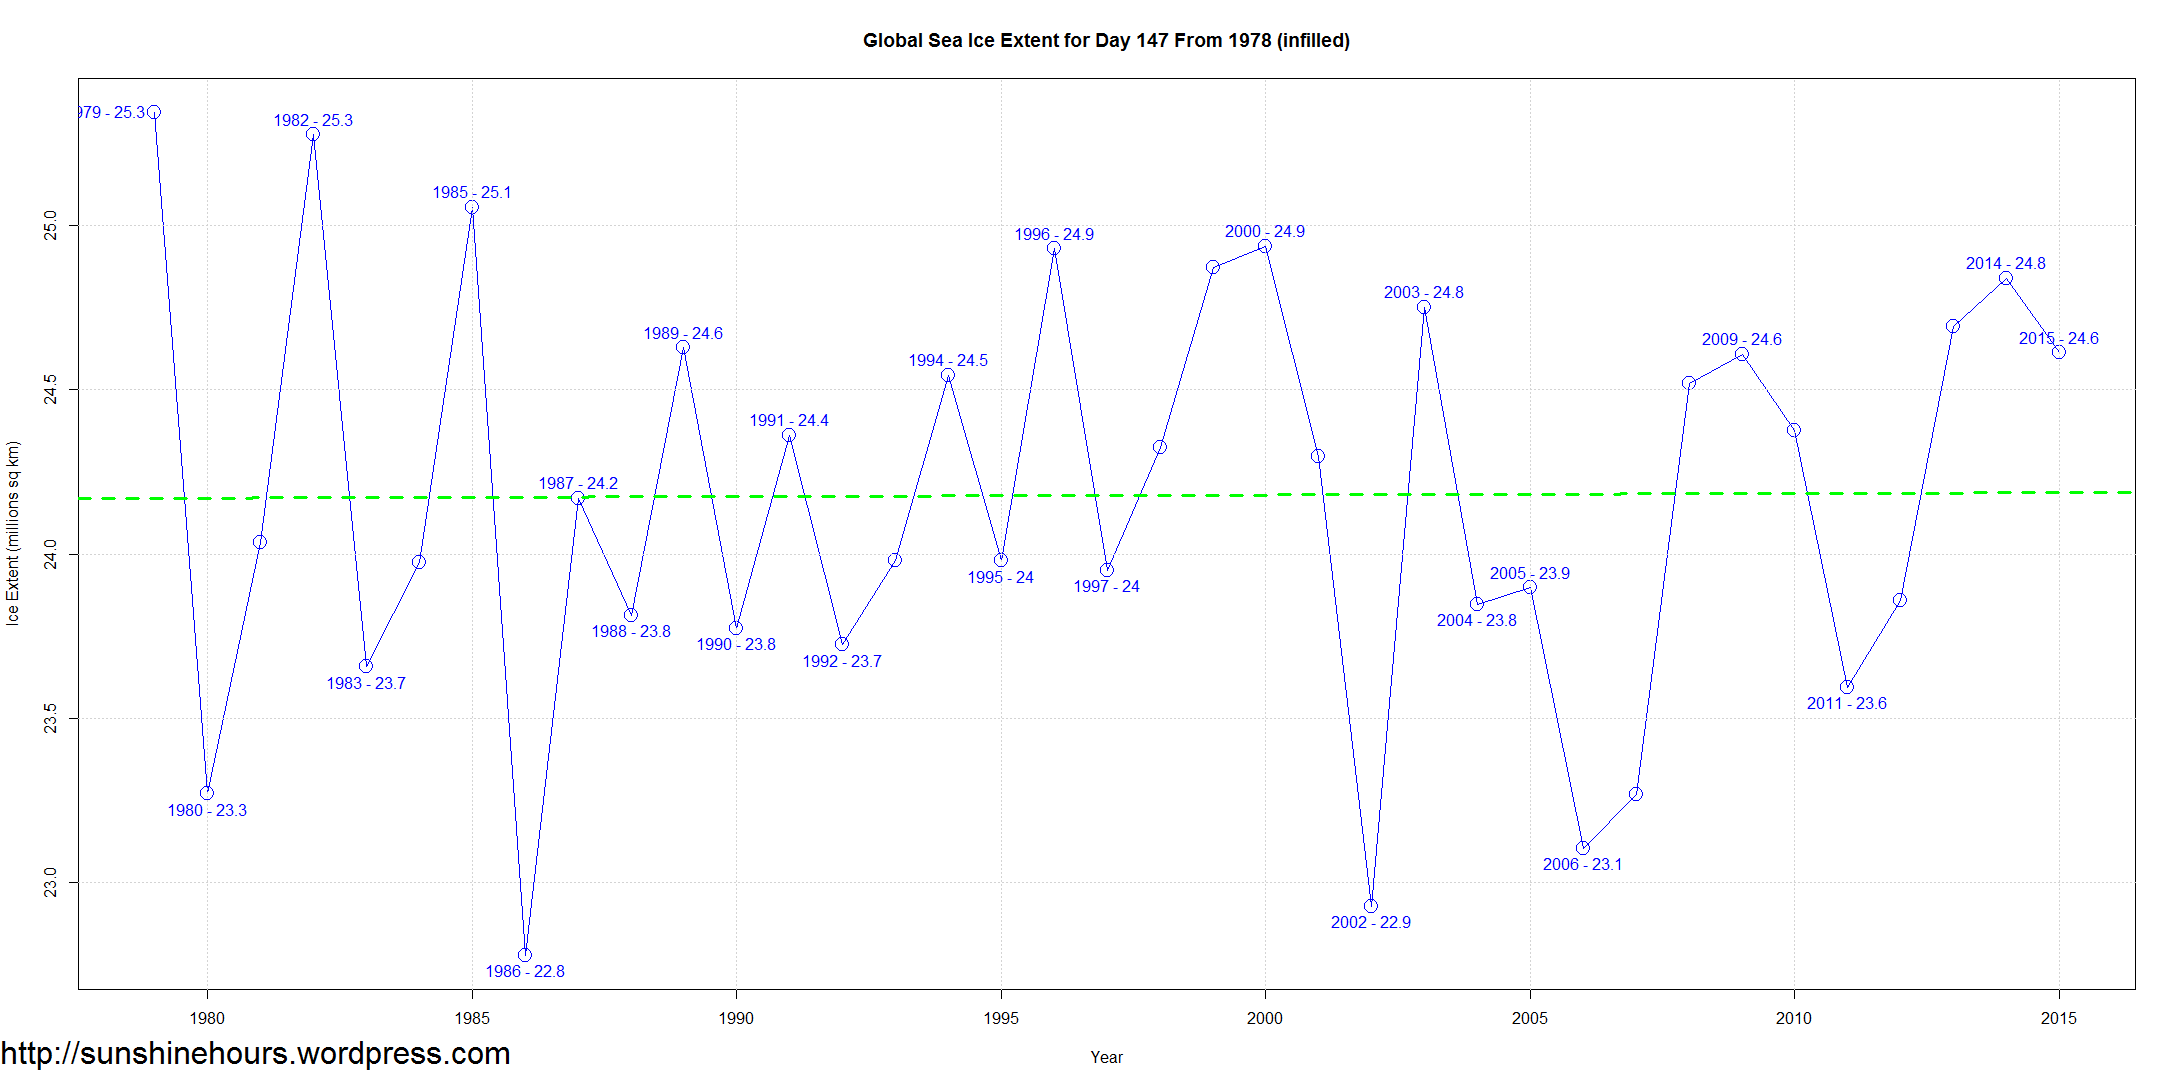
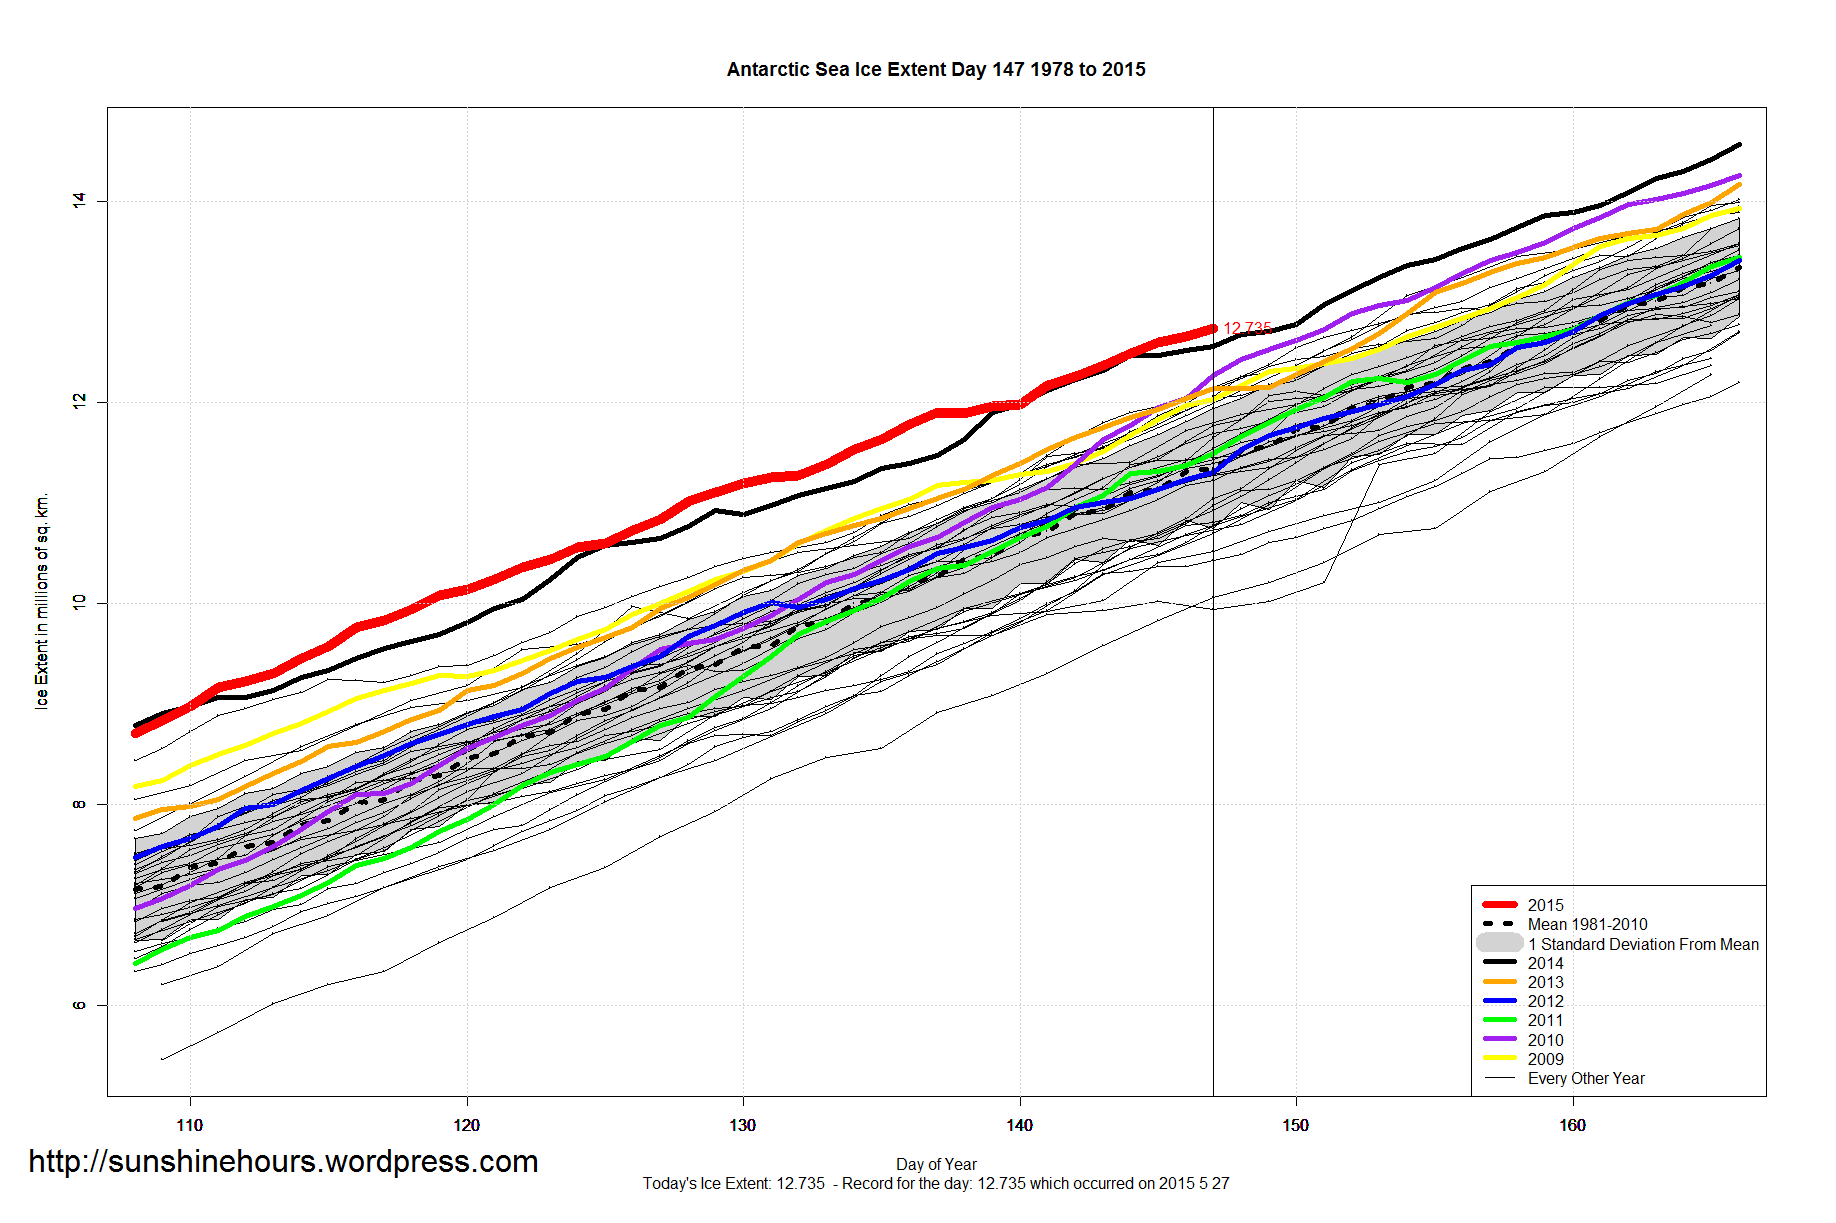
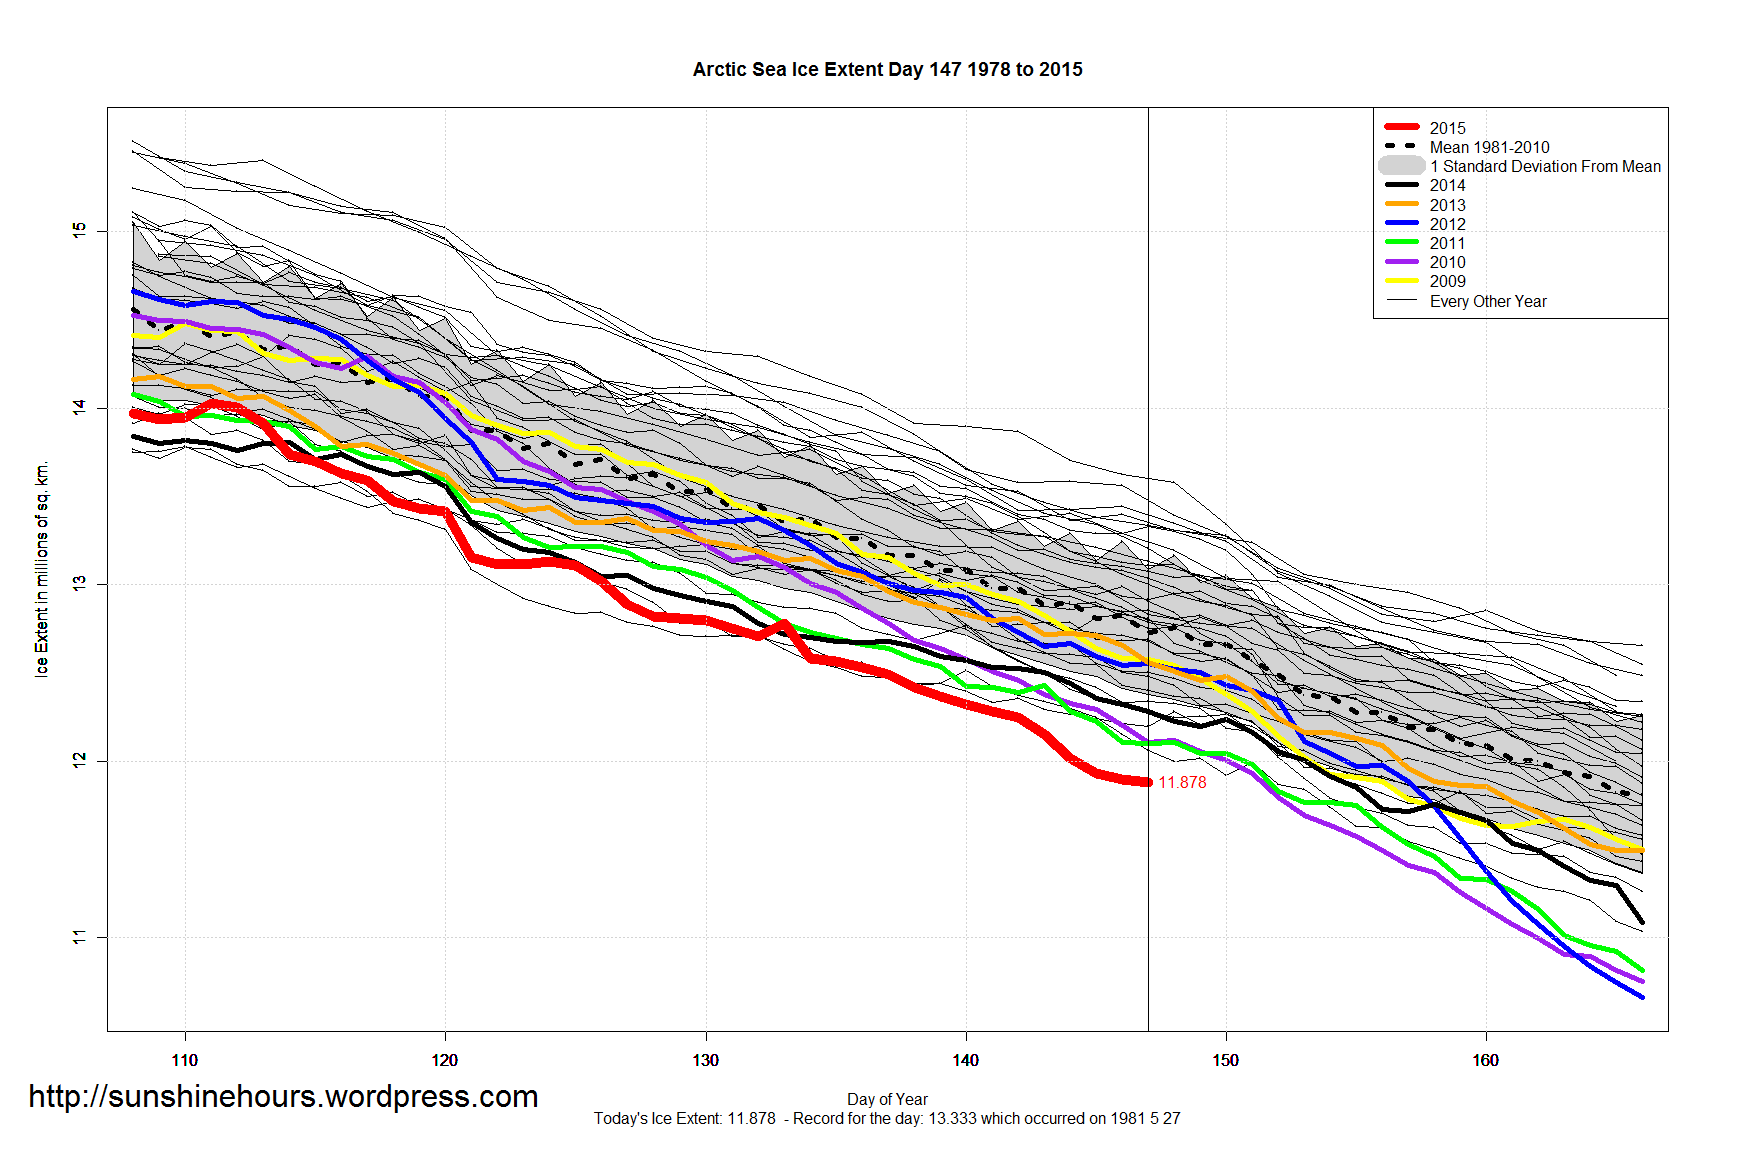
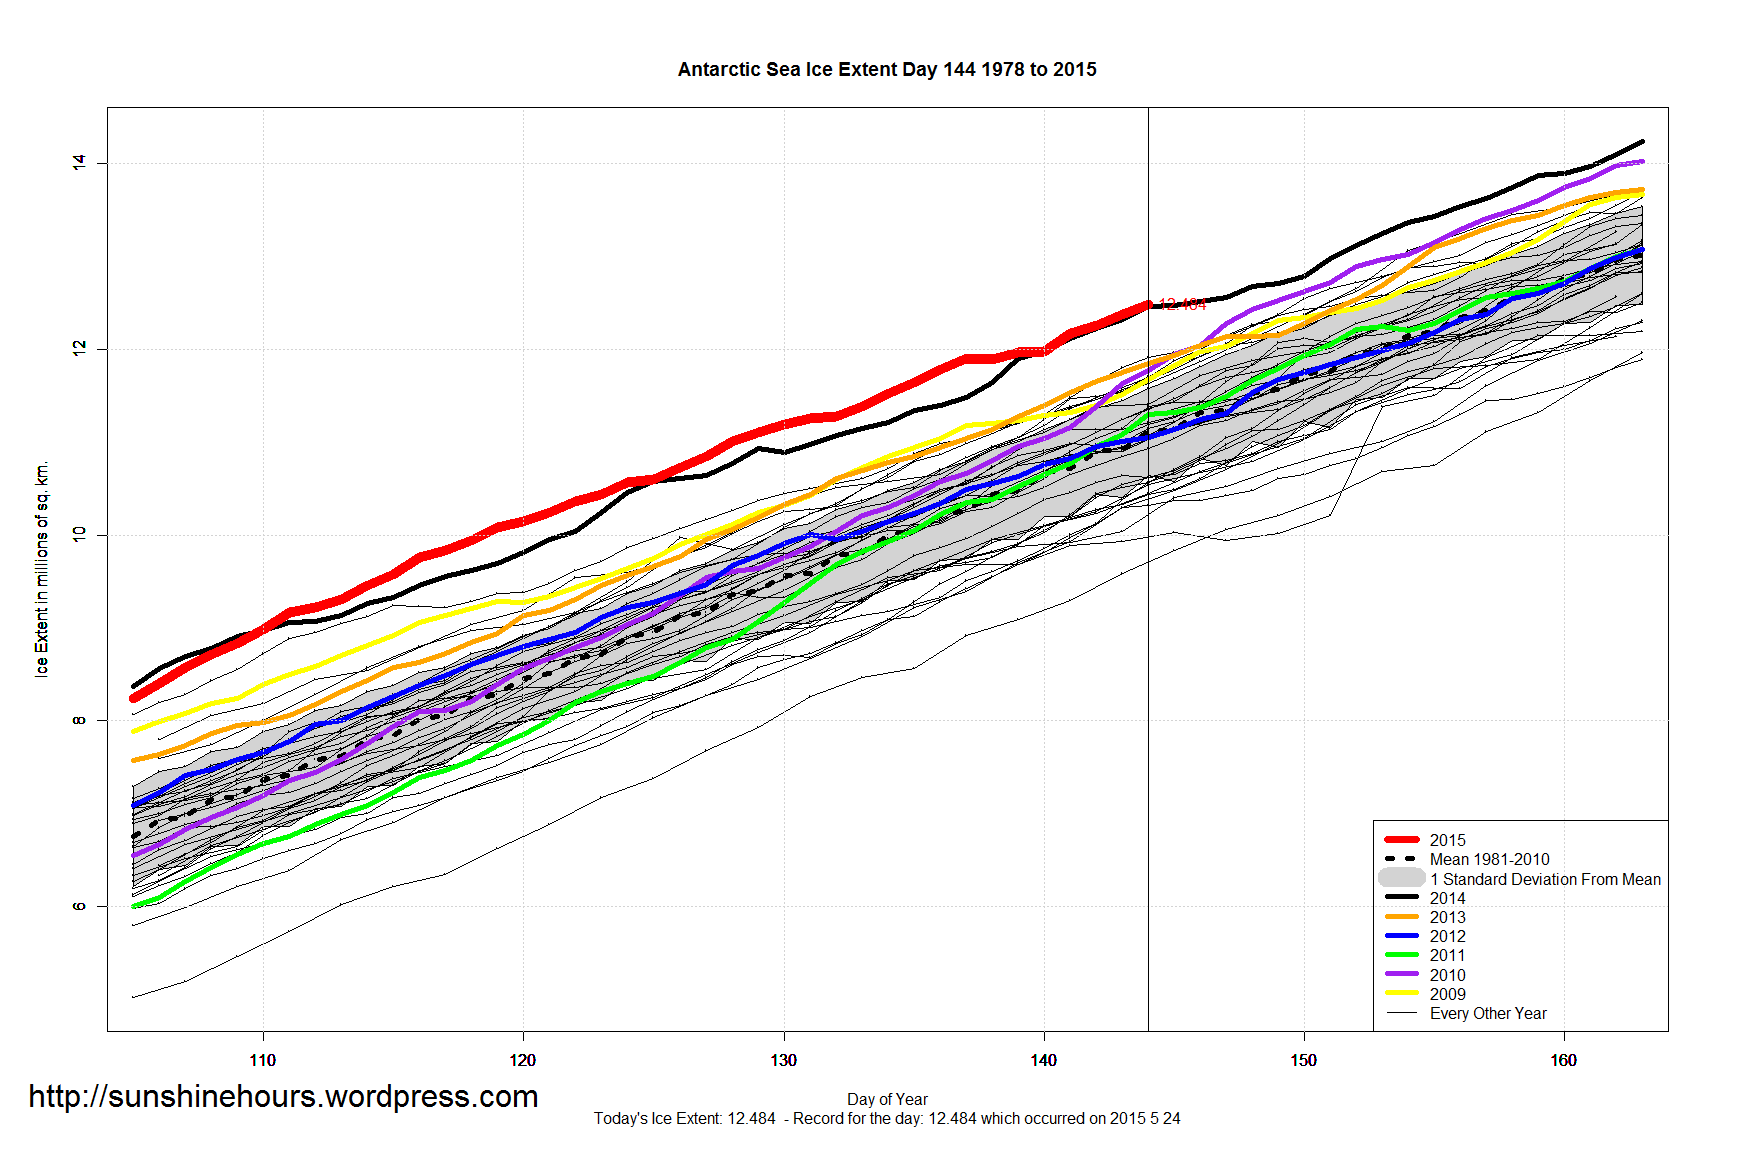
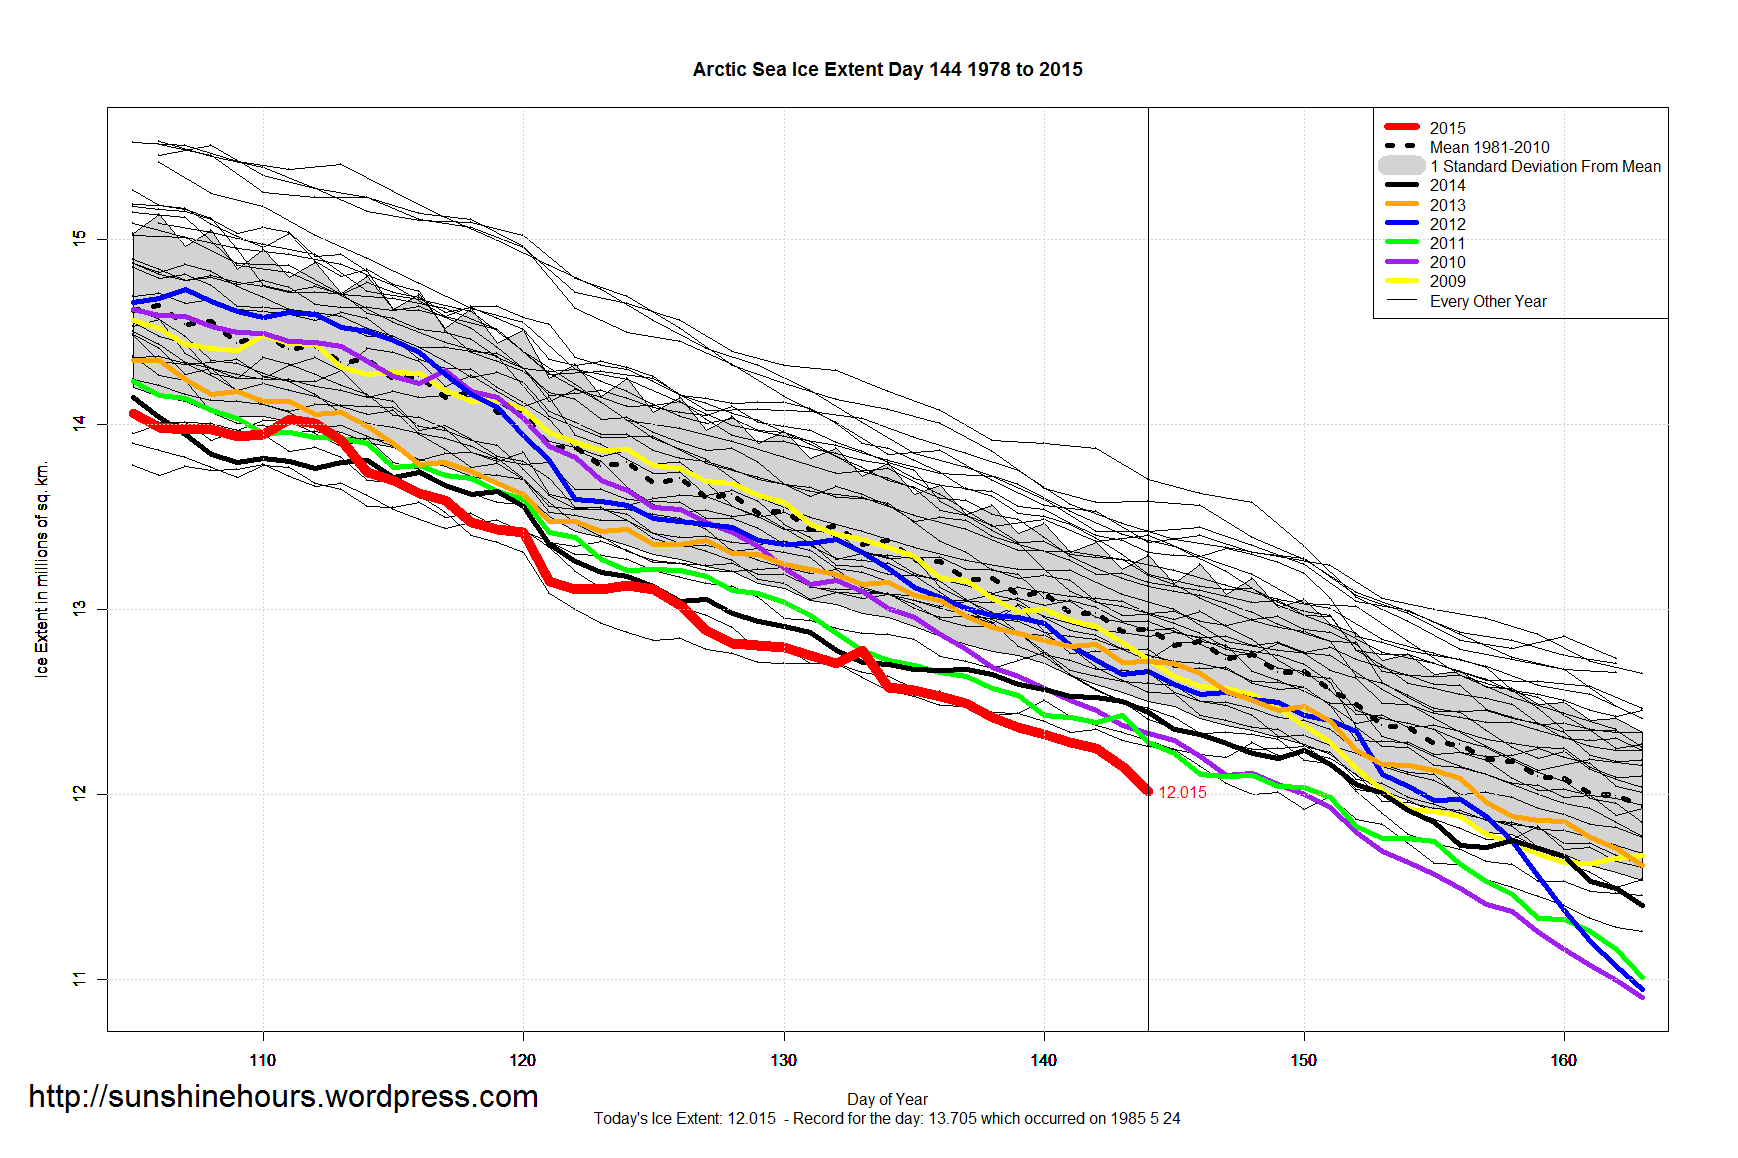
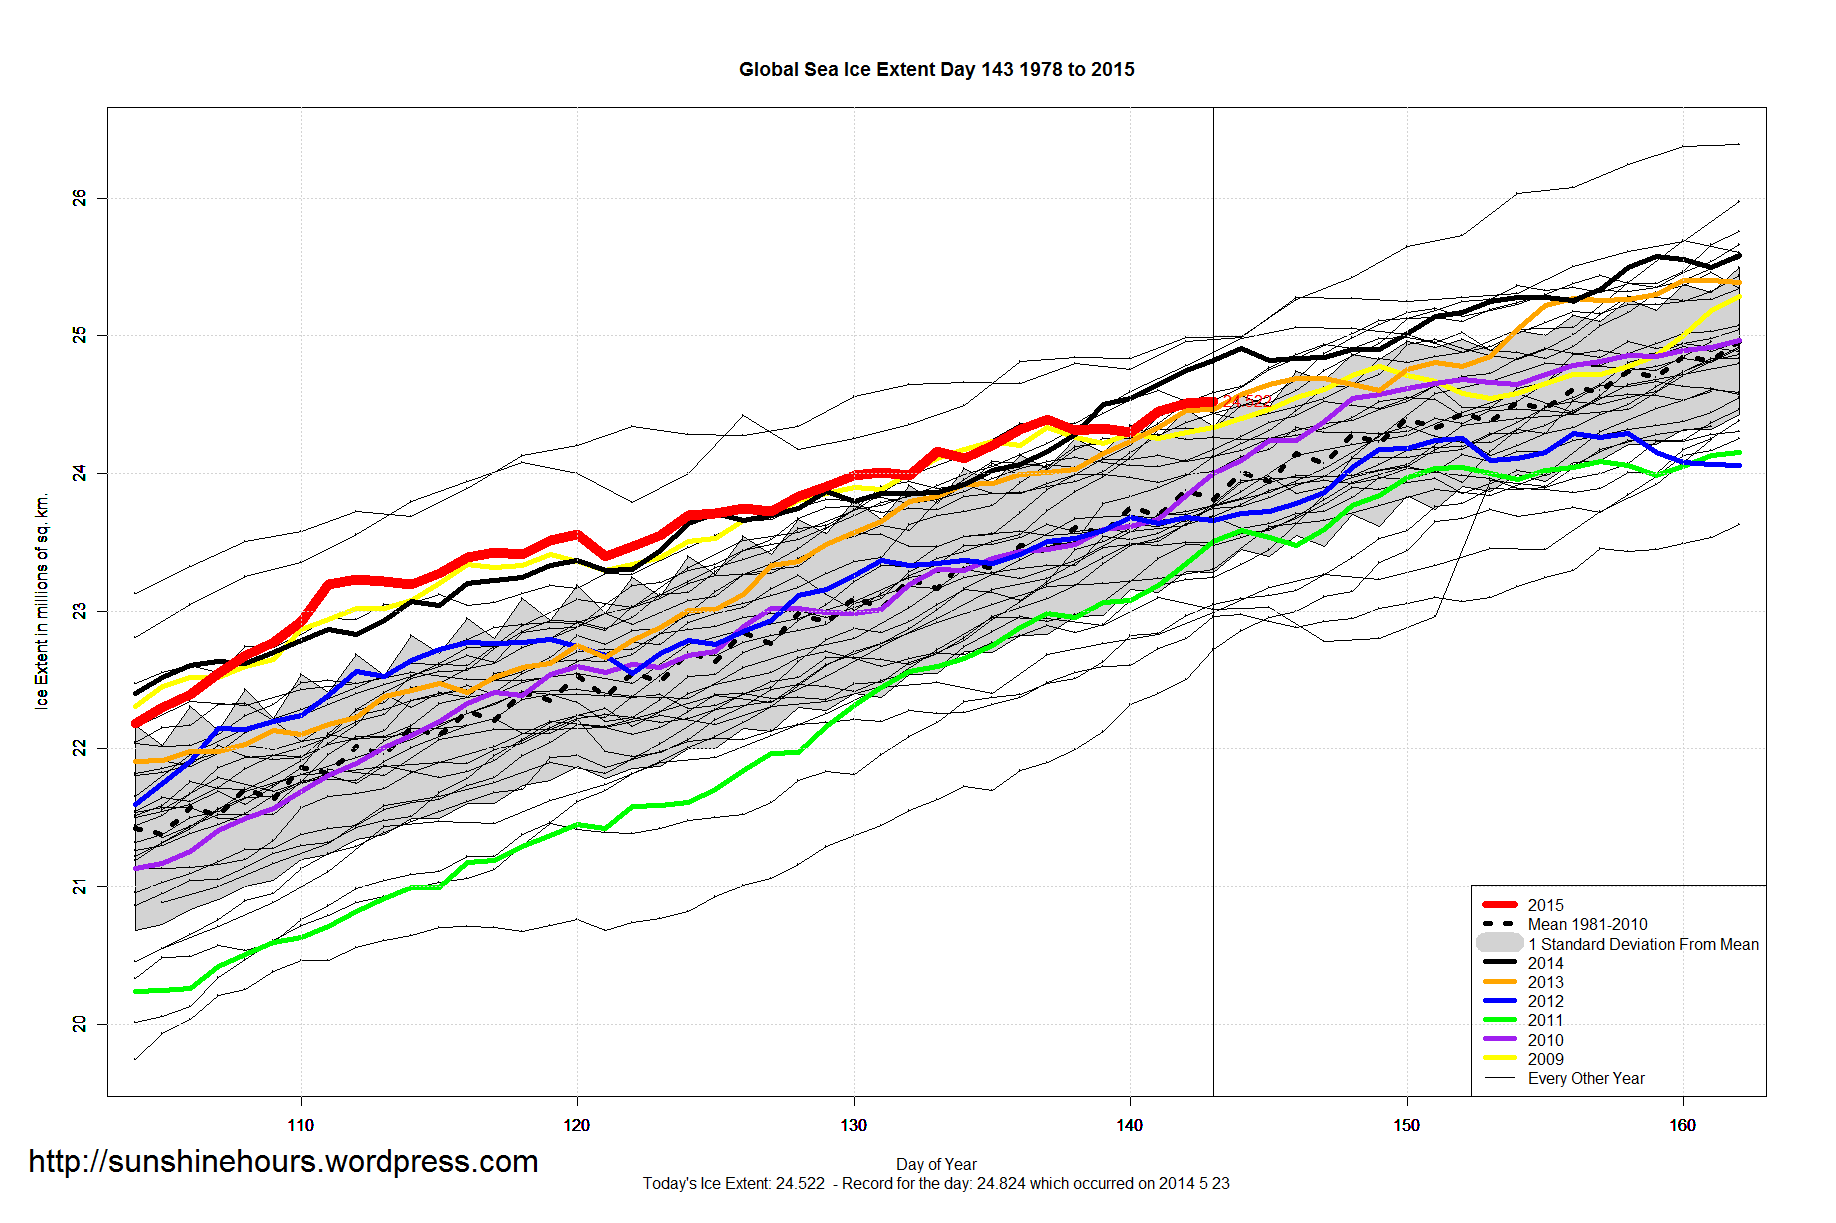
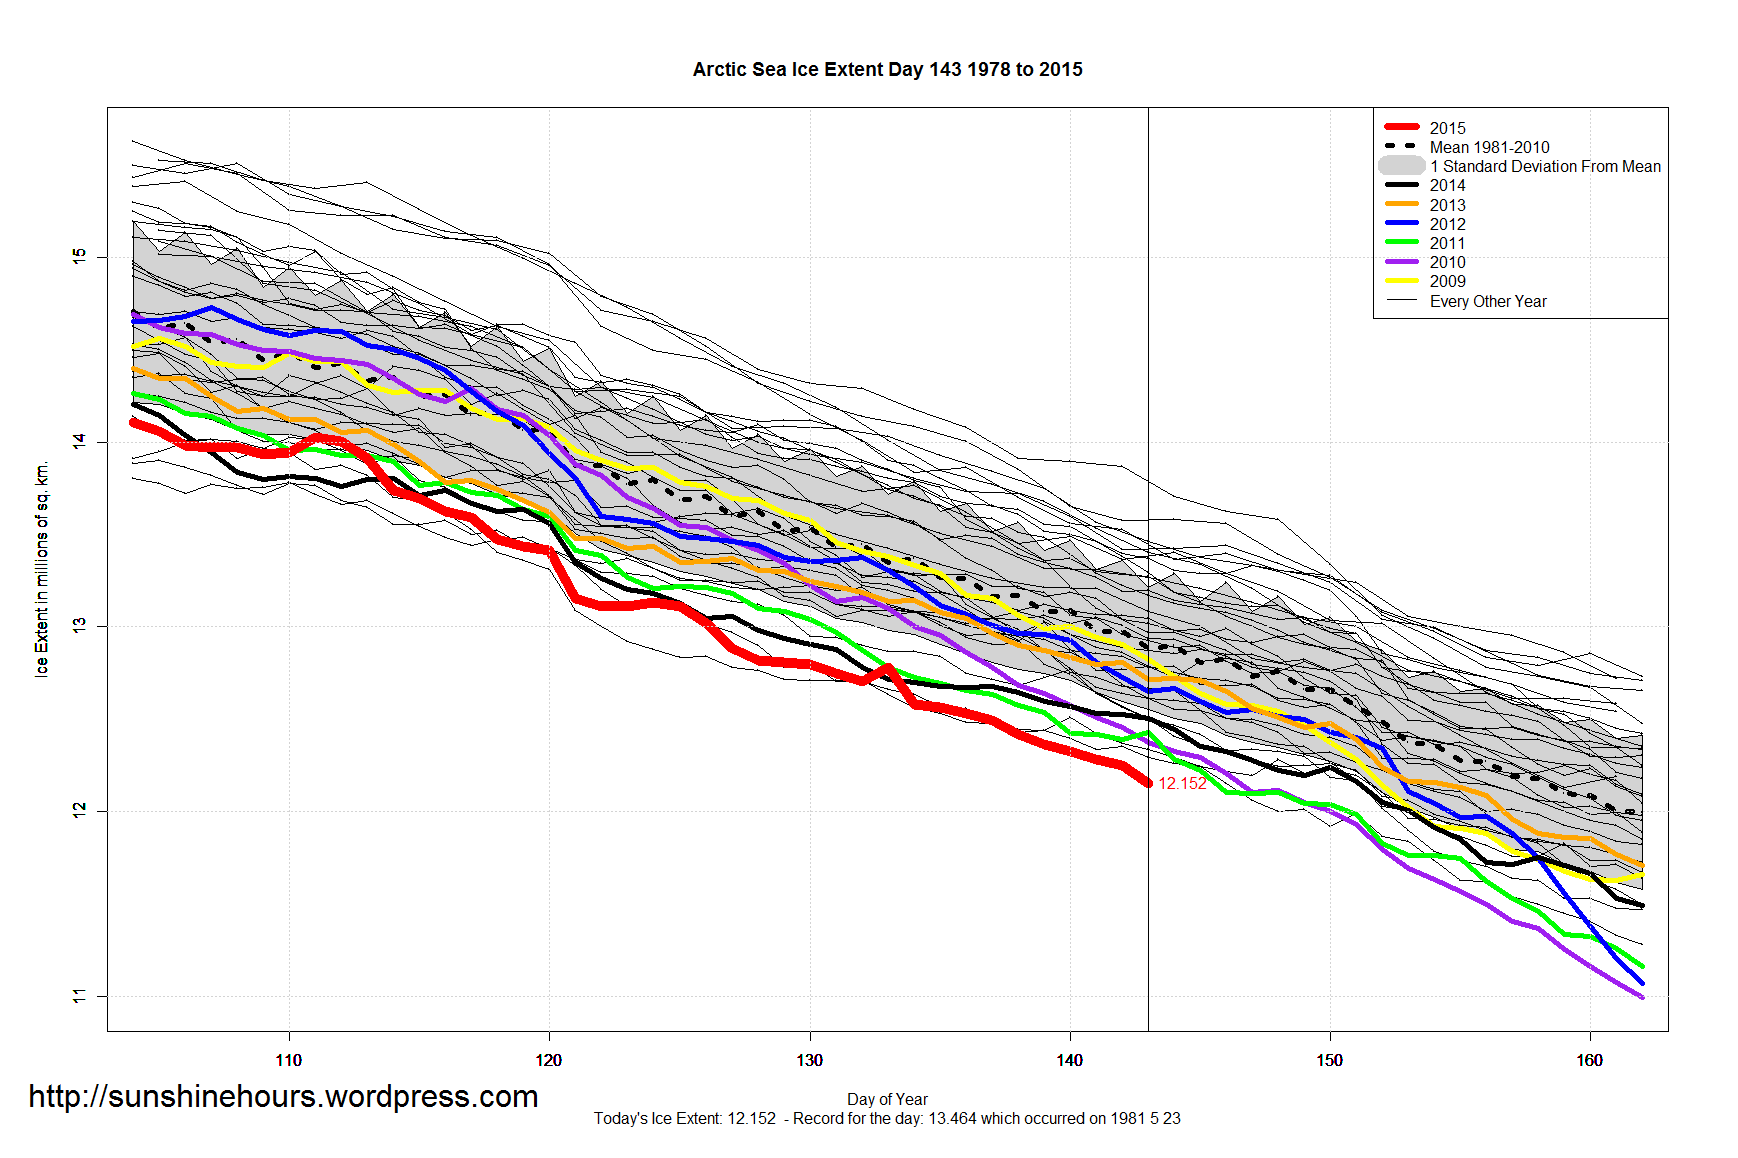
Click for larger: