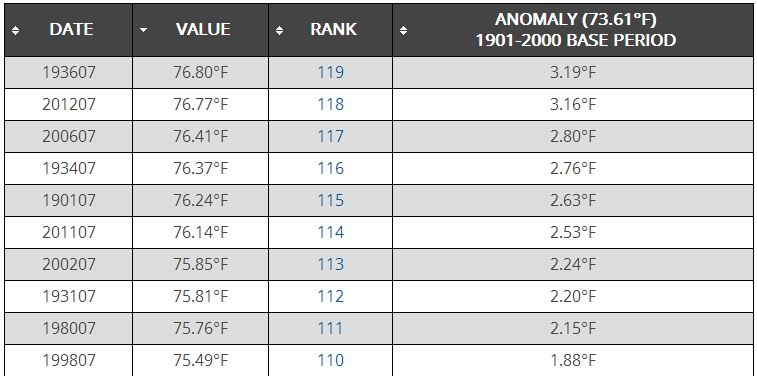
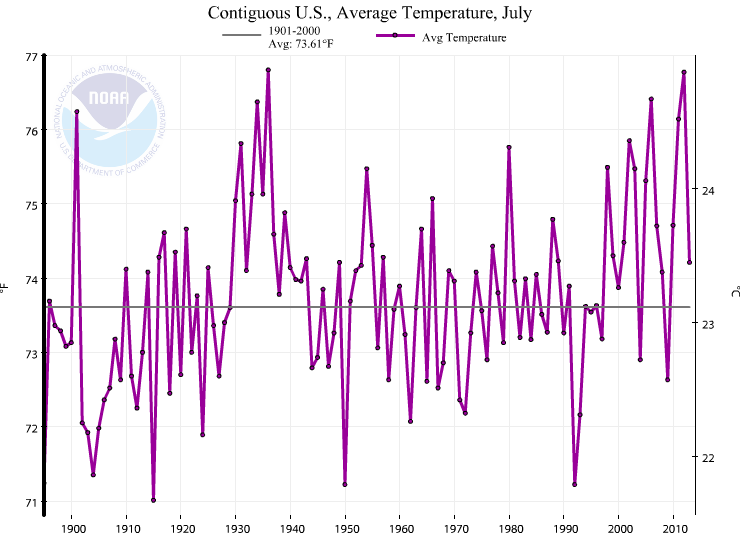
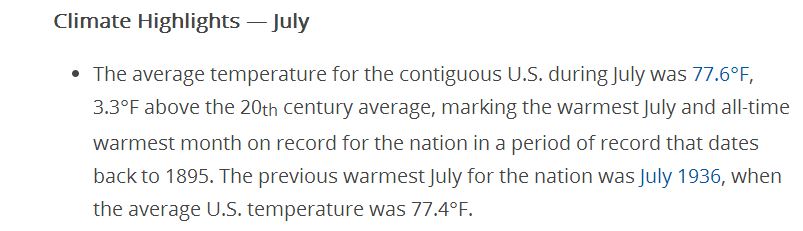
USA NOAA First 5 Months (Jan-May) Were Only Ranked 56 out of 120

According to the NOAA the first 5 months (Jan-May) 2014 was ranked 56th out of 120 (120 = warmest) .

The cooling trend for Jan-May dates back to 1990. 2012 was the hot aberration.

NOAA_Jan_May_2014_Temperature_TREND_1990


These are the anomalies from the Jan-May average. It has been a cold start to the year for the East while warmer in the south west.


cag_[ Statewide Avg Temp Anomalies (average between Jan 2014 and May 2014) ]


Whitehouse Admits Warmer Weather Best For Economy

The White House admitted yesterday that warmer weather is better for the US GDP. (A very slight exaggeration on my part)

3. The first quarter of 2014 was marked by unusually severe winter weather, including record cold temperatures and snowstorms, which explains part of the difference in GDP growth relative to previous quarters. The left chart shows the quarterly deviation in heating degree days from its average for the same quarter over the previous five years. By this measure, the first quarter of 2014 was the third most unusually cold quarter over the last sixty years, behind only the first quarter of 1978 and the fourth quarter of 1976. “

There is some question whether there numbers are correct as this blog post discusses.

The NOAA suggests Q1 had the 9th lowest heating degree days (not the asserted 3rd)


Heating Degree Days 2014 Q1

But I think we can all agree that if more “Heating Degree Days” is bad for the GDP as the White House assets, then fewer “Heating Degree Days” would be better for the economy.

And therefore “Global Warming” is better for the US GDP.

We certainly don’t want to damage the economy by returning to the late 1970’s when “Heating Degree Days” went through the roof!  That would be a disaster for the US economy.

Hurrah!

USA NOAA April 2014 – 3.01F Colder Than April 1925

According to the NOAA April 2014 was ranked 75th out of 120 April’s (120 = warmest) . It was only .66F above the 1901-2000 average.

The 3rd warmest April in US history was in 1925 when it was 3.67F above the 1901-2000 average.

Other April’s warmer than 2014:  1895,1896,1906,1908,1910,1915,1925,1930,1934,1938,1941,1942,1943,1946,1948,1949 ….

NOAA_Apr_2014_Lower_48


The Streak – 1933/1934 and 2011/2012

The Hockey Schtick blog brought a recent paper to my attention.

The abstract says:

A recent observation in NOAA’s National Climatic Data Center’s monthly assessment of the state of the climate was that contiguous US average monthly temperatures were in the top third of monthly ranked historical temperatures for thirteen straight months from June 2011 — June 2012. The chance of such a streak occurring randomly was quoted as (1/3)13, or about one in 1.6 million.”

I’m not going to discuss the “chances”. But I am going to simply note the following.

The NOAA ranks months temperature and precipitation based on the number of months from 1895. So 2012 was the 118th year. If a month is ranked 118 (as of 2012) then it was the warmest month from 1895 to 2012.

Using the same 12 month June to June time frame and using data from October 2012 ( before NOAA’s recent update) it took me about 10 minutes to find out a similar streak.

From June 1933 to to June 1934 8 months were ranked 100 and above. 2 of them were ranked 118.

From June 2011 to June 2012 8 months were ranked 100 and above. 1 of them was ranked 118.


year Month Rank
1933 6 118
1933 7 104
1933 9 116
1933 12 115
1934 1 114
1934 4 107
1934 5 118
1934 6 108


year Month Rank
2011 7 114
2011 8 117
2012 1 115
2012 2 104
2012 3 118
2012 4 116
2012 5 117
2012 6 107

What are the odds of that occurring 80 years apart!


USA NOAA March 2014 – 43rd Coldest – Colder Than 1898,1900,1901,1902,1903,1904,1905,1907 …

According to the NOAA March 2014 was 43rd coldest out of 120 March’s.

That is the 2nd March in a row colder than the 1901-2000 average.

This is a partial list of the March’s warmer than 2014: 1898,1900,1901,1902,1903,1904,1905,1907,1908,1910,1911,1914,1916,1918,1919,1921,1925,1927,1928,1929,1933,1934,1935,1936,1938,1939 … 

NOAA_Mar_2014


NOAA Precipitation Update as of Feb 2014 – Last 12 Months Were Normal

I missed this when it came out last month, but according to the NOAA Precipitation for the 12 month period ending February 2014 was normal.

It was .19 inches above the 1901-2000 mean.

Wasn’t there supposed to be a permanent “Climate Change” drought?


NOAA_Feb_2014_Precipitation_12 Months


Addendum: If you split the NOAA Climate History in two (March – February), these are the averages:

1895 – 1955 = 29.45 inches

http://www.ncdc.noaa.gov/cag/time-series/us/110/00/pcp/12/02/1895-2014?base_prd=true&firstbaseyear=1896&lastbaseyear=1955

1956 – 2014 = 30.44

http://www.ncdc.noaa.gov/cag/time-series/us/110/00/pcp/12/02/1895-2014?base_prd=true&firstbaseyear=1956&lastbaseyear=2014


One last one:

1980 – 2014 = 30.75 inches

http://www.ncdc.noaa.gov/cag/time-series/us/110/00/pcp/12/02/1895-2014?base_prd=true&firstbaseyear=1980&lastbaseyear=2014


Climate Change … bringer of slightly more precipitation.