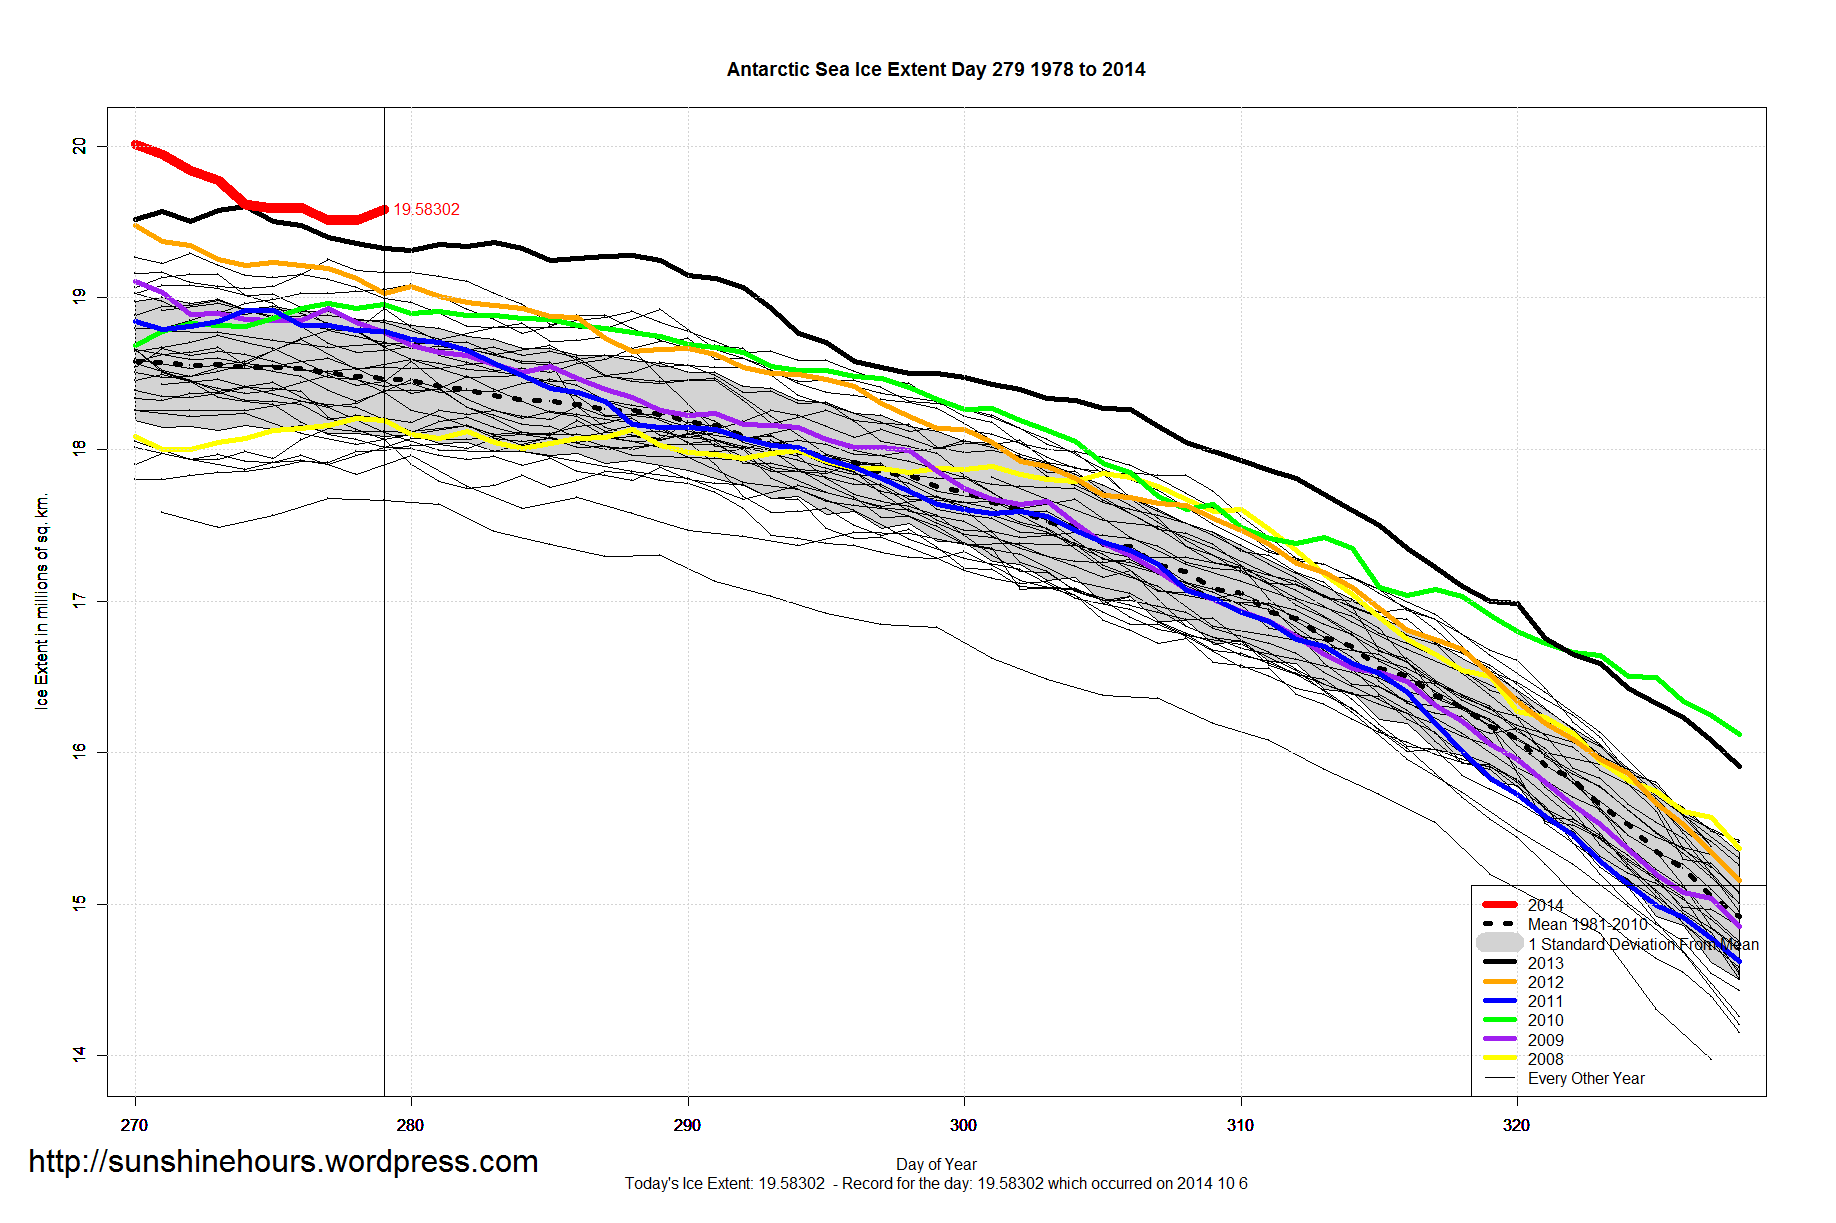
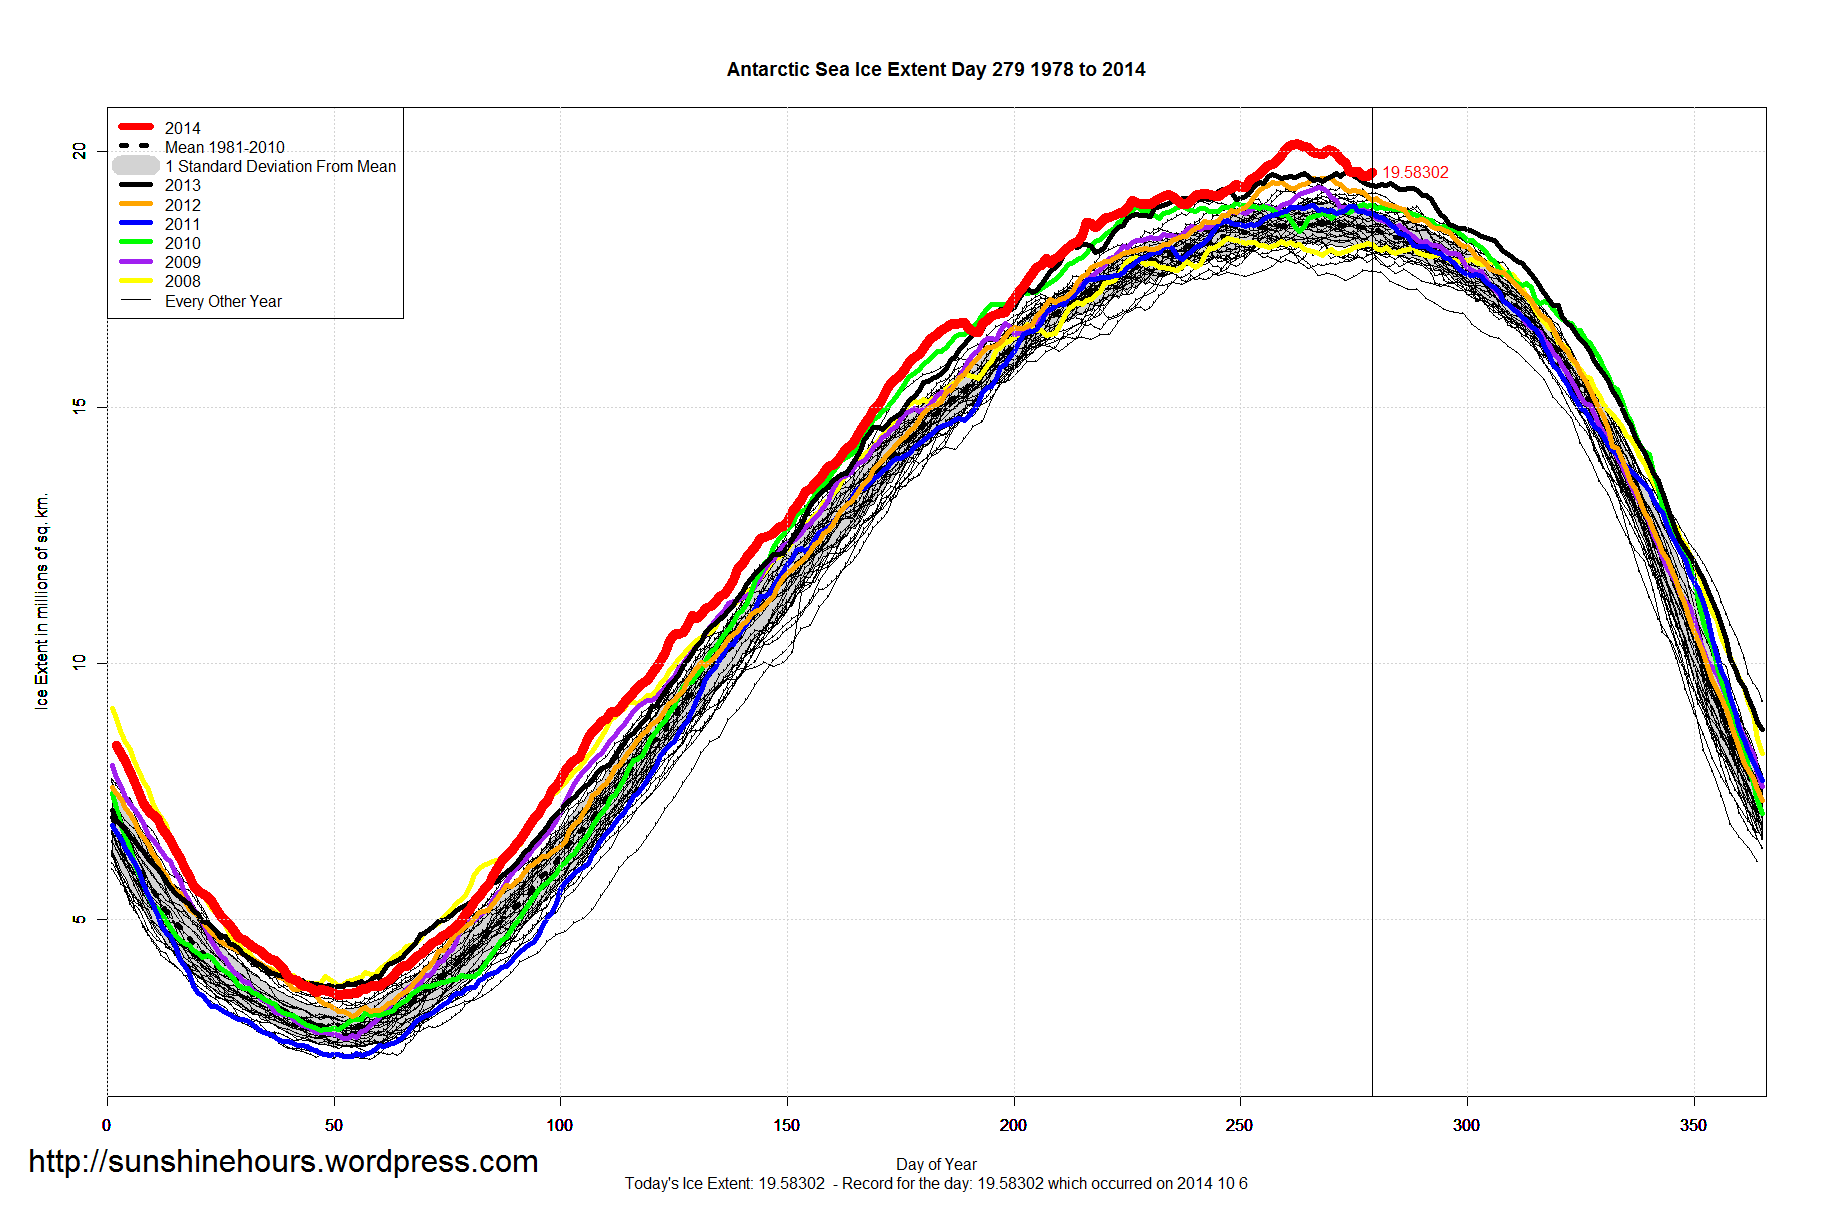
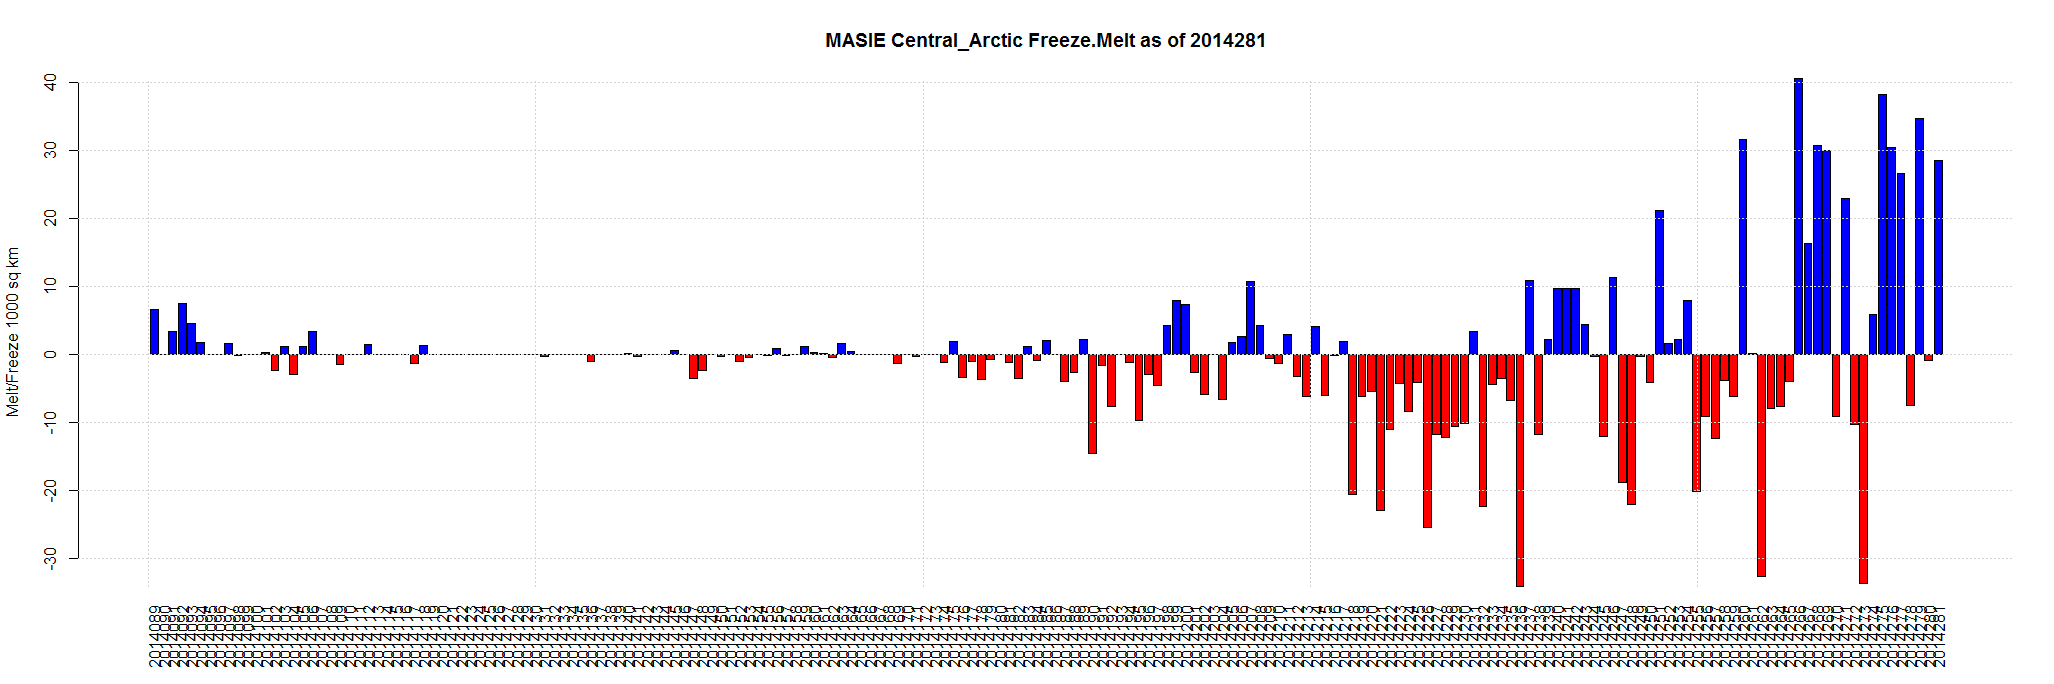
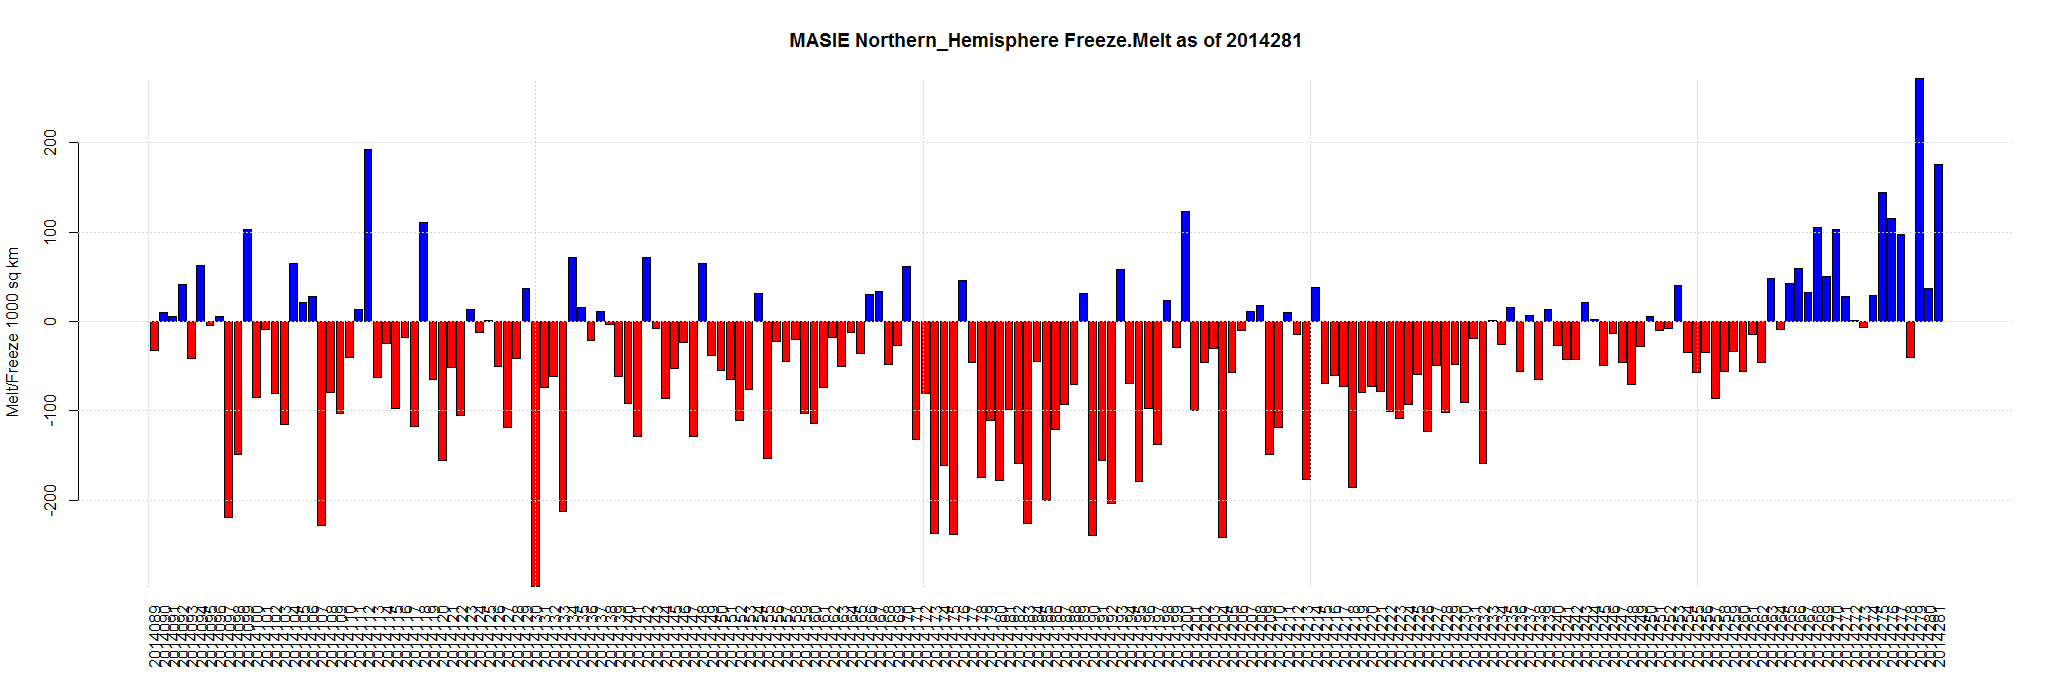
Oct 09 2014 MASIE Update – Big Gain – Every Region Still With Ice Gained More Ice
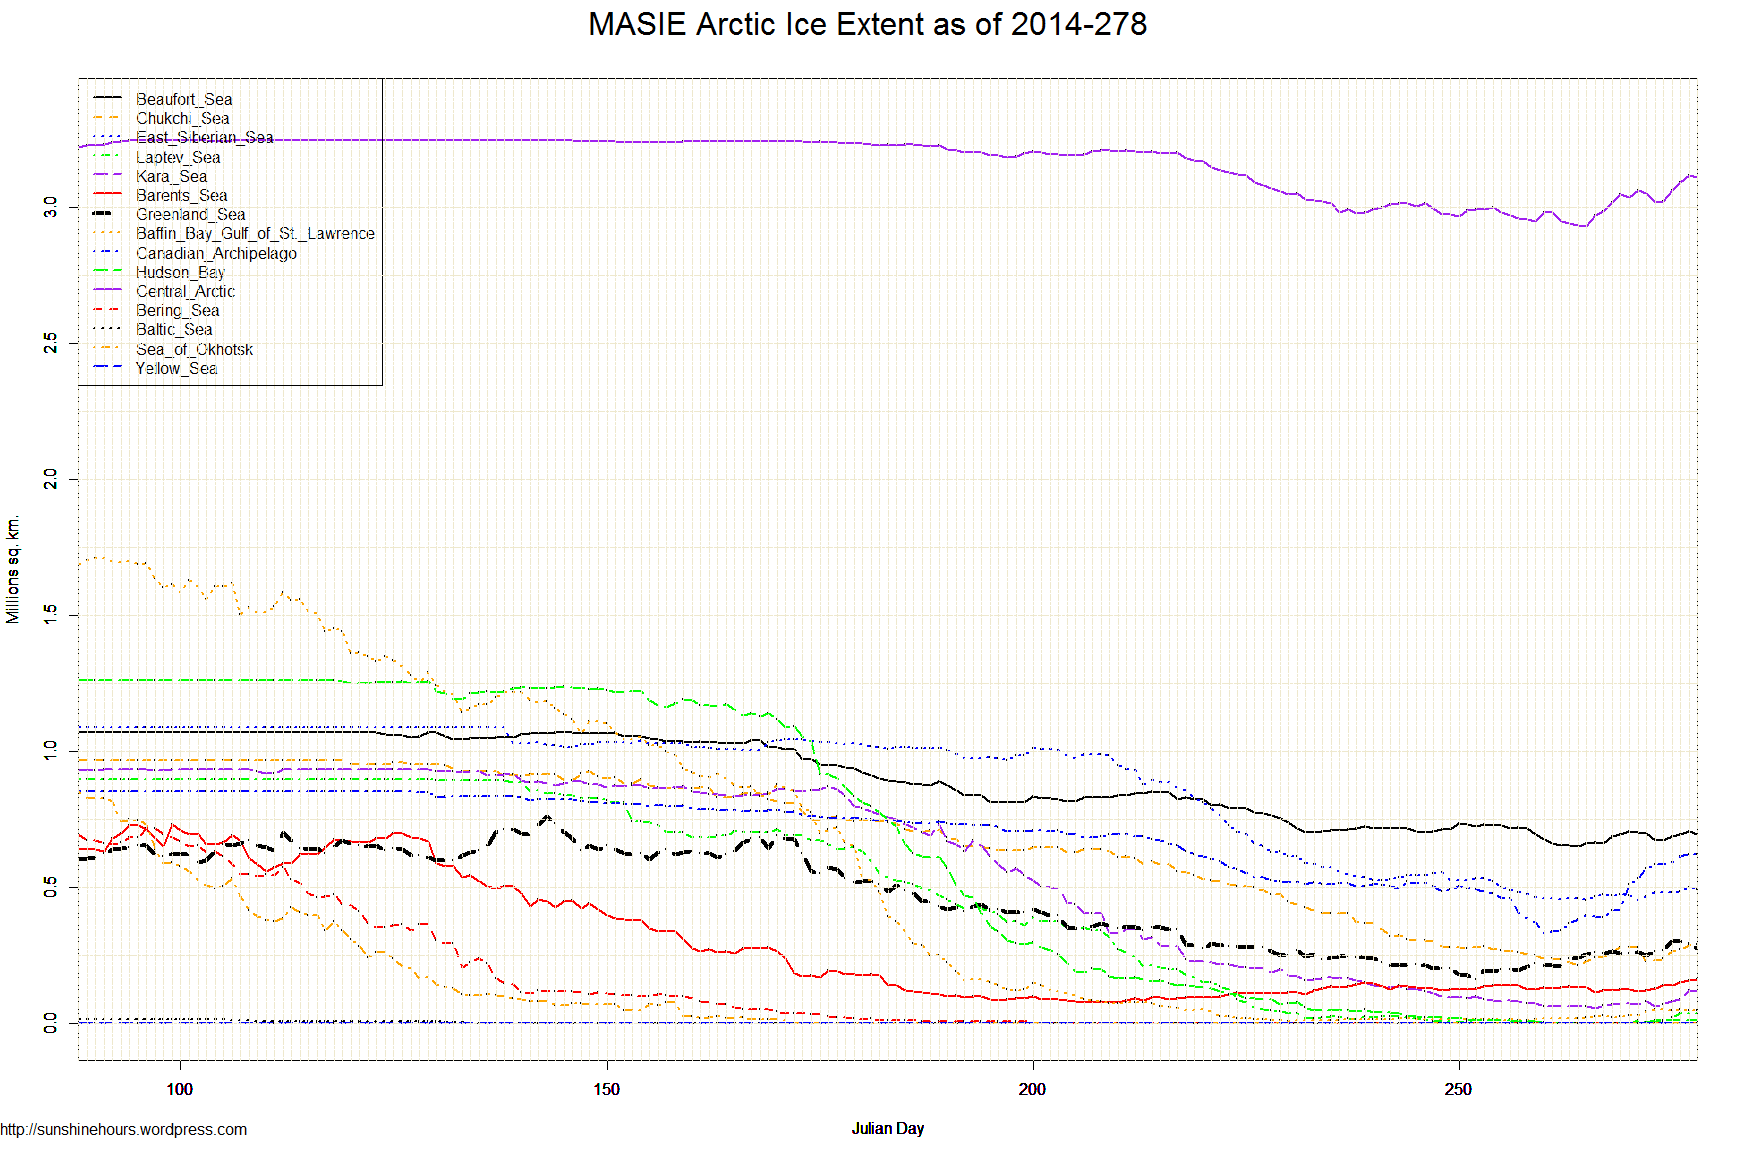
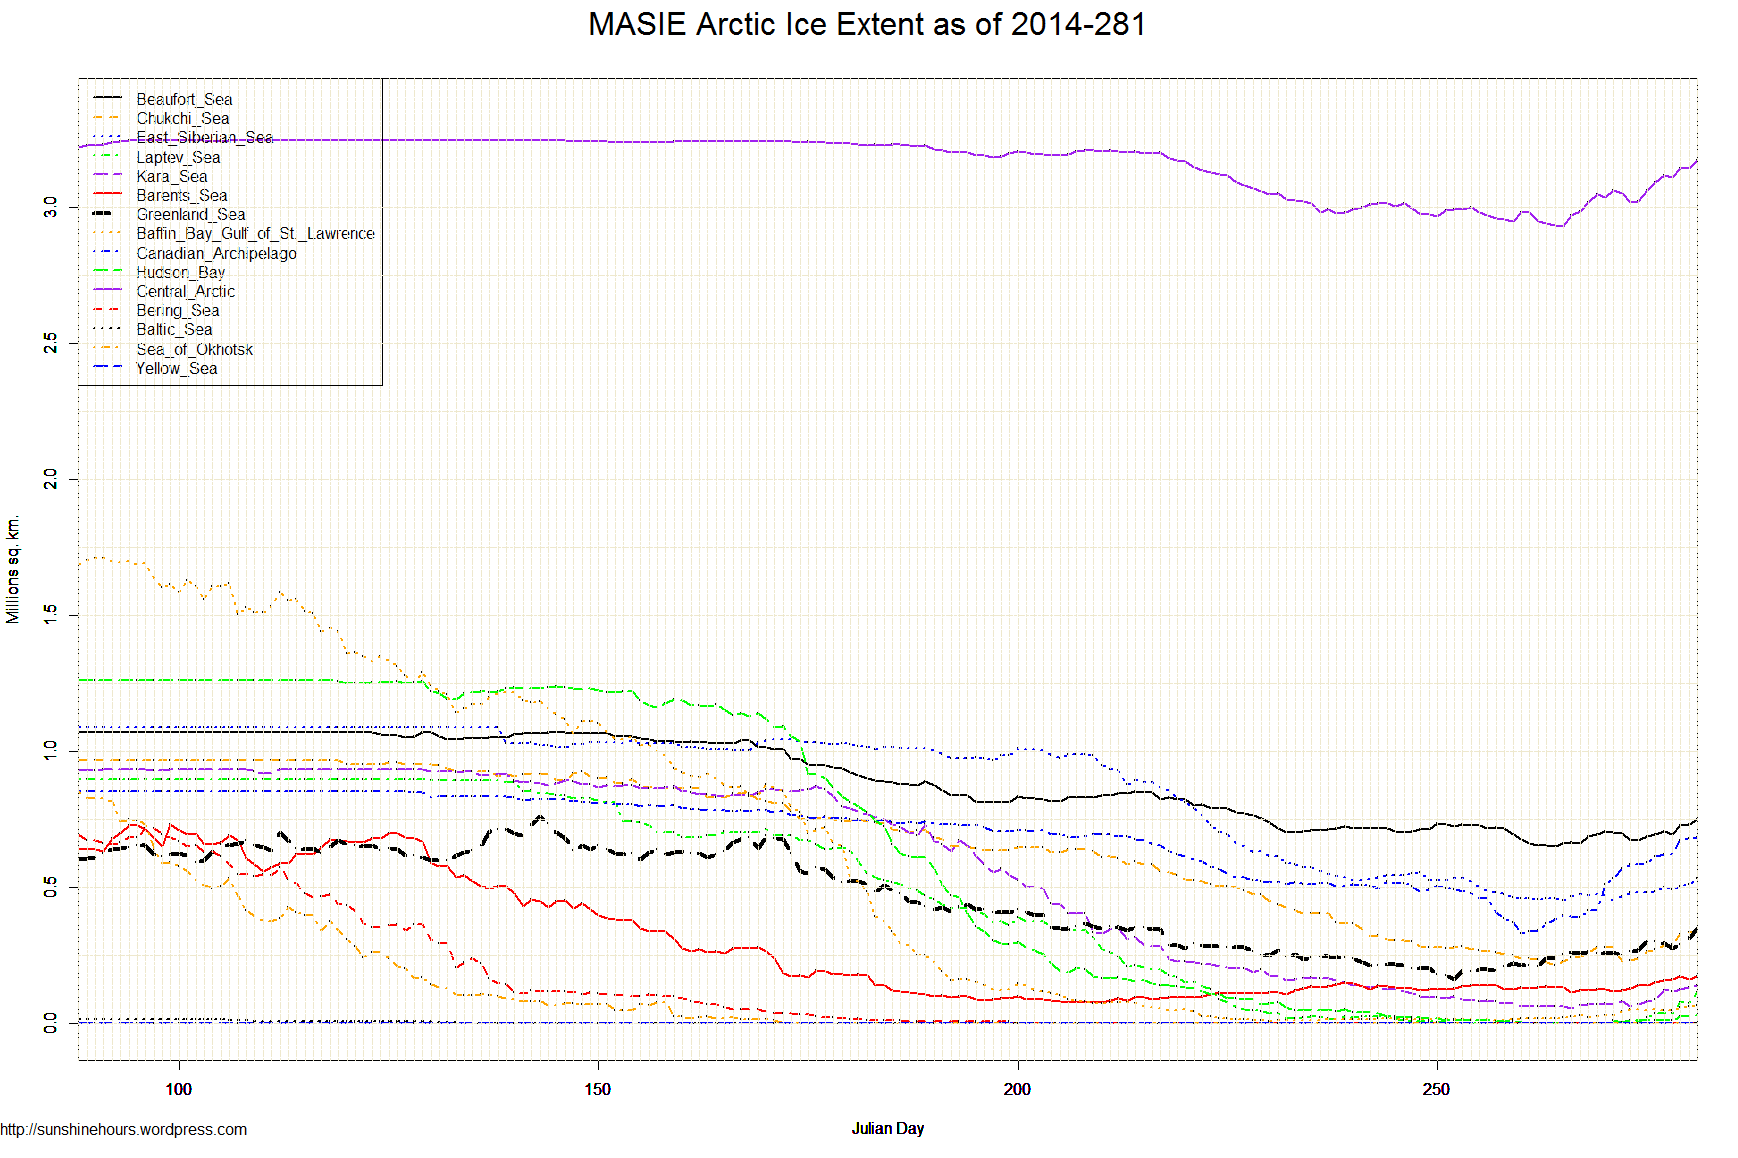
Data here. Click for bigger.
| Region | 194 days ago | End | Last 193 | Last 28 | Last 14 | Last 7 | Last 3 | Last 1 |
| Bering Sea | 697,324 | 0 | -697,324 | 0 | 0 | 0 | 0 | 0 |
| Baltic Sea | 15,337 | 0 | -15,337 | 0 | 0 | 0 | 0 | 0 |
| Sea of Okhotsk | 853,240 | 0 | -853,240 | 0 | 0 | 0 | 0 | 0 |
| Yellow Sea | 0 | 0 | 0 | 0 | 0 | 0 | 0 | 0 |
| Chukchi Sea | 966,006 | 335,001 | -631,005 | 52,805 | 86,108 | 96,399 | 42,123 | 314 |
| Baffin Bay Gulf of St. Lawrence | 1,688,530 | 65,308 | -1,623,223 | 50,872 | 36,064 | 12,430 | 16,039 | 2,278 |
| Canadian Archipelago | 853,214 | 683,668 | -169,547 | 196,530 | 292,248 | 99,709 | 62,394 | 2,386 |
| Hudson Bay | 1,260,903 | 29,757 | -1,231,146 | 16,972 | 28,309 | 19,382 | 19,382 | 2,578 |
| Kara Sea | 933,859 | 141,662 | -792,198 | 52,816 | 75,915 | 69,649 | 24,314 | 6,854 |
| Barents Sea | 645,917 | 171,904 | -474,013 | 33,741 | 50,010 | 33,013 | 8,234 | 10,550 |
| Beaufort Sea | 1,070,445 | 752,106 | -318,339 | 18,871 | 90,446 | 79,678 | 58,062 | 19,931 |
| East Siberian Sea | 1,087,137 | 534,651 | -552,486 | -559 | 61,101 | 53,680 | 42,064 | 23,803 |
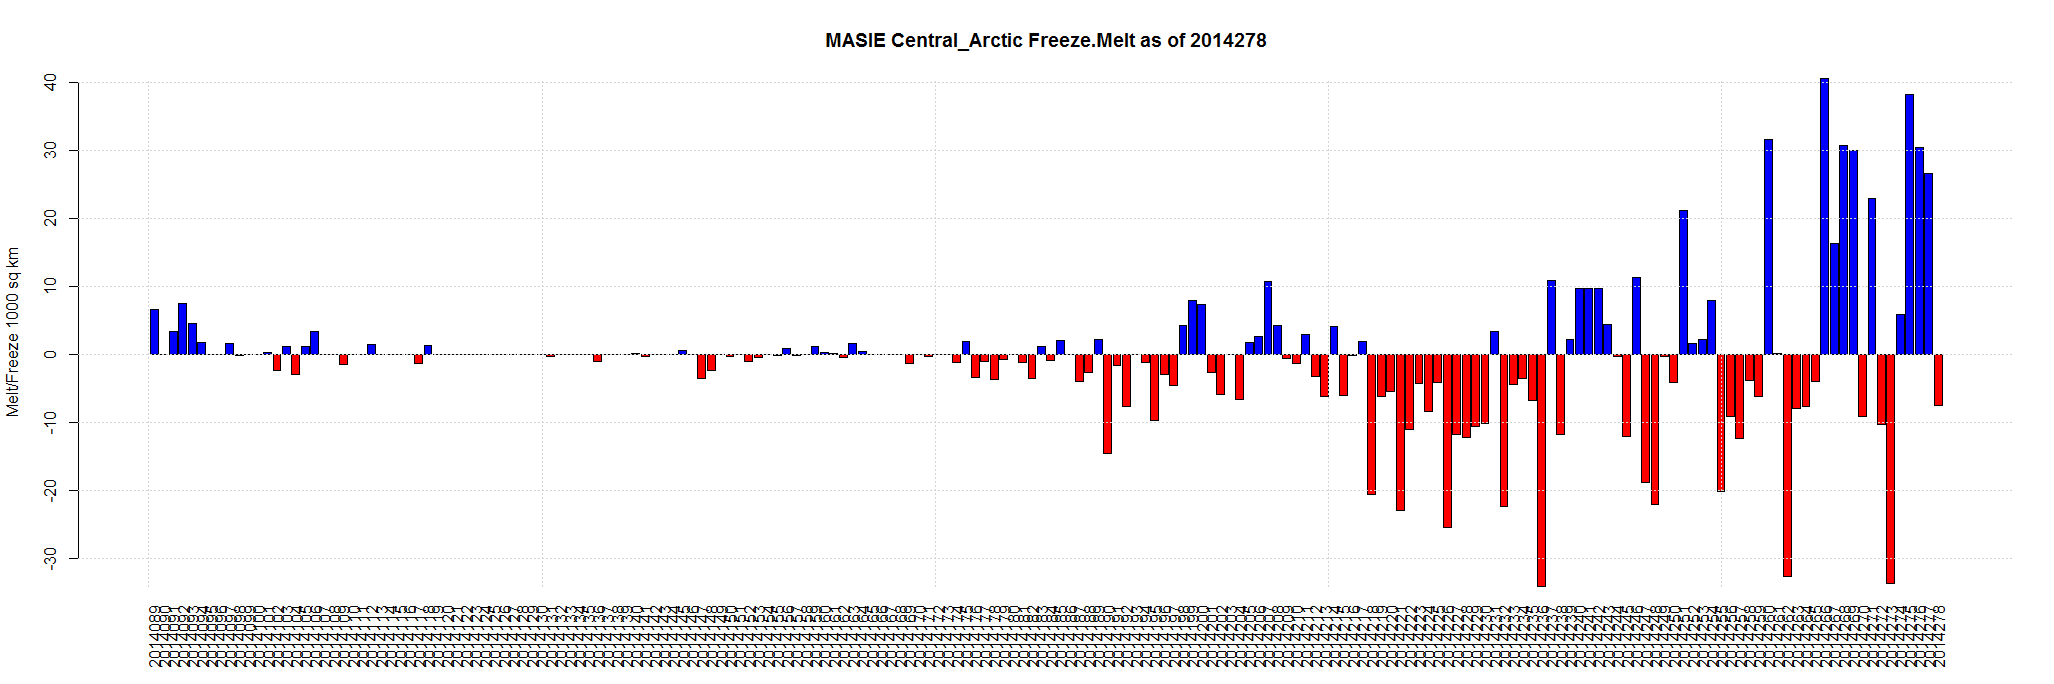
| Central Arctic | 3,221,921 | 3,172,976 | -48,945 | 179,325 | 186,389 | 149,917 | 62,278 | 28,512 |
| Greenland Sea | 603,416 | 348,954 | -254,461 | 152,450 | 91,727 | 78,556 | 72,701 | 37,205 |
| Laptev Sea | 897,845 | 114,502 | -783,343 | 112,707 | 113,153 | 108,890 | 77,396 | 41,561 |
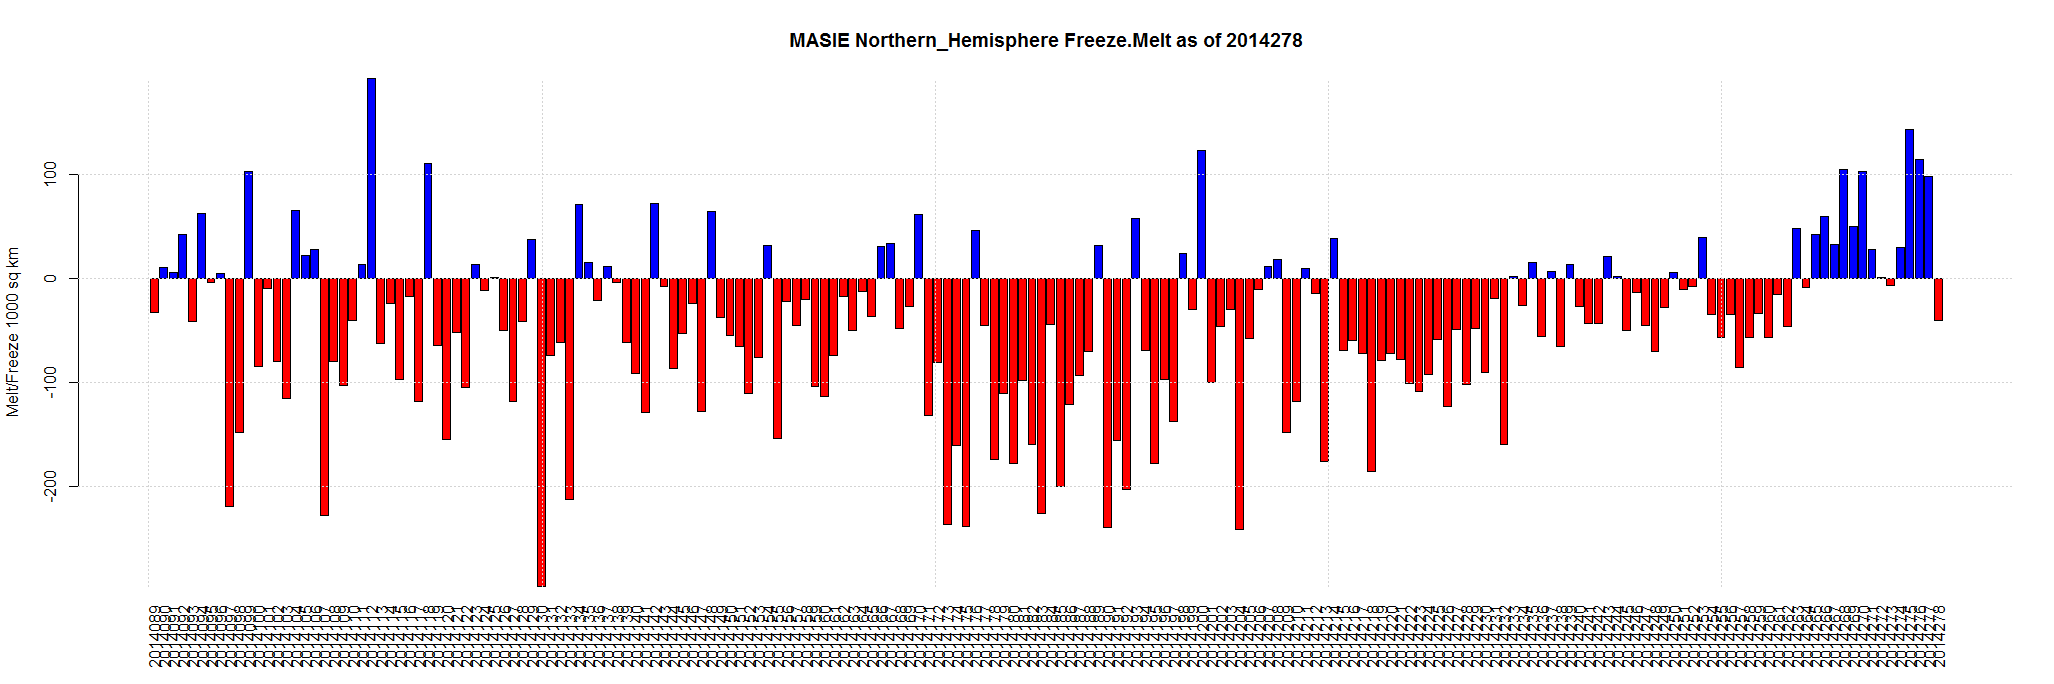
| Northern Hemisphere (Total) | 14,805,115 | 6,351,630 | -8,453,485 | 866,802 | 1,111,471 | 801,304 | 484,986 | 175,973 |
| NH (Average Loss per Day) | -43,575 | 30,957 | 79,391 | 114,472 | 161,662 | 175,973 |