May 15 2014 MASIE Update
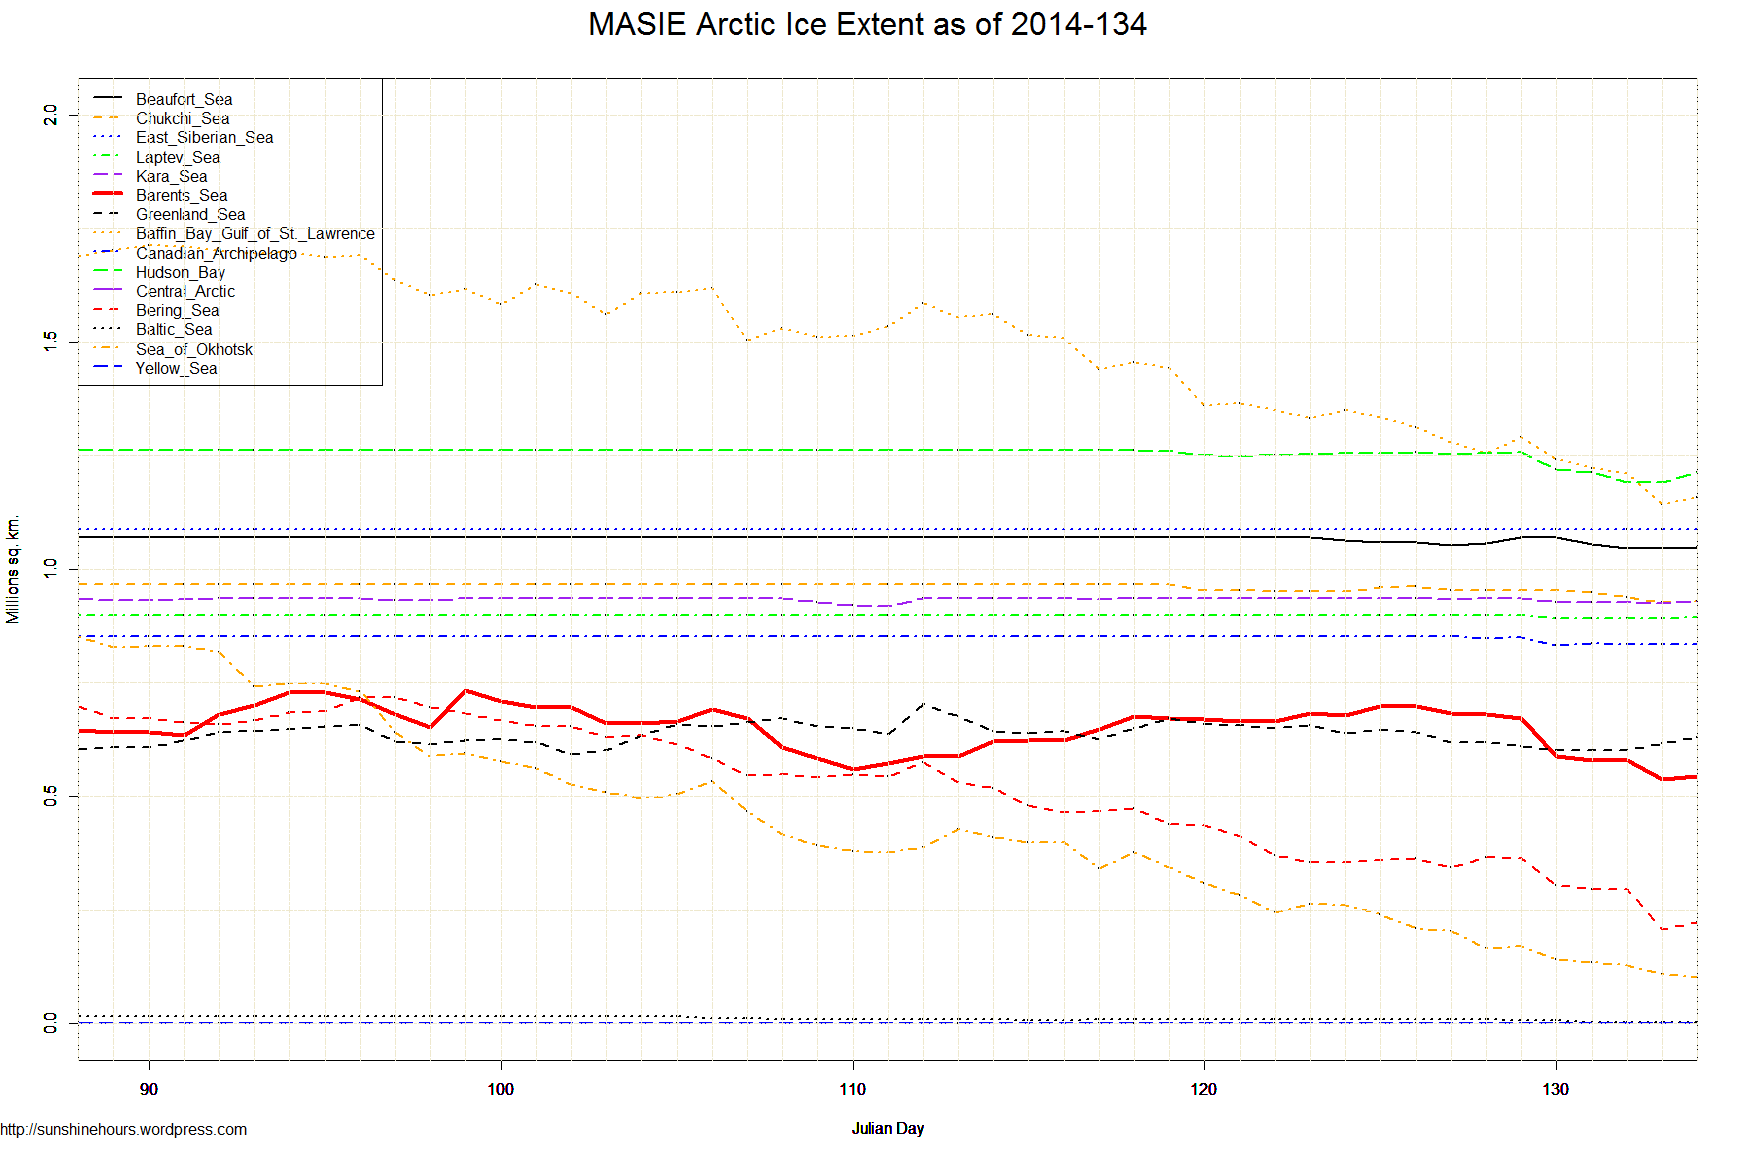
This is the gain/loss up to day 131. Negative = loss. Sorted with biggest loser in last 7 days at top. Northern Hemisphere is the grand total.
A 71,559 sq km increase from day 133 to 134. Almost all the regions had some increase or flattening except for the Sea of Okhotsk.
| Region | Start | End | Last 46 Days | Last 28 | Last 14 | Last 7 | Last 3 | Last 1 |
| Barents Sea | 645,917 | 544,139 | -101,778 | -146,436 | -124,548 | -139,140 | -34,559 | 6,021 |
| Baffin Bay Gulf of St. Lawrence | 1,688,530 | 1,158,003 | -530,527 | -460,820 | -203,730 | -122,201 | -64,200 | 14,531 |
| Bering Sea | 697,324 | 223,502 | -473,821 | -361,304 | -212,024 | -120,356 | -71,689 | 16,065 |
| Sea of Okhotsk | 853,240 | 102,095 | -751,145 | -430,119 | -206,663 | -100,859 | -32,112 | -6,286 |
| Hudson Bay | 1,260,903 | 1,213,477 | -47,426 | -47,426 | -37,835 | -38,325 | -614 | 22,303 |
| Chukchi Sea | 966,006 | 928,313 | -37,693 | -37,693 | -25,831 | -24,215 | -20,492 | 513 |
| Canadian Archipelago | 853,214 | 834,183 | -19,031 | -19,031 | -19,031 | -17,769 | -1,864 | -96 |
| Kara Sea | 933,859 | 928,578 | -5,282 | -6,446 | -6,446 | -6,255 | 2,163 | 3,886 |
| Baltic Sea | 15,337 | 2,673 | -12,664 | -8,595 | -5,834 | -5,729 | -954 | -34 |
| Laptev Sea | 897,845 | 893,342 | -4,503 | -4,503 | -4,503 | -4,503 | 683 | 683 |
| Beaufort Sea | 1,070,445 | 1,048,548 | -21,897 | -21,897 | -21,897 | -4,467 | -6,795 | 2,164 |
| Central Arctic | 3,221,921 | 3,247,742 | 25,821 | -271 | -271 | -271 | 0 | 0 |
| East Siberian Sea | 1,087,137 | 1,087,137 | 0 | 0 | 0 | 0 | 0 | 0 |
| Yellow Sea | 0 | 0 | 0 | 0 | 0 | 0 | 0 | 0 |
| Greenland Sea | 603,416 | 629,681 | 26,265 | -23,916 | -28,065 | 9,649 | 28,749 | 11,808 |
| Northern Hemisphere (Total) | 14,805,115 | 12,842,910 | -1,962,204 | -1,571,232 | -897,388 | -575,135 | -201,765 | 71,559 |

![cag_[ Statewide Precipitation Anomalies (accumulation between Mar 2014 and Apr 2014) ]](https://sunshinehours.net/wp-content/uploads/2014/05/cag_-statewide-precipitation-anomalies-accumulation-between-mar-2014-and-apr-2014.jpg)