Antarctic Sea Ice Extent Stats for 2013 (As Of Oct 22)

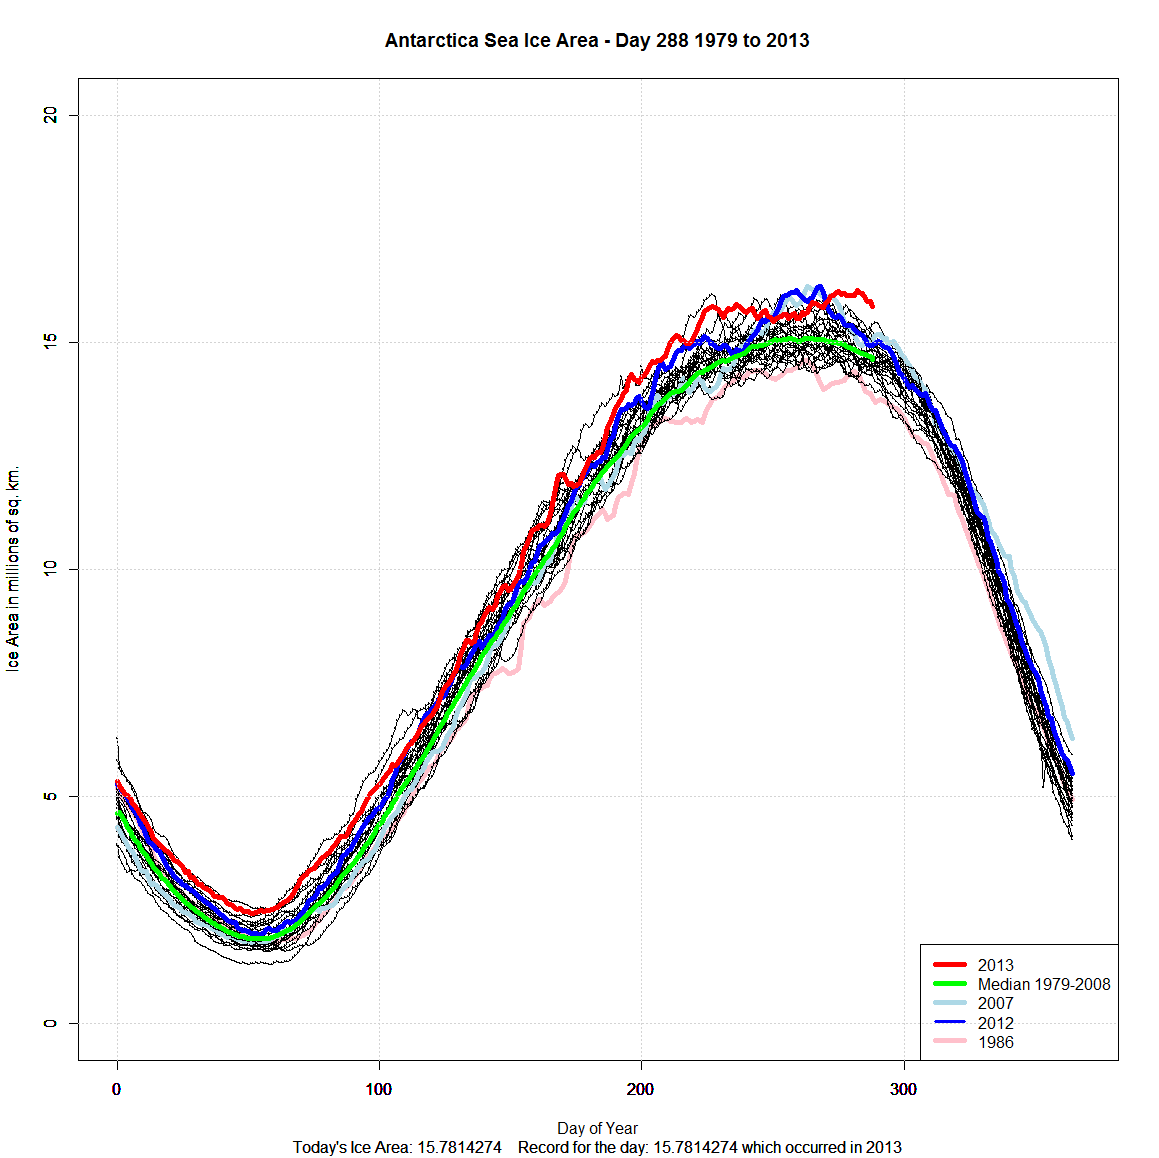
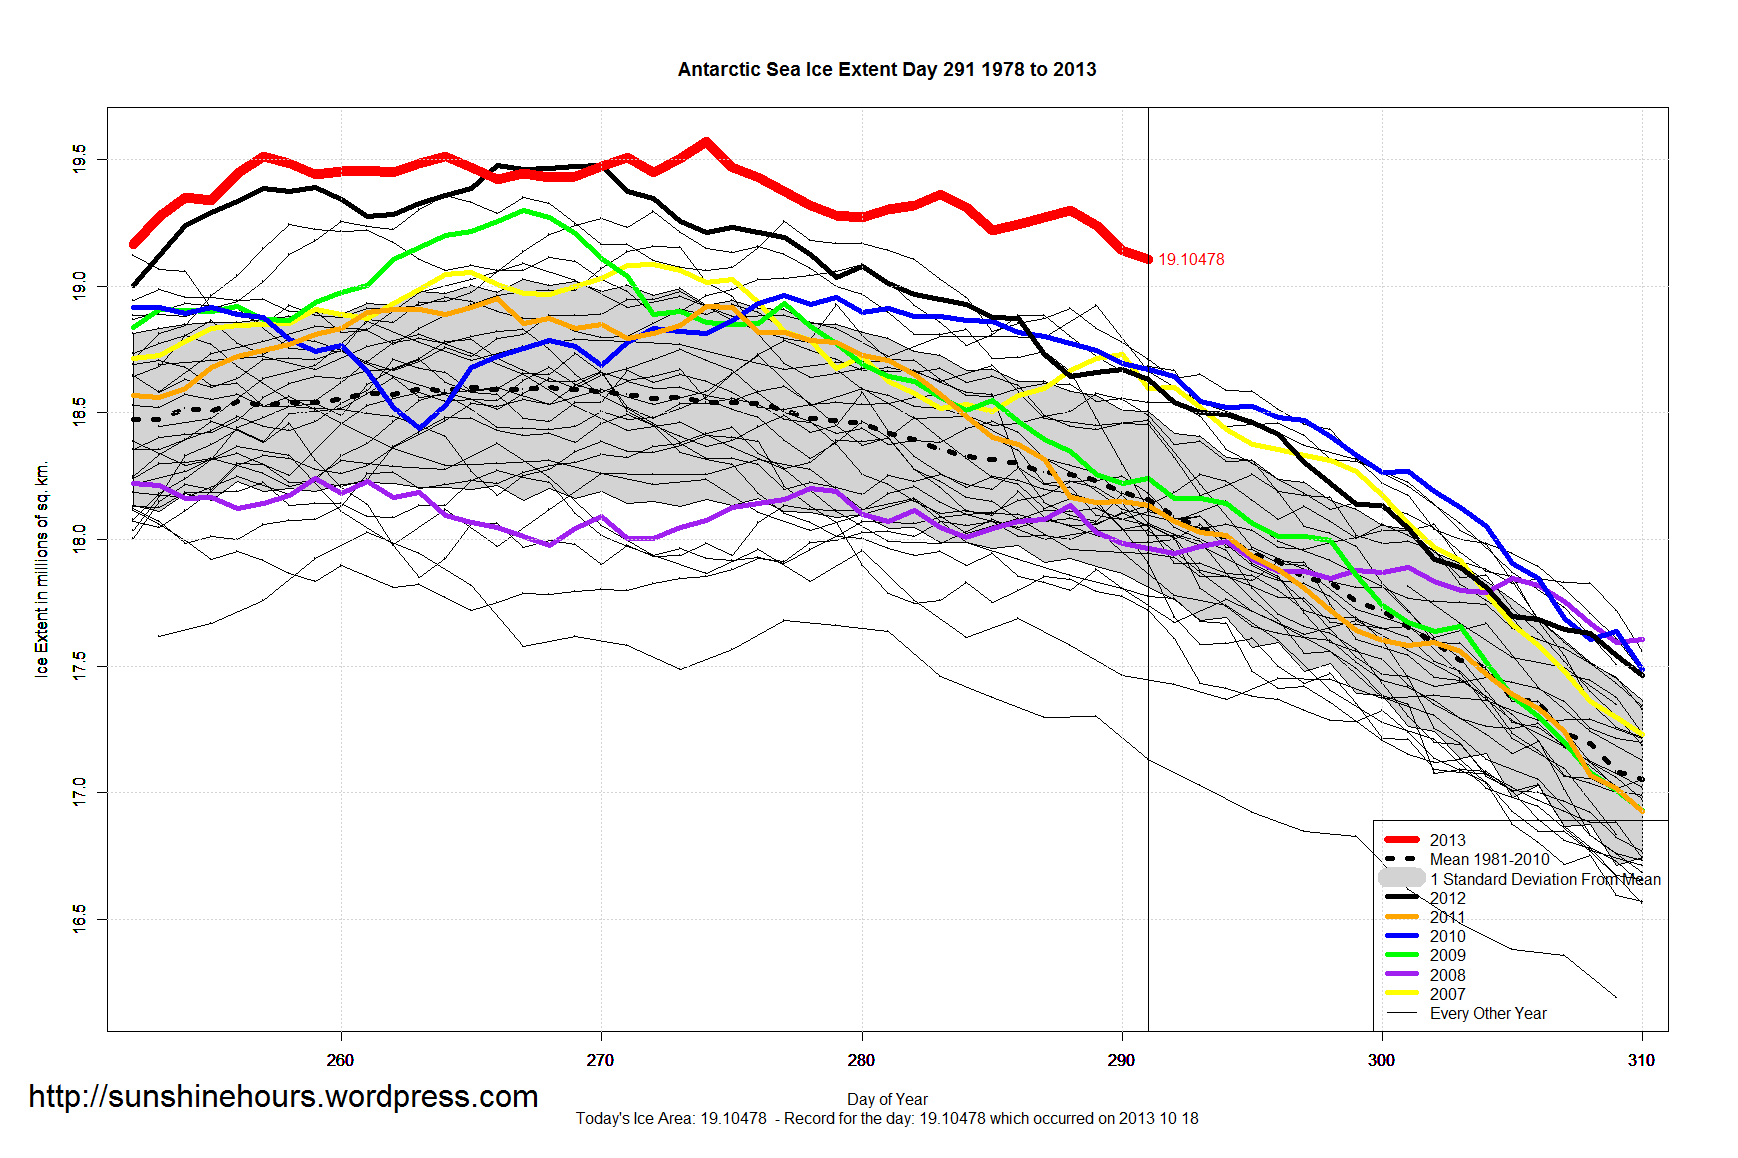
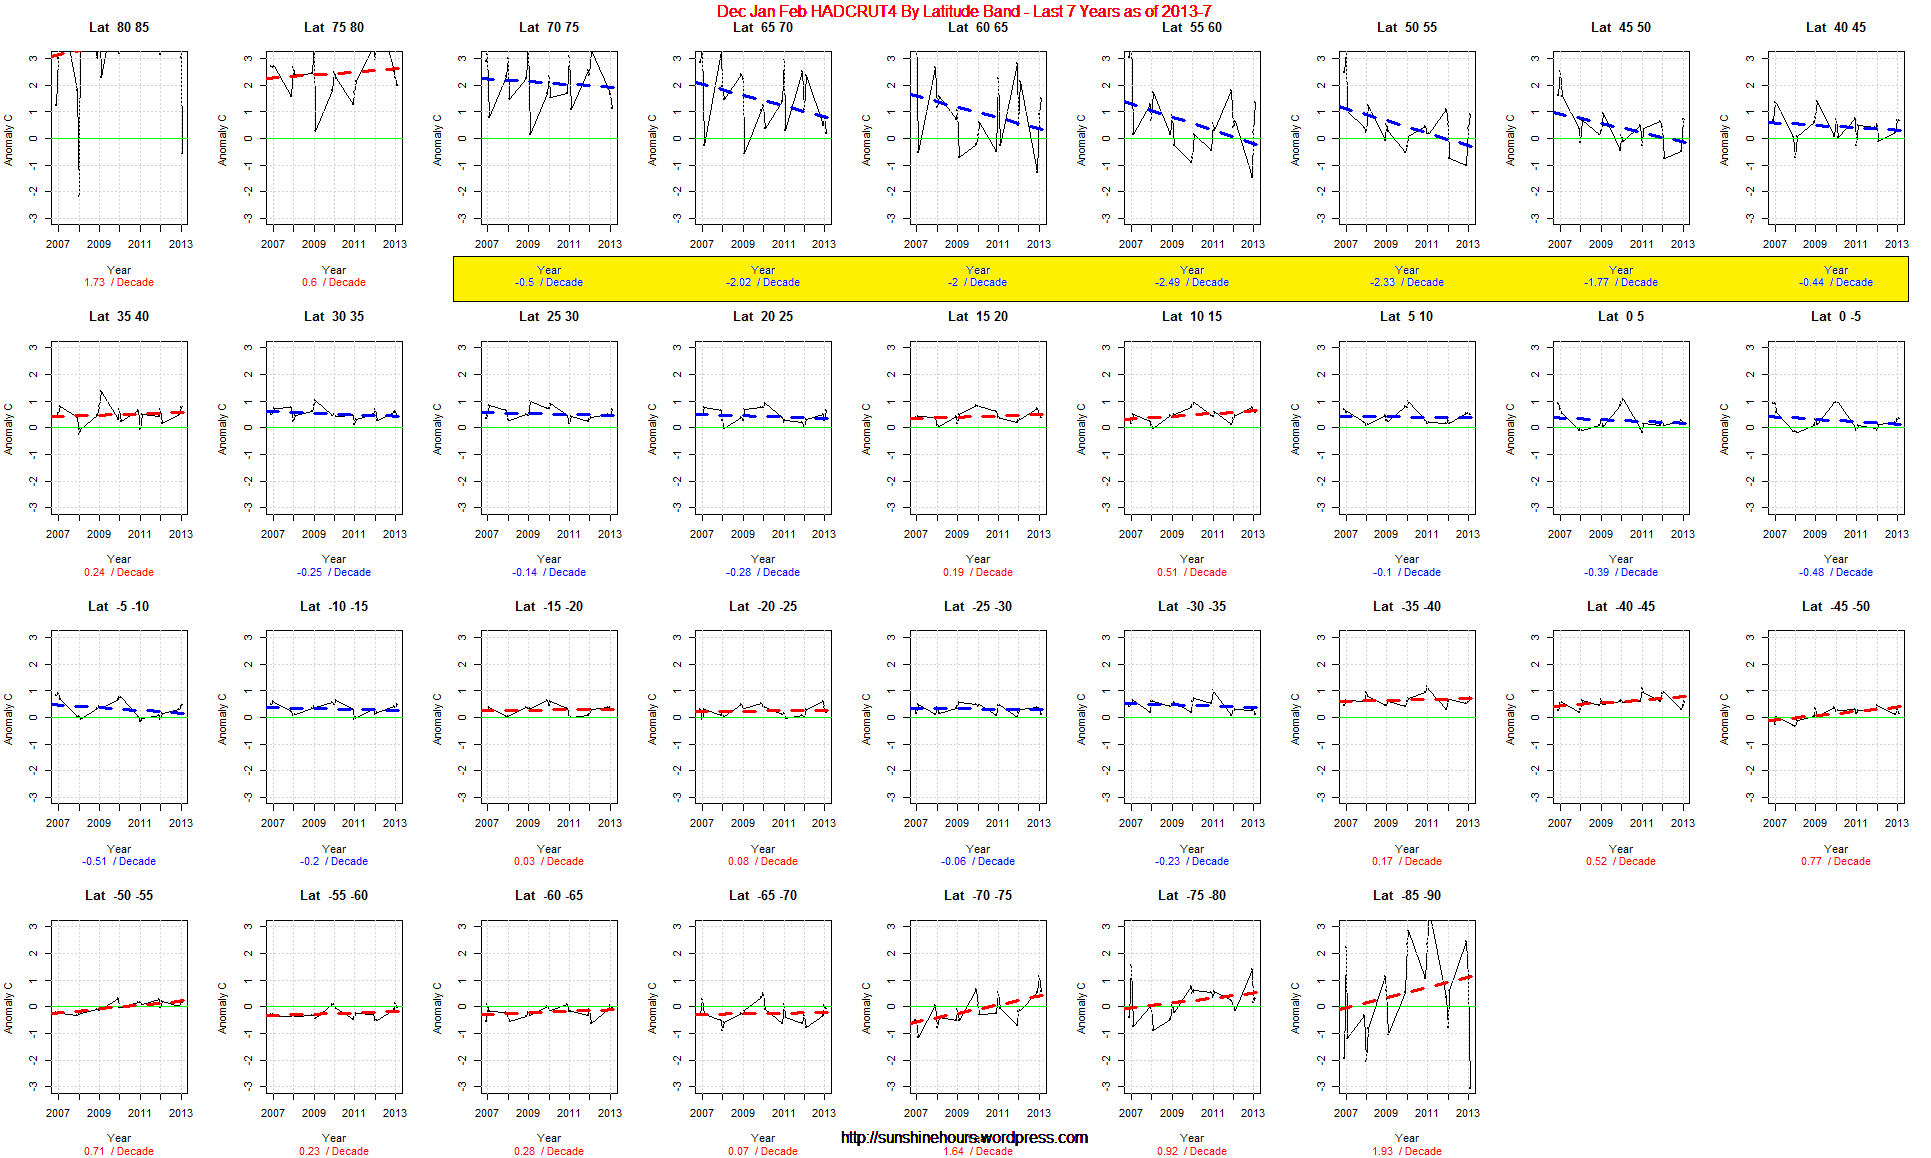
Since the last time I did the stats for Antarctic Sea Ice Extent  a few things of changed.

A new all time record was set at 19.57088 million sq km. The new maximum occurred on day 274, which is now makes 2013 the 2nd latest maximum.

Year Min Max Day Of Max Day Of Min
2013 3.6504 19.57088 274 50
2012 3.11109 19.47713 266 54
2011 2.31884 18.95328 266 53
2010 2.8422 18.9968 249 47
2009 2.67096 19.29864 267 53
2008 3.69176 18.29726 247 51
2007 2.7227 19.08545 272 50
2006 2.4866 19.35934 264 51
2005 2.80387 19.29451 272 49
2004 3.25927 19.12341 252 51
2003 3.6257 18.67907 268 48
2002 2.69691 18.11556 252 51
2001 3.44094 18.49324 271 50
2000 2.58248 19.15817 272 49
1999 2.70723 18.98068 273 51
1998 2.7715 19.2433 258 56
1997 2.26415 18.79094 265 58
1996 2.59733 18.83039 267 56
1995 3.32988 18.7353 269 55
1994 3.08286 18.8266 243 43
1993 2.28078 18.709 263 50
1992 2.49238 18.4663 255 54
1991 2.55355 18.66993 273 58
1990 2.78435 18.3788 273 53
1989 2.7229 18.27368 266 51
1988 2.63862 18.78456 277 55
1987 3.01642 18.52332 258 52
1986 2.95395 18.02672 261 65
1985 2.60211 18.93215 254 50
1984 2.38292 18.37747 266 58
1983 2.84656 18.81042 263 55
1982 2.8927 18.55004 246 52
1981 2.69524 18.85906 261 51
1980 2.52686 19.09137 267 57
1979 2.91521 18.36699 256 48

There have now been 78 Daily Records set in 2013. 1979 is down to 2 records. 1998 is down to 1 and that happened on day 300 which is only a few days away.  So 1998 could fall off the list of daily records.

Year No of Records
2008 125
2010 107
2013 78
2007 21
2009 8
2012 8
2006 6
2000 4
2004 3
2005 3
1979 2
1998 1

Antarctic Sea Ice Area 85,200 sq km short of an all time record

Antarctic Sea Ice Area came within 85,200 sq km short of an all time record.   Sea Ice Area reached 16.14718 million sq km on day 282. This was the 7th highest of all time.

I normally do Sea Ice Extent, but Cryosphere uses Sea Ice Area.

Sea Ice Area had lagged Extent for most of the peak, but suddenly advanced after the normal maximum was reached. The maximum for 2013 was reached on day 282 which is 19 days later than the 2007 record.

2007 holds the record for most Sea Ice Area at 16.23238 million sq km.

Antarctic_Sea_Ice_Day_288

21st Daily Record in a Row for Antarctic Sea Ice Extent (and 75th in total)

October 18th  (Day 291) saw the 21st Daily Record for Antarctic Sea Ice Extent in a row! It was also the 75th daily record for 2013.

Year No of Daily Records
2008 125
2010 107
2013 75
2007 21
2006 8
2009 8
2012 8
2000 4
2004 3
2005 3
1979 2
1998 2

There are only 73 days left in the year so I’m not sure if 2013 can set a record for most daily records. It has a chance at coming 2nd. And considering how far above the previous years records (400,000 sq km) anything could happen.

Click graph for bigger. Data is here.

Antarctic_Sea_Ice_Extent_Zoomed_2013_Day_291_1981-2010

Antarctica Set A Third All-Time Record While Government Was “Shutdown”

Antarctica set a third All-Time Record for sea ice extent while the US federal government was “shutdown”.  Data here.

The first All-Time Record was September 14th with 19.51234 million sq km. (I am using all the digits for a good reason)

The 2nd All-Time Record was September 21 with 19.51394  million sq km. – only 1600 sq km higher.

Then the shutdown happened and all the data I use was frozen at September 30th. Today the data was updated.

The 3rd All-Time Record was set on October 2nd with 19.57088 million sq km.

Here is a portion of the latest graph showing the 3rd record.

3rd Antarctic Sea Ice Extent Record


The graph below contains data up until October 18 – Day 291.  Click to make bigger.

Antarctic_Sea_Ice_Extent_Zoomed_2013_Day_291_1981-2010

NSIDC and Antarctica

Update: Below I noted that “there could have been one more record”. I was right. A 3rd All-time Record for Antarctic Sea Extent was set.

On October 3rd NSIDC put out a press release on the Arctic/Antarctic Sea Ice.

Let us take a look at the comments on Antarctic  Sea Ice.

As the Arctic was reaching its minimum extent for the year, Antarctic sea ice was reaching record high levels, culminating in a Southern Hemisphere winter maximum extent of 19.47 million square kilometers (7.52 million square miles) on September 22.

Wrong. The 2012 record was 19.47 million sq km on September 22, 2012.  The 2013 record was 19.51234 million and was set on September 14th. Then the record was broken again with 19.51394 million sq km on September 21, 2013.

And looking at the graph until October 1st (when the shutdown ended the data ) there could have been one more record.

The September 2013 monthly average was also a record high, at 19.77 million square kilometers (7.63 million square miles) slightly higher than the previous record in 2012.

Wrong. The September 2013 monthly average was 19.35 million sq km which was 100,000 sq km higher than the September 2012 average of 19.25 million sq km. ”

One or two scientists claim it is because of the wind. But it could be the AMO and/or ocean temperatures. I think the wind claim is just an excuse.

In contrast to the sharp downward trend in September Arctic sea ice, Antarctic September sea ice has been increasing at 1.1 percent per decade relative to the 1981 to 2010 average.

And the anomaly at maxium was 900,000 sq km above the 1981-2010 average.

The tiny gain in Antarctica’s ice is an interesting puzzle for scientists,” said NSIDC lead scientist Ted Scambos.

Tiny Gain? The September average in 1986 was 17.69 million sq km. In 2013 it was 19.35 million sq km. That is 1.6 million sq km higher!

The rapid loss of ice in the Arctic should be ringing alarm bells for everyone.

If it wasn’t for the August 2012 Cyclone. The trend would be up from 2007. 

MET Throws Hissy Fit Over Winter Temprature Predictions

“We saw similar headlines last year and instead winter 12/13 ended up being only the 43rd coldest on record with an average temperature of 3.3C and flooding until the turn of the year.”

Technically correct, but HADCET March 2013 was the 11th coldest March since 1659.

December 2013 was 3.3C colder than the warmest December.  January 2013 was 4C colder than the warmest January . And February 2013 was 4.7C colder than the warmest February.

No sign of global warming in HADCET for the winter months.

“While we have seen a return to more normal, cooler temperatures for this time of year, this is no indication of what we can expect over the next four months with regards to temperatures ”

http://metofficenews.wordpress.com/2013/10/12/winter-forecasting-responding-to-the-headlines/

Lets look at the last 15 years of HADCET for each month. What would you predict? 

HADCET  Last 15 Years

Northern Hemisphere Winter Doom By Latitude Band

Winter temperatures in the Northern Hemisphere are dropping as much as 2.5C / decade over the last 7 years.

Yesterday my post was a look at the northern hemisphere by month over the last 7 years.

Today I am looking at the same time frame, but I am using the gridded HADCRUT4 data for Dec/Jan/Feb only. You will have to click on the image to get the full effect.

There are 7 latitude bands with yellow highlighting. The trend in those is from -.44C/decade to -2.49C/decade. And note the green 0 line. 0 is the 1961-1990 average, Anywhere the graph or trend crosses the green line it is colder than the 1961-1990 average. It was pretty cold in the 60s and 70s.

I wish I didn’t live in the 50th parallel.

Highlighted Dec Jan Feb HADCRUT4 By Latitude Band - Last 7 Years as of 2013-7


HADCRUT4 Northern Hemisphere Winter Doom

Do you live in the Northern Hemisphere.? Did anyone tell you that in the midst of record CO2 levels HADCRUT4 shows massively dropping winter temperatures?

At the bottom of this post is a graph of HADCRUT4 Northern Hemisphere only temperatures for each month for the last 7 years.

Did you know December was cooling at -.9C per decade? By 2100 December could be 8C colder?

Did you know January was cooling at -.73C per decade?

Did you know March was cooling at -.56C per decade?

Did you know February was cooling at -.19C per decade?

Did you know November was cooling at -.2C per decade?

Did you know October was cooling at -.17C per decade?

Did you know April was cooling at -.17C per decade?

I’m glad I have a wood stove.

Average HADCRUT4 Northern  Last 7 Years