USA NOAA April 2014 – 3.01F Colder Than April 1925

According to the NOAA April 2014 was ranked 75th out of 120 April’s (120 = warmest) . It was only .66F above the 1901-2000 average.

The 3rd warmest April in US history was in 1925 when it was 3.67F above the 1901-2000 average.

Other April’s warmer than 2014:  1895,1896,1906,1908,1910,1915,1925,1930,1934,1938,1941,1942,1943,1946,1948,1949 ….

NOAA_Apr_2014_Lower_48


Could CO2 have lowered the rate of natural warming in the oceans?

As a minor followup to my post “Could CO2 have lowered the rate of natural warming?” lets consider ocean warming.

From 1900 to 1945 oceans were warming at a rate of  0.0116188C per year.

After 1945 oceans were warming at a rate of 0.00654978C per year.

Which means the massive 1945 increase in CO2 after 1945 slowed the  rate of ocean warming by 0.00506902C per year. Which is a drop off 44%.

Could_CO2_SST

Woodfortrees Url is here.


Climate Change Is Damaging Brains (of the Researchers Probably)

Every once in a while I read the Daily Mail website Today I came across:

Climate change is damaging fish brains and causing them to lose their survival instinct, researchers warn

Immediately all I could think of was:

Climate change is damaging fish brains researchers brains and causing them to lose their minds

So lets get to the key point. They claim fish act bolder when exposed to water with a lower pH level:

There’s no difference between the fish treated with CO2 in the lab in tests for chemical senses versus the fish we caught and tested from the CO2 reef”

Could it be that catching the fish and not killing them causes the fish to act differently?


Read more: http://www.dailymail.co.uk/sciencetech/article-2605560/Fish-losing-survival-instinct-climate-change-claim-researchers.html

Could CO2 have lowered the rate of natural warming?

Lets say you have a pot of water that is warming, but you can’t see underneath it. There is a thermometer in the pot, and intermittently you write down the temperature.

And at some point some people come up with a theory that suggests a 2nd candle is now adding its energy to the pot of water. So what are you going to do?

Well, one way is to take the temperature data and graph it and calculate the trend before and after the supposed appearance of the 2nd candle. The change in trend is possibly the extra energy added by the 2nd candle.

Of course the analogy is really about CO2. So lets pick say … 1945 as the supposed appearance of the 2nd candle (CO2).

Why 1945? That is when CO2 really took off. Here is the CDIAC data in million metric tons of CO2.

CDIAC-co2


And here is the data graphed. 1900 to 1945 in red. And 1945 to 2014 in blue. With trends.  I used Woodfortrees for the graph and here is the url.

Candle_1945_2014


So … what are the trends.

1900 to 1945 = 0.0110866C / Year

1945 to 2014 = 0.00954579 / Year


I conclude the 2nd candle actually changed the trend downward by 0.00154081C / Year.

Maybe it wasn’t a candle? Maybe it was an ice cube.

I think only conspiracy theorists could come up with a 2nd candle theory when the trend actually went down.


USA NOAA March 2014 – 43rd Coldest – Colder Than 1898,1900,1901,1902,1903,1904,1905,1907 …

According to the NOAA March 2014 was 43rd coldest out of 120 March’s.

That is the 2nd March in a row colder than the 1901-2000 average.

This is a partial list of the March’s warmer than 2014: 1898,1900,1901,1902,1903,1904,1905,1907,1908,1910,1911,1914,1916,1918,1919,1921,1925,1927,1928,1929,1933,1934,1935,1936,1938,1939 … 

NOAA_Mar_2014


The Denier Credo

The Denier Credo


1) The Earth HAD been warming. And it stopped. And it also warmed from 1909 to 1945 and stopped for almost 35 years and cooled some. And it also warmed to about 1878 and also stopped and then cooled.
2) CO2 acts as a green house gas, and the amount of CO2 is increasing, and has increased a lot since 1998 with no effect on temperature

3) If Humans are causing climate change, it is very selective and tends to coincide with the AMO cycle.

4) This small amount of warming will cause fanatical people to squander trillions of dollars trying to prevent the same warming/cooling that has occurred in the past in a similar form to the AMO. This insane response to natural fluctuation is causing net economic harm and increase human suffering by replacing nuclear and coal power with tree burning power plants (which produce way more CO2) and bird chopping wind turbines and filthy rare earth contaminated solar panels.

5) The natural warming after the Little Ice Age is a good thing.


AGW Cult: “We Messed Up the Currents” So No One Can Find MH370

I think Mother Jones is trying for the top of the list for stupid claims about “Global Warming”.

“Scientists say man-made climate change has fundamentally altered the currents of the vast, deep oceans where investigators are currently scouring for the missing Malaysian Airlines flight, setting a complex stage for the ongoing search for MH370. If the Boeing 777 did plunge into the ocean somewhere in the vicinity of where the Indian Ocean meets the Southern Ocean, the location where its debris finally ends up, if found at all, may be vastly different from where investigators could have anticipated 30 years ago. “

I’m laughing too hard to write any more.


Dr Mark Howden, of the CSIRO thinks farmers are idiots

There is a new scare story in the Guardian claiming “climate change” will cut crops harvests by 2% per decade due to global warming. The chief clown seems to be Dr Mark Howden of the CSIRO. CSIRO are a group of idiots in Australia pretending to be climate scientists.

“An analysis of more than 1,700 simulations found that across all regions and all crops, including wheat, maize and rice, yields will drop by 2% each decade, based on a 2C rise by 2050.”

Lets look at this irrational story with rational eyes.

A 2C rise by 2050 is extremely unlikely considering that temperatures have been flat since 1998 and have declined since 2002.

But lets humor the idiots and assume temperatures will rise by 2C by 2050.  Lets assume farmer Bob with 160 acres of land or Agribusiness XYZ Corporation with 10 square miles of land is currently growing wheat that has been chosen by the collective brainpower of Bob or XYZ to produce the best yield possible at current temperatures and rainfall. And lets say  over the next 9 years temperature rises by (correction – I had .25C) .5C (it is 36 years to 2050 so lets use 9 years).

Now because CIRO and Mark Howden are idiots, they assume farmer Bob and all the top scientists at XYZ Corporation are going to keep growing the exact same strain of wheat and they will irrigate (if they irrigate) using the same amount of water and they will use the same fertilizer and they will plant the crop at the exact same time as they always have.

Bullsh*t. They won’t do that. Farmer Bob might be an idiot, but I doubt it. XYZ might be staffed by morons. But I doubt it. If farmer Bob and XYZ are still in business, I assume they are smart enough to do something different. They might plant a little earlier and harvest a little earlier since winters will be warmer. They might use a different strain of wheat or plant a different crop like canola or soybeans or whatever responds to a small rise in temepratures. They might use a different fertilizer. They will adapt. And if the temperature kept rising they will adapt again.

On top of that, along the cold edge of the growing region in North America, new land will become productive if it is warmer, leading to even more crops being grown. And in the southern (warm) edge of the growing region, they will adapt too by growing crops better suited to the newer climate.

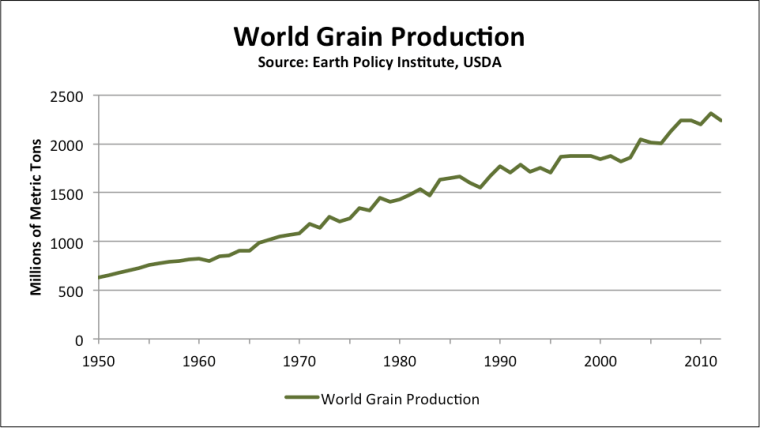
World grain production has been rising for decades. It will keep rising. And idiots pretending to be scientists will keep squandering money on stupidity.

grain-production2

Does “Climate Change” Bring More Crime?

Marc Morano posted a link to this LA Times Story.

“Between 2010 and 2099, climate change can be expected to cause an additional 22,000 murders” …. blah blah blah.

So I grabbed California’s murder rate from 1960-2012 and grabbed California’s annual temperature from the NOAA.

Once upon a time you could maybe argue there was a correlation.  But not anymore.

California Murder Rate vs Annual Temperature 1960-2012