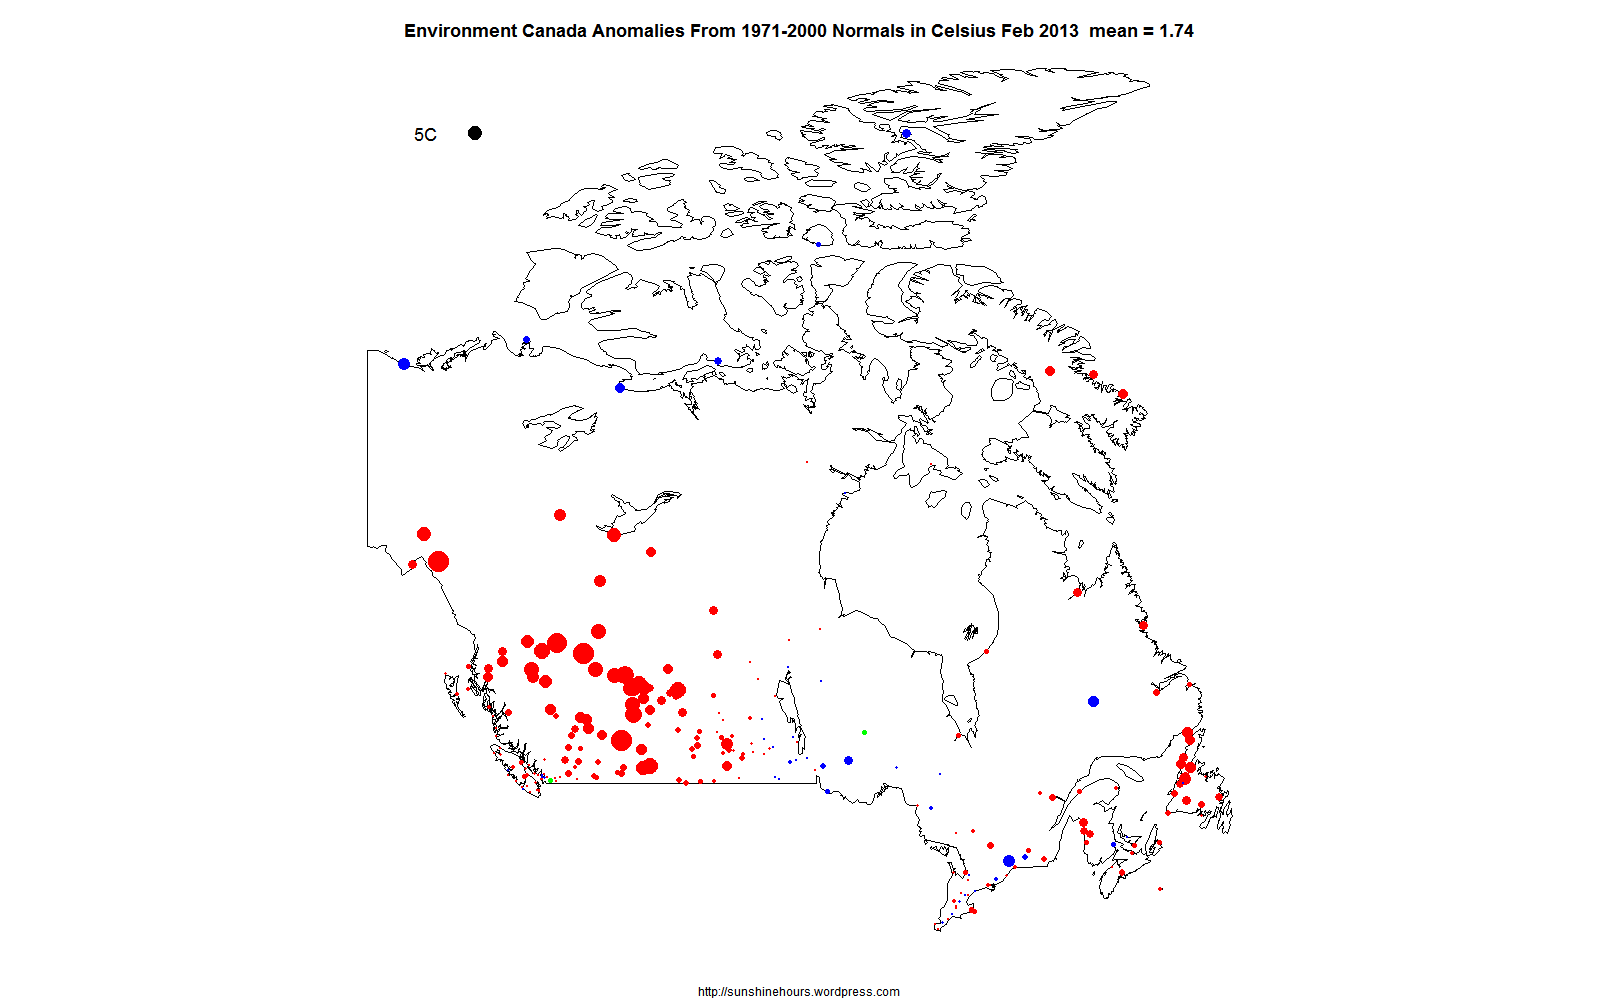
The data is from the monthly summaries put out by Environment Canada. The Normals are the station where the anomaly from the 1971-2000 average is calculated by EC.
Precipitation is in mm of rain equivalent. Some of it would be snow. About 25mm to the inch for the non-metric.
Boat Bluff’s 677mm is about 27 inches. In one month. Toronto had 328% of normal. Triple.
Top 10 Wettest Stations in Canada by % of Normal. (Only stations with EC Normals)
| Province | Station | Year | Month | Precipitation (mm) | Precipitation % of Normal |
| ONT | TORONTO | 2013 | 2 | 165.4 | 328 |
| SASK | LEROY | 2013 | 2 | 27 | 244 |
| ONT | TORONTO LESTER B. PEARSO | 2013 | 2 | 92 | 216 |
| SASK | QUAPPELLE 1 | 2013 | 2 | 25.1 | 212 |
| ONT | WROXETER | 2013 | 2 | 117.9 | 211 |
| QUE | GASPE A | 2013 | 2 | 121.8 | 206 |
| ONT | FOLDENS | 2013 | 2 | 98.4 | 192 |
| SASK | DUVAL | 2013 | 2 | 20.6 | 186 |
| NU | RANKIN INLET A | 2013 | 2 | 16.2 | 183 |
| NWT | FORT SIMPSON A | 2013 | 2 | 31.6 | 181 |
Top 10 Wettest Stations by amount of precipitation. Any station is eligible. NA means EC does not calculate normals.
| Province | Station | Year | Month | Precipitation (mm) | Precipitation % of Normal |
| BC | BOAT BLUFF | 2013 | 2 | 677.2 | 147 |
| BC | ZEBALLOS MURAUDE CREEK | 2013 | 2 | 473.9 | NA |
| BC | TOFINO A | 2013 | 2 | 469.6 | NA |
| BC | ESTEVAN POINT | 2013 | 2 | 430.8 | 125 |
| BC | PRINCE RUPERT MONT CIRC | 2013 | 2 | 430.7 | NA |
| BC | ADDENBROKE ISLAND | 2013 | 2 | 425.4 | NA |
| BC | LENNARD ISLAND | 2013 | 2 | 419.5 | 120 |
| BC | BELLA BELLA | 2013 | 2 | 396 | NA |
| BC | PORT ALICE | 2013 | 2 | 387.2 | 101 |
| BC | TAHSIS VILLAGE NORTH | 2013 | 2 | 370.5 | NA |