Nanaimo Hot and Cold Day Histograms – So Much For Extreme Weather

You all know that the AGW cult likes to go on and on about “Extreme Weather” because the warming stopped in 1998 and they like to think the world is coming to an end and only they can save us. Just another end of the world cult.

So I thought I would look at the same data for the weather station closest to my hometown on the west coast of Canada. The data only starts in the late 1940s so there is no extreme’s from the 1930s and 1940s.

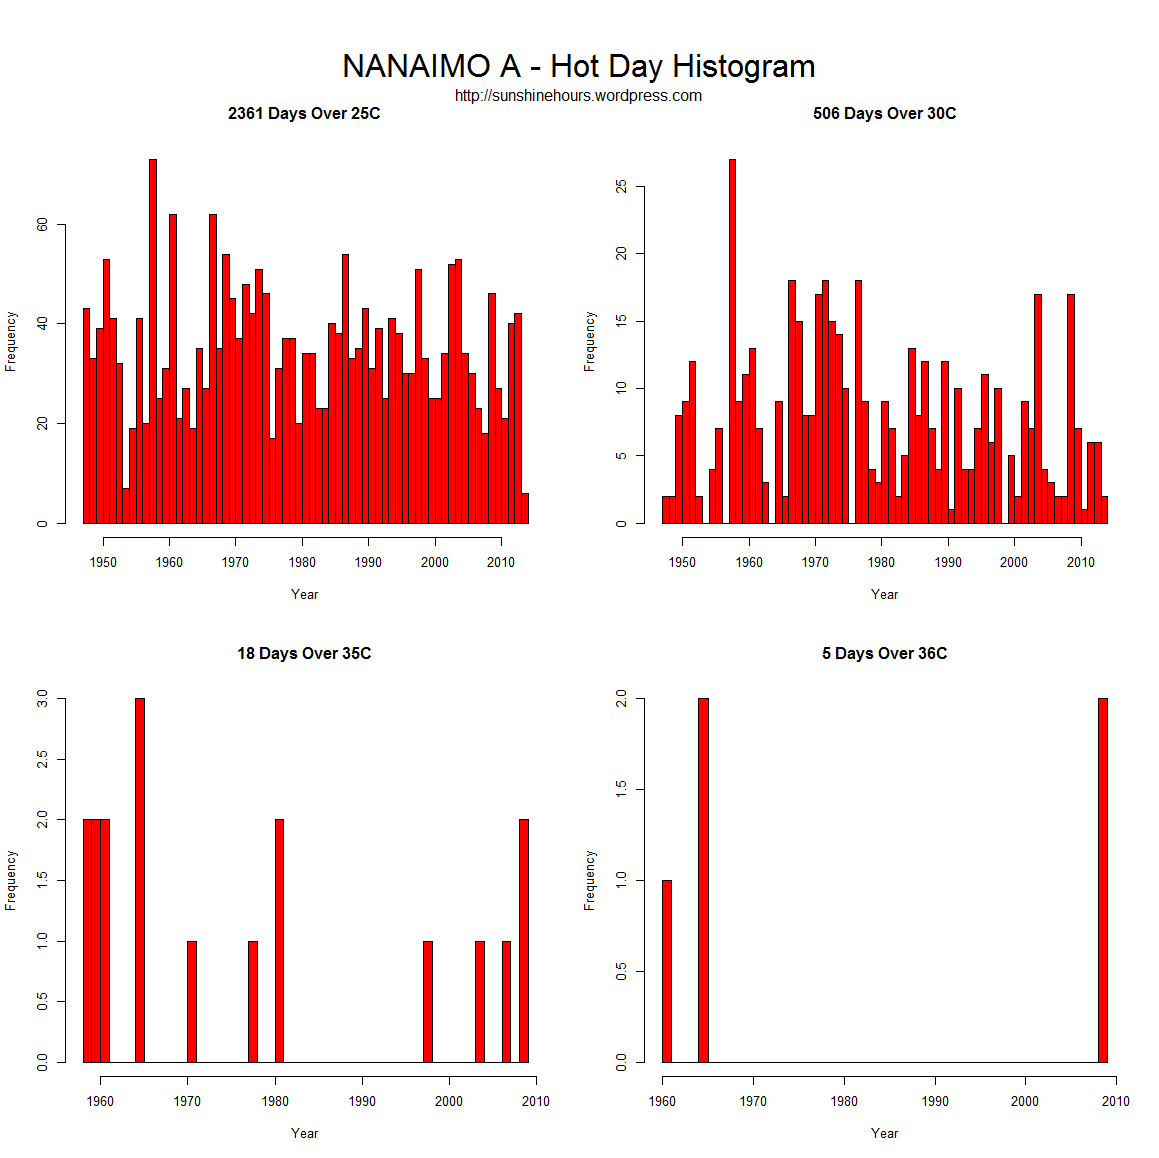
One thing to remember. The 2361 Days Over 25C number (for example) includes the 506 Days Over 30C etc.

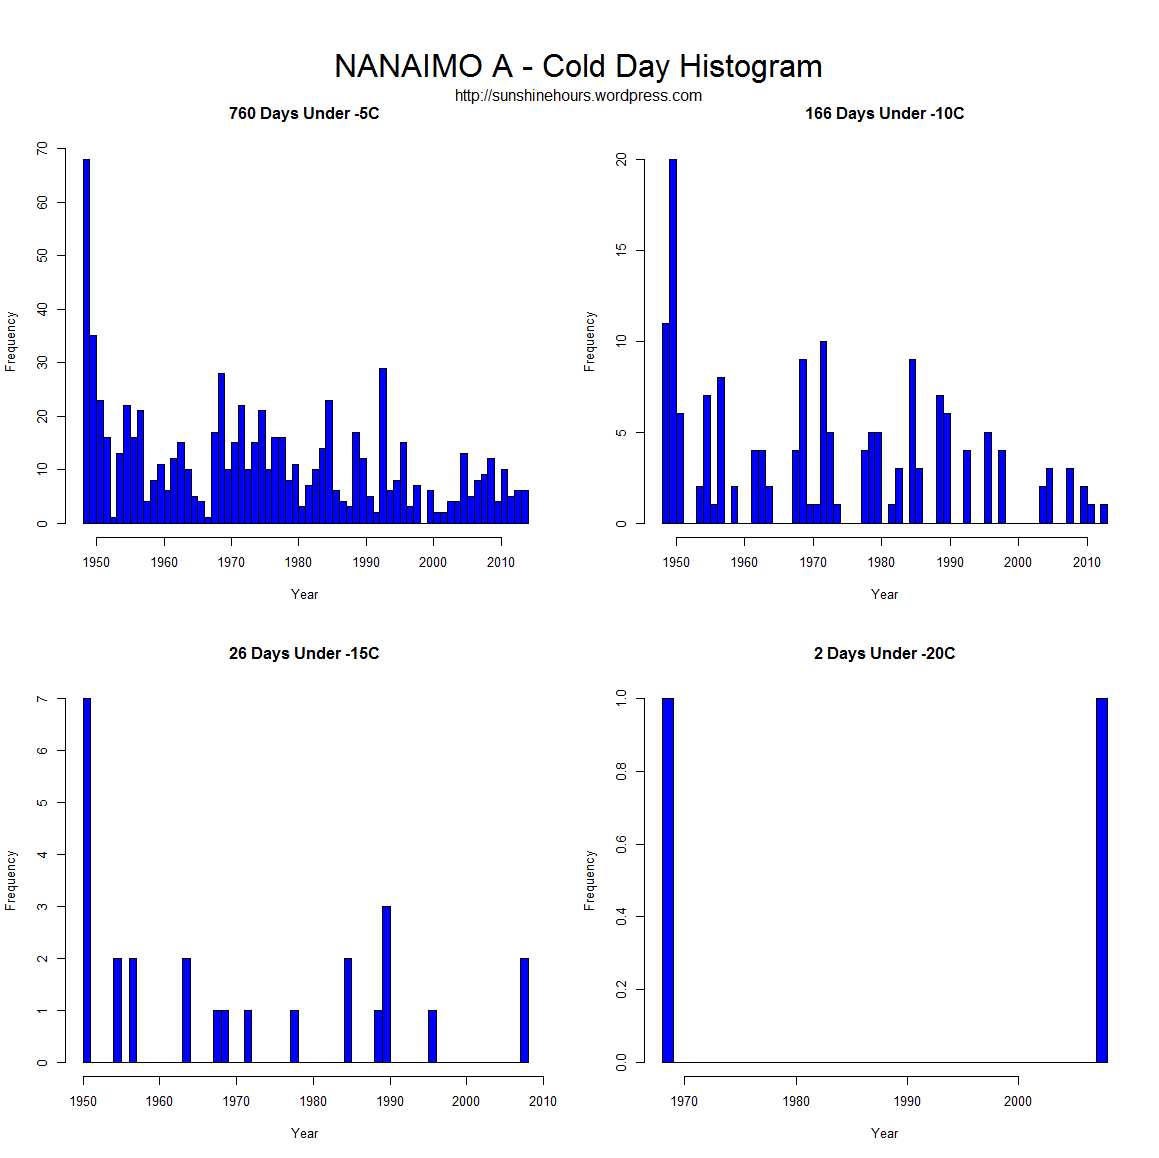
I don’t see any increase in extreme hot days. I don’t see any increase in extreme cold days.

Aside from 2 hot days in July 2009 (matched by the 3 days in the 1960s) and 1 cold day in 2008 matched by a day in 1968 it seems to have been getting less extreme.

HotDay_Histogram_NANAIMO A - Hot Day Histogram

ColdDay_Histogram_NANAIMO A - Cold Day Histogram


Sea Ice Update July 5 2014 – Antarctica Smashes Old Record By 400,000 sq km

A quick update for sea ice extent for day 185 of 2014

  • Global Sea Ice Extent is 187,000 sq km above the 1981-2010 mean. That is ranked 15 for the day. Still above normal!
  • Antarctic Sea Ice Extent is 1,521,000 sq km above the 1981-2010 mean. That is ranked 1 for the day. That smashes the old daily record by 400,000 sq km
  • Arctic Sea Ice Extent is -1,335,000 sq km below the 1981-2010 mean. That is ranked 32 for the day.

NOAA Data here and here here. Graphs below. Click for bigger.

Global_Sea_Ice_Extent_Zoomed_2014_Day_185_1981-2010

Antarctic_Sea_Ice_Extent_Zoomed_2014_Day_185_1981-2010

Arctic_Sea_Ice_Extent_Zoomed_2014_Day_185_1981-2010

MASIE July 4 2014 – Minor Slowdown in Melting

July 4 2014  MASIE Update – A slight slowdown in melting. Melting has averaged 140,000 per day until the last one day where it dropped only -44,567.

Data here.

Region Start End Last96 Last28 Last14 Last7 Last3 Last1
Baffin Bay Gulf of St. Lawrence 1,688,530 374,110 -1,314,421 -649,876 -504,975 -347,918 -150,230 -19,307
Hudson Bay 1,260,903 725,620 -535,283 -443,786 -393,638 -174,184 -73,497 -22,981
Laptev Sea 897,845 525,551 -372,293 -202,061 -188,021 -114,167 -72,377 -13,401
Kara Sea 933,859 751,891 -181,968 -113,769 -110,484 -108,443 -26,822 -4,753
Greenland Sea 603,416 507,144 -96,272 -121,684 -183,385 -61,245 -15,066 20,783
Beaufort Sea 1,070,445 889,555 -180,890 -154,307 -125,584 -58,099 -22,466 -5,290
Barents Sea 645,917 140,479 -505,438 -198,142 -125,487 -53,352 -38,823 1,232
Chukchi Sea 966,006 735,456 -230,550 -134,015 -82,018 -25,598 -14,681 -5,727
East Siberian Sea 1,087,137 1,013,997 -73,140 -17,038 -28,711 -17,692 -5,760 5,068
Bering Sea 697,324 12,503 -684,821 -93,898 -33,054 -11,484 -4,953 1,189
Canadian Archipelago 853,214 746,562 -106,652 -54,838 -35,636 -9,920 -1,627 -704
Central Arctic 3,221,921 3,229,505 7,583 -11,097 -12,790 -8,865 -3,150 -819
Baltic Sea 15,337 0 -15,337 0 0 0 0 0
Sea of Okhotsk 853,240 0 -853,240 -65,364 -14,729 0 0 0
Yellow Sea 0 0 0 0 0 0 0 0
Northern Hemisphere (Total) 14,805,115 9,653,885 -5,151,230 -2,259,503 -1,838,530 -990,983 -429,468 -44,567
NH (Average Loss per Day) -53,105 -80,697 -131,324 -141,569 -143,156 -44,567

MASIE Arctic Ice Extent as of 2014-184

Sea Ice Update July 4 2014 – Antarctica Still Amazes – 2.3 million sq km Higher Than 2002

A quick update for sea ice extent for day 184 of 2014

  • Global Sea Ice Extent is 176,000 sq km above the 1981-2010 mean. That is ranked 15 for the day. And still higher than the 1981-201 mean.
  • Antarctic Sea Ice Extent is 1,530,000 sq km above the 1981-2010 mean. That is ranked 1 for the day. This is 2.3 million sq km higher than the 2002 extent for the same day.
  • Arctic Sea Ice Extent is -1,355,000 sq km below the 1981-2010 mean. That is ranked 32 for the day.

NOAA Data here and here here. Graphs below. Click for bigger.

Global_Sea_Ice_Extent_Zoomed_2014_Day_184_1981-2010

Antarctic_Sea_Ice_Extent_Zoomed_2014_Day_184_1981-2010

Arctic_Sea_Ice_Extent_Zoomed_2014_Day_184_1981-2010

USHCN Tmax – Hottest July Histogram – Raw vs Adjusted

Yesterday I did a post looking at every station and finding out which year had the hottest July. Today I am showing you what effect the adjustments have.

I am using USHCN Final Tmax monthly data and comparing it to the raw data . From the file v2.5.0.20140627. (This is not necessarily all the data NOAA uses)

The format is a little different, but it is designed to allow easy comparison. Red is the raw data. Green is Final and muddy green is where raw and final overlap.

As you can see, the number of years near the present have a lot green. Which means the adjustments created more record hot years.

The 1910s to 1980s have red at the top which indicates raw data. Translation: More record July’s occurred in the past using raw data.

For the Coldest July data, the results are the opposite. Adjusting creates more colder July’s in the past and takes away cold July’s from the present.


USHCN Tmax - raw and Final - Hottest July

USHCN Tmax - raw and Final - Coldest July

Sea Ice Update July 3 2014 – The Big View

A quick update for sea ice extent for day 183 of 2014

  • Global Sea Ice Extent is 174,000 sq km above the 1981-2010 mean. That is ranked 15 for the day.
  • Antarctic Sea Ice Extent is 1,527,000 sq km above the 1981-2010 mean. That is ranked 1 for the day. There have been 116 daily records set in 2014.
  • Arctic Sea Ice Extent is -1,354,000 sq km below the 1981-2010 mean. That is ranked 33 for the day.

NOAA Data here and here here. Graphs below. Click for bigger.

Global_Sea_Ice_Extent_2014_Day_183_1981-2010

Antarctic_Sea_Ice_Extent_2014_Day_183_1981-2010

Arctic_Sea_Ice_Extent_2014_Day_183_1981-2010

Ocean Garbage is Missing! Only 0.7% Remains.

This is hilarious. All the greenie talking points are imploding.

“Plastic junk is floating widely on the world’s oceans, but there is significantly less of it than expected, researchers have warned.

Researchers towed a mesh net at 141 sites to monitor floating debris.

They estimate the  the total amount of floating plastic debris in open ocean at 7,000 to 35,000 tons – far less than the 1 million tonnes previously estimated.

http://www.dailymail.co.uk/sciencetech/article-2678406/Where-plastic-trash-ocean-gone-Researchers-fear-fish-eating-floating-garbage-islands.html
 
Embed from Getty Images

USHCN Tmax – Coldest and Hottest July Histogram Will Surprise You!

The other day I noted that NOAA had July 1936 back on top. Now don’t take this post as an endorsement of the adjustments and infilling, but I thought I would check which years did stations set their hottest July and coldest July.

I am using USHCN Final Tmax monhtly data . From the file v2.5.0.20140627. (This is not necessarily all the data NOAA uses)

I don’t think the histogram of the hottest July will actually be a surprise. 216 stations had their hottest July in 1936.

But the coldest July histogram will surprise you. 1992 and 1993 tied with 148 stations each having the coldest July. A small subset of the stations at bottom.

USHCN Tmax Final Hottest July

USHCN Tmax Final Coldest July

I just picked the top 15 stations with the coldest July in 1992 and the hottest July in 1936. There are 92. The temperatures are in Celsius.

STATE Station NAME Coldest_Year Coldest_July Hottest_Year Hottest_July
IA USH00130133 ALGONA 3 W 1992 23.22 1936 35.98
IA USH00131402 CHARLES CITY 1992 24.18 1936 34.5
IA USH00132724 ESTHERVILLE 2 N 1992 23.06 1936 35.82
IA USH00132977 FOREST CITY 2 NNE 1992 23.69 1936 35.72
IA USH00132999 FORT DODGE 5NNW 1992 24.73 1936 36.1
IA USH00134063 INDIANOLA 2W 1992 26.57 1936 37.13
IA USH00134894 LOGAN 1992 26.56 1936 39.88
IA USH00135952 NEW HAMPTON 1992 23.38 1936 35.31
IA USH00137147 ROCK RAPIDS 1992 23.96 1936 37.48
IA USH00137161 ROCKWELL CITY 1992 24.81 1936 36.69
IA USH00137979 STORM LAKE 2 E 1992 23.85 1936 36.54
IA USH00138296 TOLEDO 3N 1992 24.82 1936 35.34
IL USH00115326 MARENGO 1992 24.66 1936 33.89
IL USH00118916 WALNUT 1992 24.94 1936 36.2
IN USH00122149 DELPHI 2 N 1992 26.5 1936 36.38

Here are a sample of 15 that have neither.

STATE Station NAME Coldest_Year Coldest_July Hottest_Year Hottest_July
AL USH00011084 BREWTON 3 SSE 1989 30.77 1902 36.71
AL USH00012813 FAIRHOPE 2 NE 1928 30.05 2000 34.93
AL USH00013160 GAINESVILLE LOCK 1916 30.25 1952 37.26
AL USH00013511 GREENSBORO 1967 28.49 1901 35.09
AL USH00015749 MUSCLE SHOALS AP 1967 29.59 1930 36.57
AL USH00017157 SAINT BERNARD 1967 27.33 1952 35.2
AL USH00017304 SCOTTSBORO 1906 29.21 1980 35.86
AL USH00017366 SELMA 1916 28.1 2000 36.65
AL USH00018178 THOMASVILLE 1916 29.87 1930 36.35
AL USH00018380 TUSCALOOSA ACFD 1889 29.5 1930 37.77
AL USH00018469 VALLEY HEAD 1967 28.31 1930 36.48
AR USH00031596 CONWAY 1989 27.83 1954 38.96
AR USH00031632 CORNING 1905 29.14 1930 38.45
AR USH00032356 EUREKA SPRINGS 3 WNW 1950 27.51 1980 38.65
AR USH00032444 FAYETTEVILLE EXP STN 1950 27.86 1954 38.03

Sea Ice Update July 2 2014 – Antarctic Still Flying High

Many AGW true believers dismiss “Global Sea Ice” as an unimportant metric. I’m guessing that in a couple of days it will become important to them.

  • Global Sea Ice Extent is 164,000 sq km above the 1981-2010 mean. That is ranked 15 for the day.
  • Antarctic Sea Ice Extent is 1,550,000 sq km above the 1981-2010 mean. That is ranked 1 for the day.
  • Arctic Sea Ice Extent is -1,386,000 sq km below the 1981-2010 mean. That is ranked 33 for the day.

NOAA Data here and here here. Graphs below. Click for bigger.

Global_Sea_Ice_Extent_Zoomed_2014_Day_182_1981-2010

Antarctic_Sea_Ice_Extent_Zoomed_2014_Day_182_1981-2010

Arctic_Sea_Ice_Extent_Zoomed_2014_Day_182_1981-2010

Sea Ice Update July 1 2014 – Arctic Mini-Bounce And Antarctic Still Flying High

Happy Canada Day

A quick update for sea ice extent for day 181 of 2014

  • Global Sea Ice Extent is 279,000 sq km above the 1981-2010 mean. That is ranked 11 for the day.
  • Antarctic Sea Ice Extent is 1,575,000 sq km above the 1981-2010 mean. That is ranked 1 for the day.
  • Arctic Sea Ice Extent is -1,296,000 sq km below the 1981-2010 mean. That is ranked 33 for the day.

NOAA Data here and here here. Graphs below. Click for bigger.

Arctic_Sea_Ice_Extent_Zoomed_2014_Day_181_1981-2010

Global_Sea_Ice_Extent_Zoomed_2014_Day_181_1981-2010

Antarctic_Sea_Ice_Extent_Zoomed_2014_Day_181_1981-2010