As a follow up to yesterdays post about monthly anomalies in Canada of +15C or higher and -15C and colder, I thought I would take a look what happens if I set the bar at +10C or -10C.
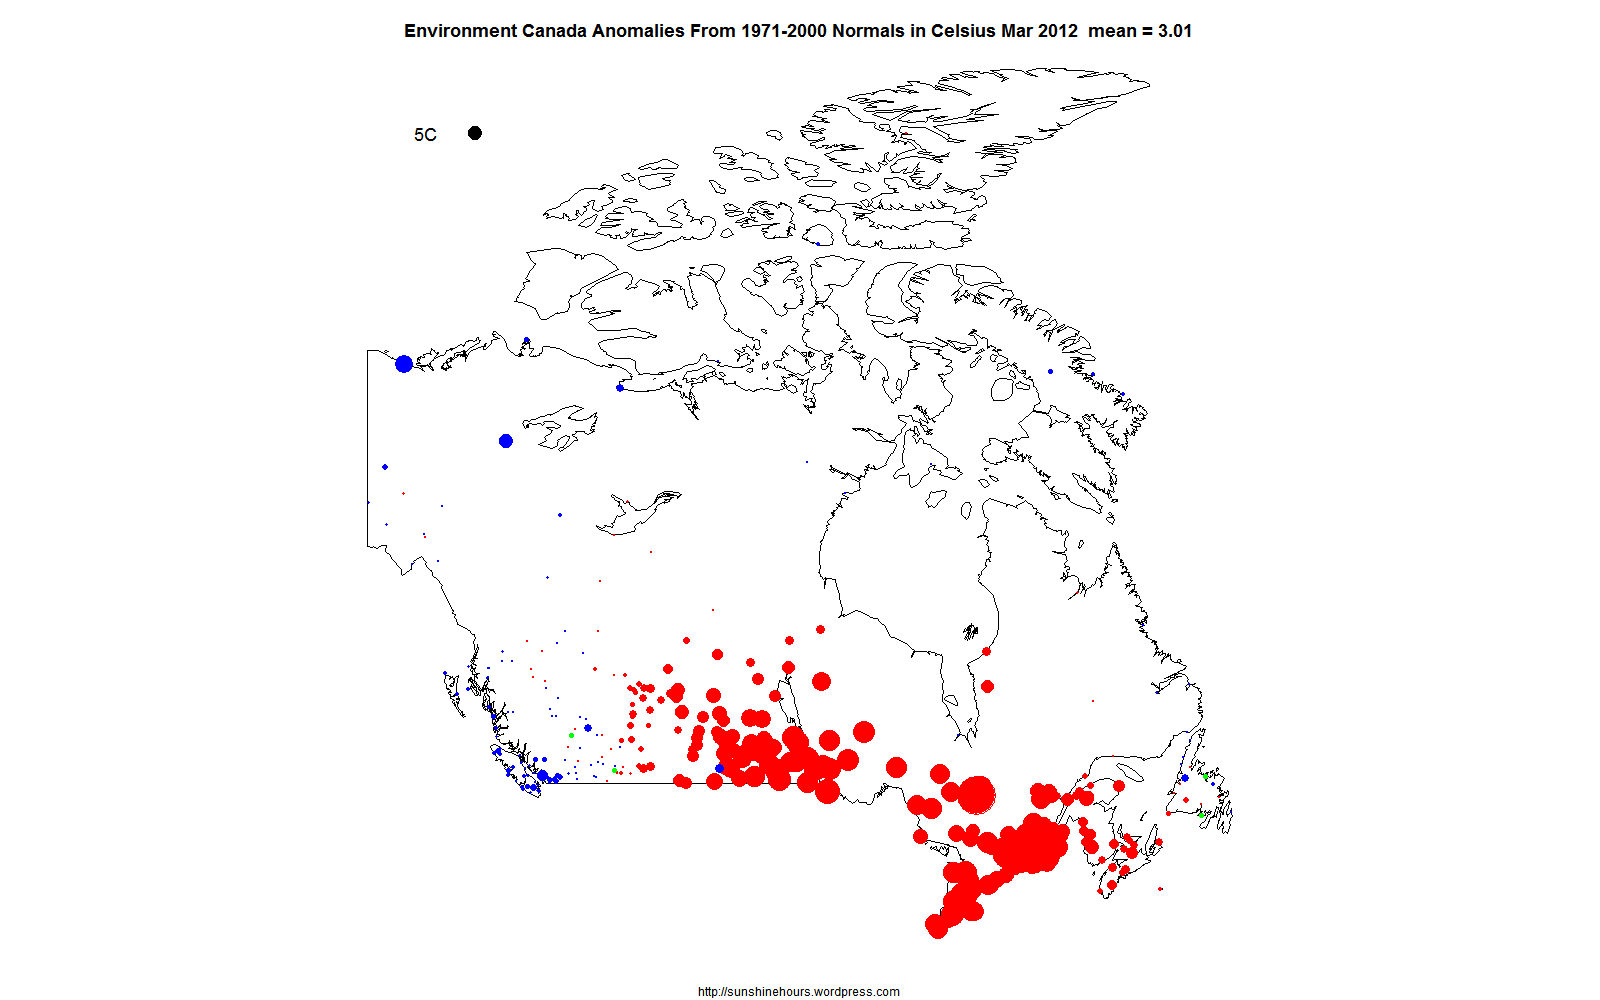
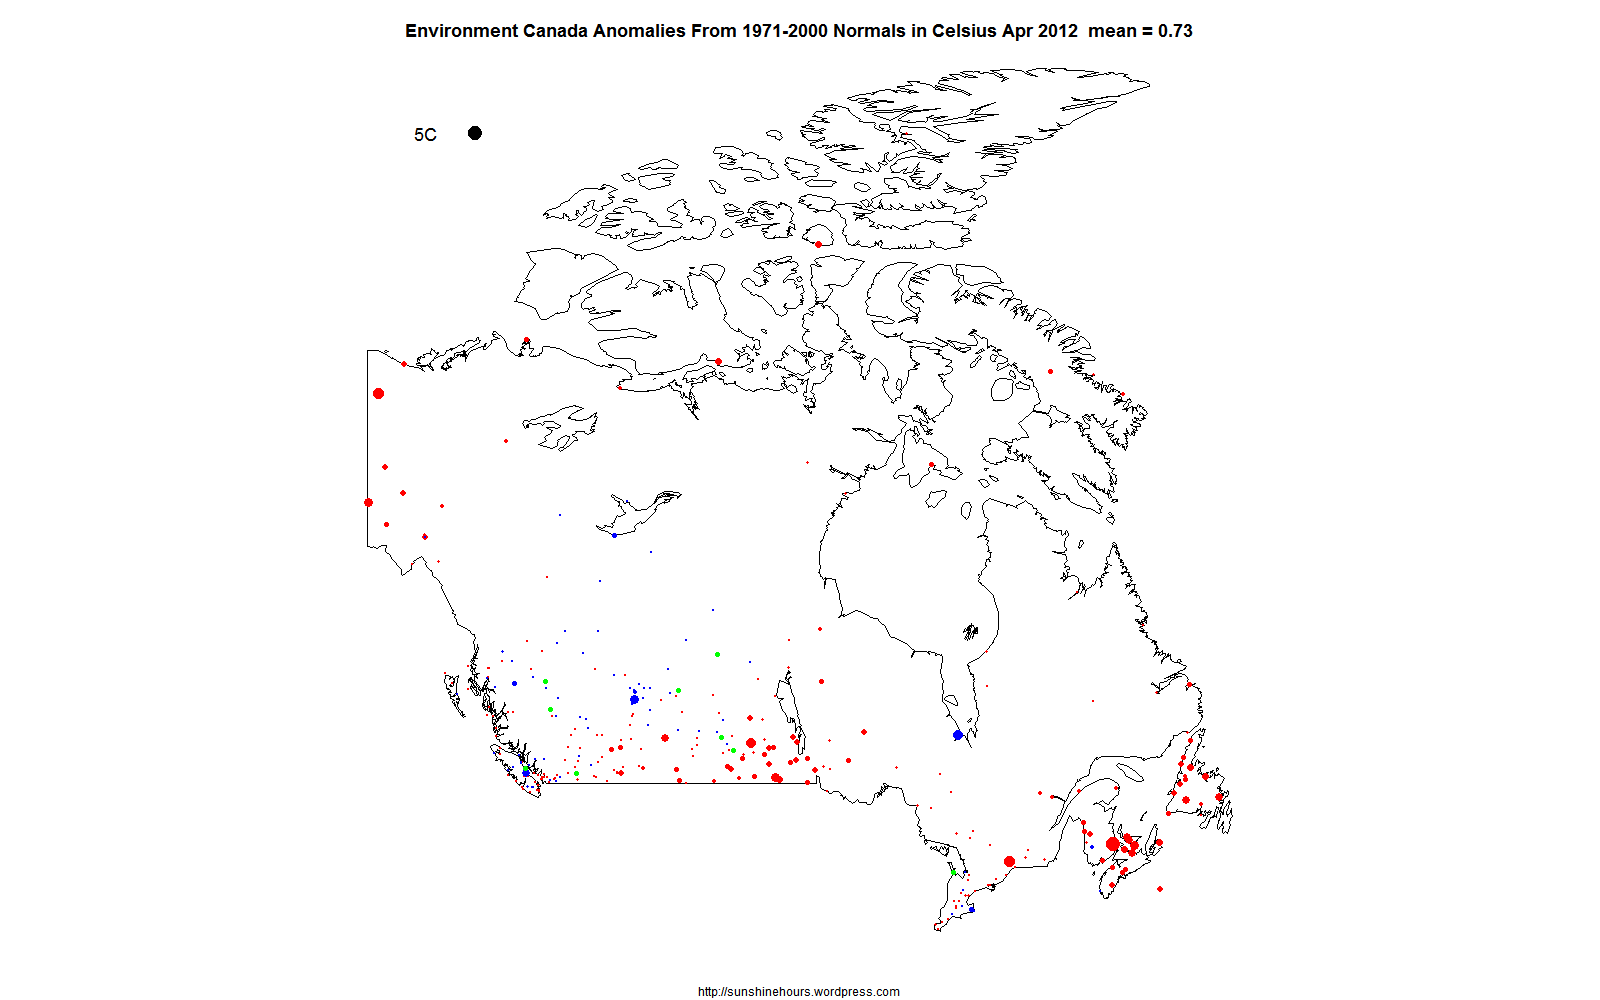
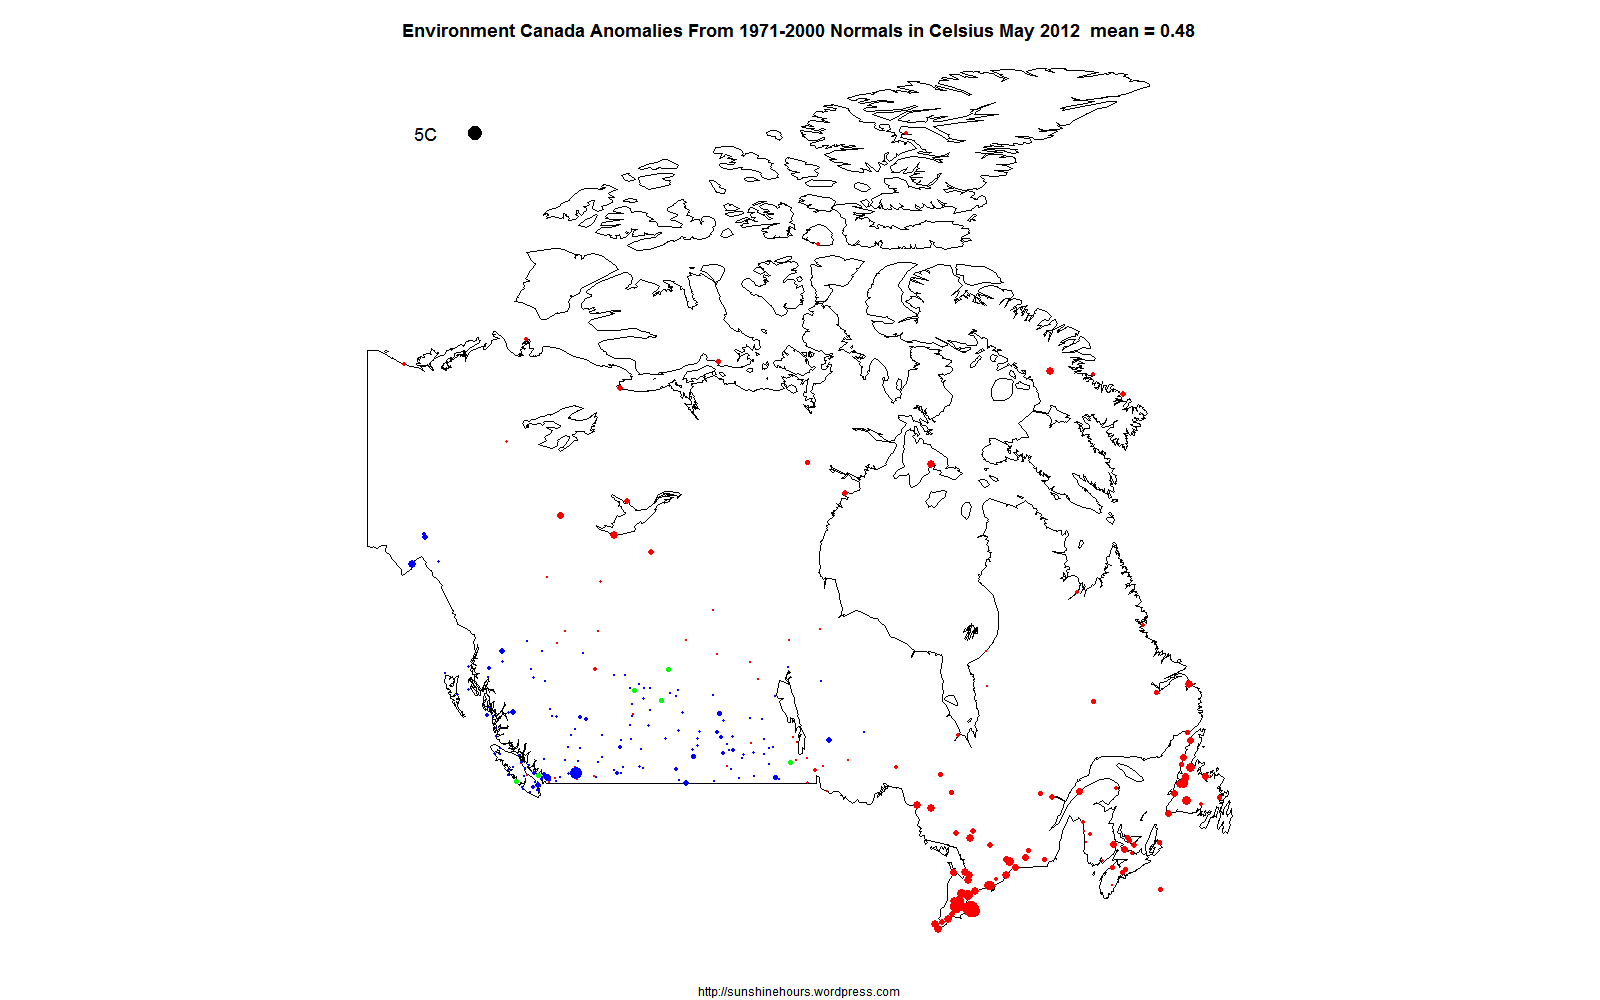
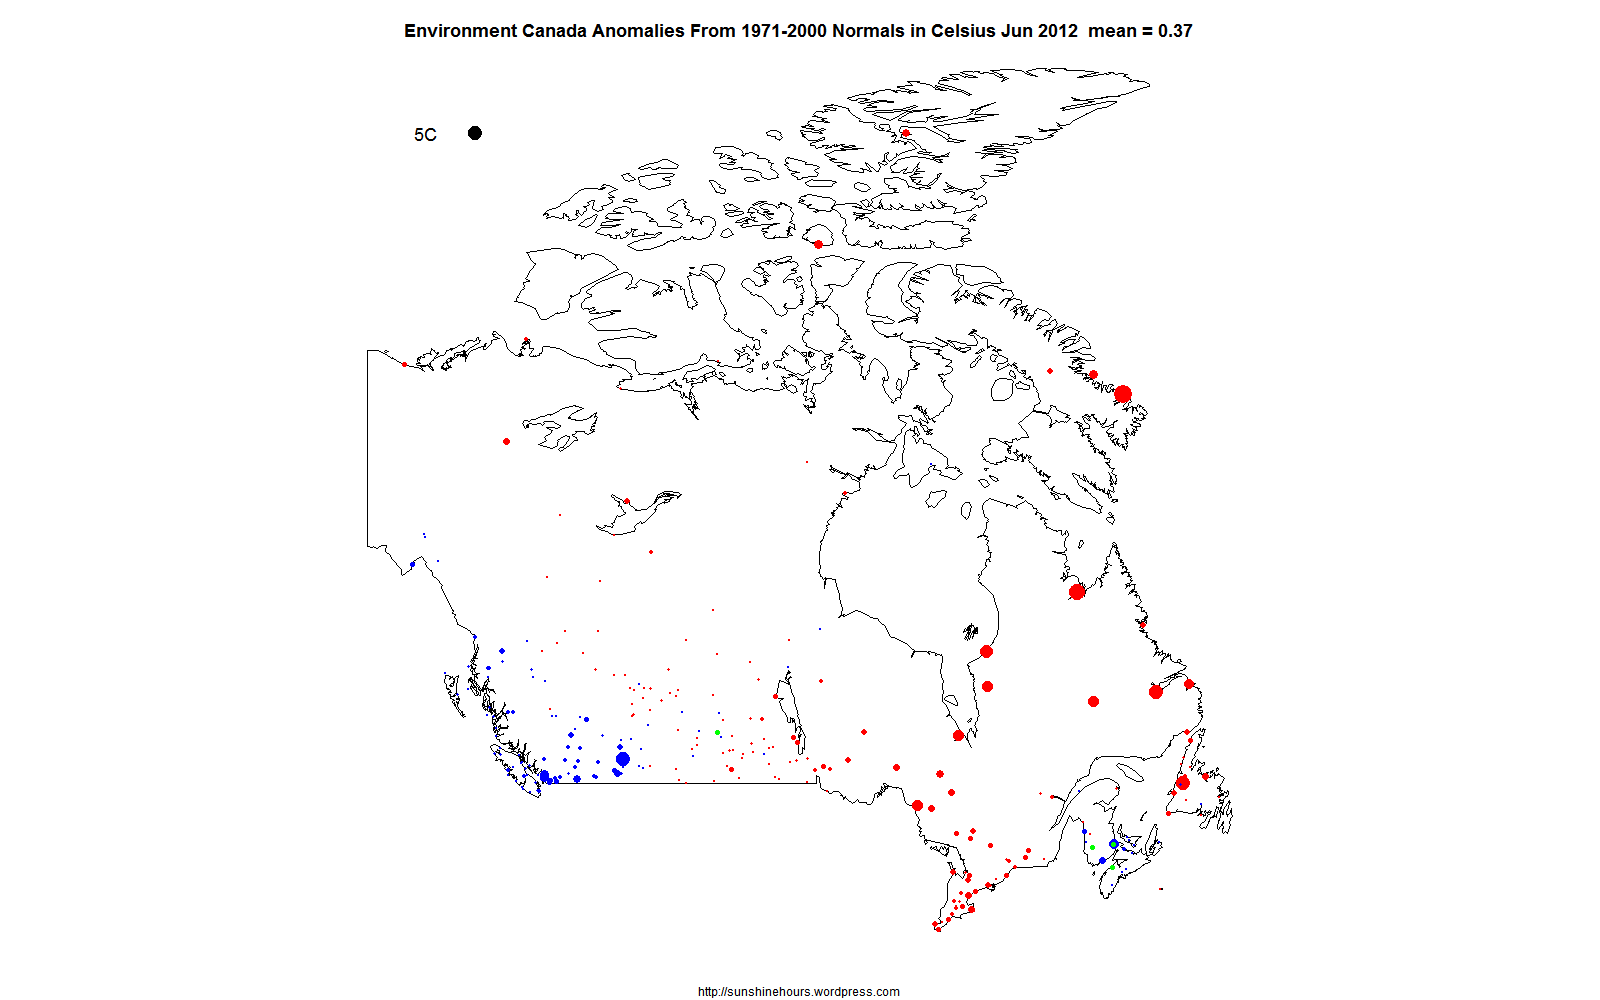
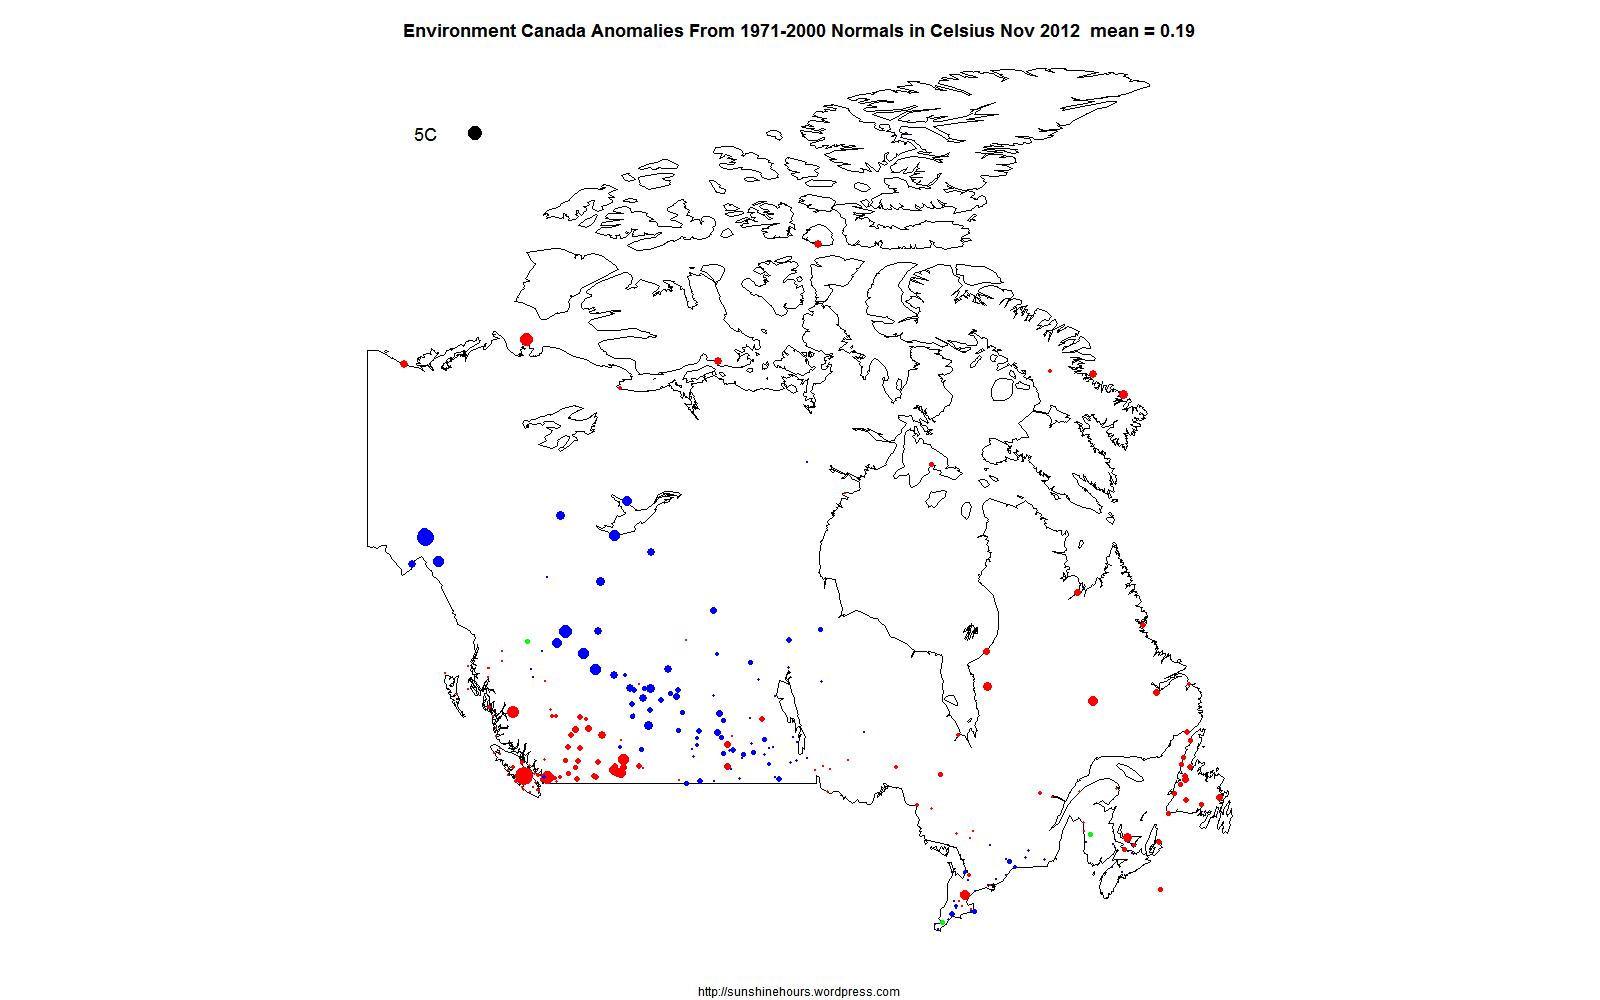
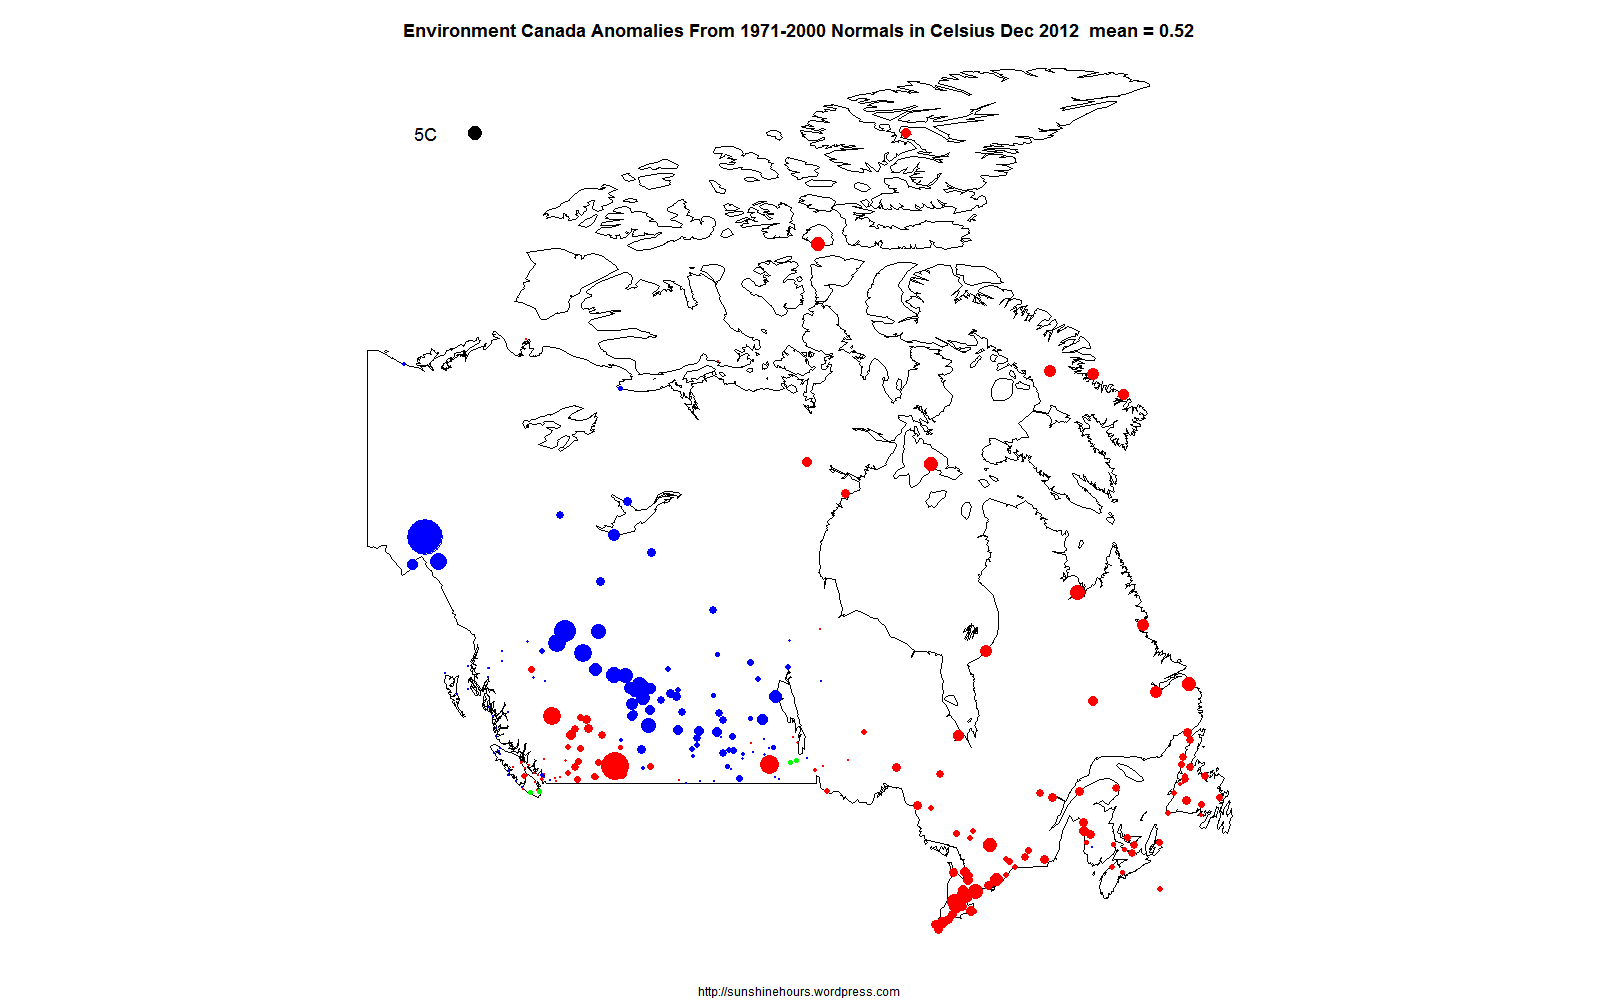
I am using Environment Canada Normals from their monthly summaries. The values are the anomaly from the 1971-2000 average (the Normals).
In 1936, 3.6% of the monthly anomalies were -10C or colder than normal.
A -10C or lower deviation from normal for a whole month is definitely extreme!
And notice 1982 is the most recent year to make the top 25.
Top 25 Cold Anomaly Months in a Year (by %)
| Year |
Anomaly_Count |
Cold_Anomalies |
Hot_Anomalies |
Pct_Cold_Anomalies |
Pct_Hot_Anomalies |
| 1936 |
2281 |
82 |
0 |
3.595 |
0 |
| 1907 |
555 |
17 |
0 |
3.063 |
0 |
| 1899 |
433 |
13 |
0 |
3.002 |
0 |
| 1950 |
3868 |
116 |
0 |
2.999 |
0 |
| 1896 |
374 |
11 |
0 |
2.941 |
0 |
| 1916 |
1332 |
36 |
0 |
2.703 |
0 |
| 1890 |
277 |
7 |
0 |
2.527 |
0 |
| 1904 |
525 |
10 |
0 |
1.905 |
0 |
| 1937 |
2361 |
40 |
0 |
1.694 |
0 |
| 1969 |
9771 |
159 |
5 |
1.627 |
0.051 |
| 1917 |
1349 |
21 |
1 |
1.557 |
0.074 |
| 1893 |
327 |
5 |
0 |
1.529 |
0 |
| 1979 |
13984 |
196 |
4 |
1.402 |
0.029 |
| 1891 |
272 |
3 |
0 |
1.103 |
0 |
| 1897 |
373 |
4 |
0 |
1.072 |
0 |
| 1982 |
14928 |
154 |
0 |
1.032 |
0 |
| 1933 |
2172 |
20 |
0 |
0.921 |
0 |
| 1939 |
2658 |
20 |
1 |
0.752 |
0.038 |
| 1922 |
1557 |
11 |
0 |
0.706 |
0 |
| 1966 |
8479 |
58 |
0 |
0.684 |
0 |
| 1911 |
674 |
4 |
1 |
0.593 |
0.148 |
| 1951 |
4120 |
24 |
0 |
0.583 |
0 |
| 1955 |
4756 |
27 |
0 |
0.568 |
0 |
| 1954 |
4592 |
26 |
1 |
0.566 |
0.022 |
| 1930 |
2025 |
11 |
2 |
0.543 |
0.099 |
Hot Anomalies are much rarer.
Only .688% of the anomalies were 10C or higher in 2006. Thats less than 1/5th of the largest percentage of cold anomalies. It was also 6 years ago.
Top 25 Hot Anomaly Months in a Year (by %)
| Year |
Anomaly_Count |
Cold_Anomalies |
Hot_Anomalies |
Pct_Cold_Anomalies |
Pct_Hot_Anomalies |
| 2006 |
6979 |
12 |
48 |
0.172 |
0.688 |
| 1931 |
2054 |
0 |
12 |
0 |
0.584 |
| 2001 |
9869 |
1 |
37 |
0.01 |
0.375 |
| 2010 |
5367 |
0 |
18 |
0 |
0.335 |
| 1981 |
14717 |
0 |
46 |
0 |
0.313 |
| 1926 |
1832 |
0 |
4 |
0 |
0.218 |
| 1947 |
3376 |
0 |
7 |
0 |
0.207 |
| 1977 |
13502 |
8 |
27 |
0.059 |
0.2 |
| 1943 |
3175 |
1 |
5 |
0.031 |
0.157 |
| 1911 |
674 |
4 |
1 |
0.593 |
0.148 |
| 1919 |
1403 |
2 |
2 |
0.143 |
0.143 |
| 1998 |
10503 |
0 |
15 |
0 |
0.143 |
| 1942 |
2977 |
1 |
4 |
0.034 |
0.134 |
| 1985 |
15582 |
84 |
20 |
0.539 |
0.128 |
| 2004 |
8159 |
0 |
9 |
0 |
0.11 |
| 2002 |
9206 |
42 |
10 |
0.456 |
0.109 |
| 1930 |
2025 |
11 |
2 |
0.543 |
0.099 |
| 1944 |
3280 |
1 |
3 |
0.03 |
0.091 |
| 1960 |
5870 |
0 |
5 |
0 |
0.085 |
| 2012 |
3750 |
2 |
3 |
0.053 |
0.08 |
| 2005 |
7581 |
0 |
6 |
0 |
0.079 |
| 1917 |
1349 |
21 |
1 |
1.557 |
0.074 |
| 1958 |
5466 |
0 |
4 |
0 |
0.073 |
| 1997 |
10891 |
2 |
8 |
0.018 |
0.073 |
| 1949 |
3693 |
11 |
2 |
0.298 |
0.054 |