UK Decembers Tmax Cooling -.45C/decade for 30 years and Sunshine is Up Too

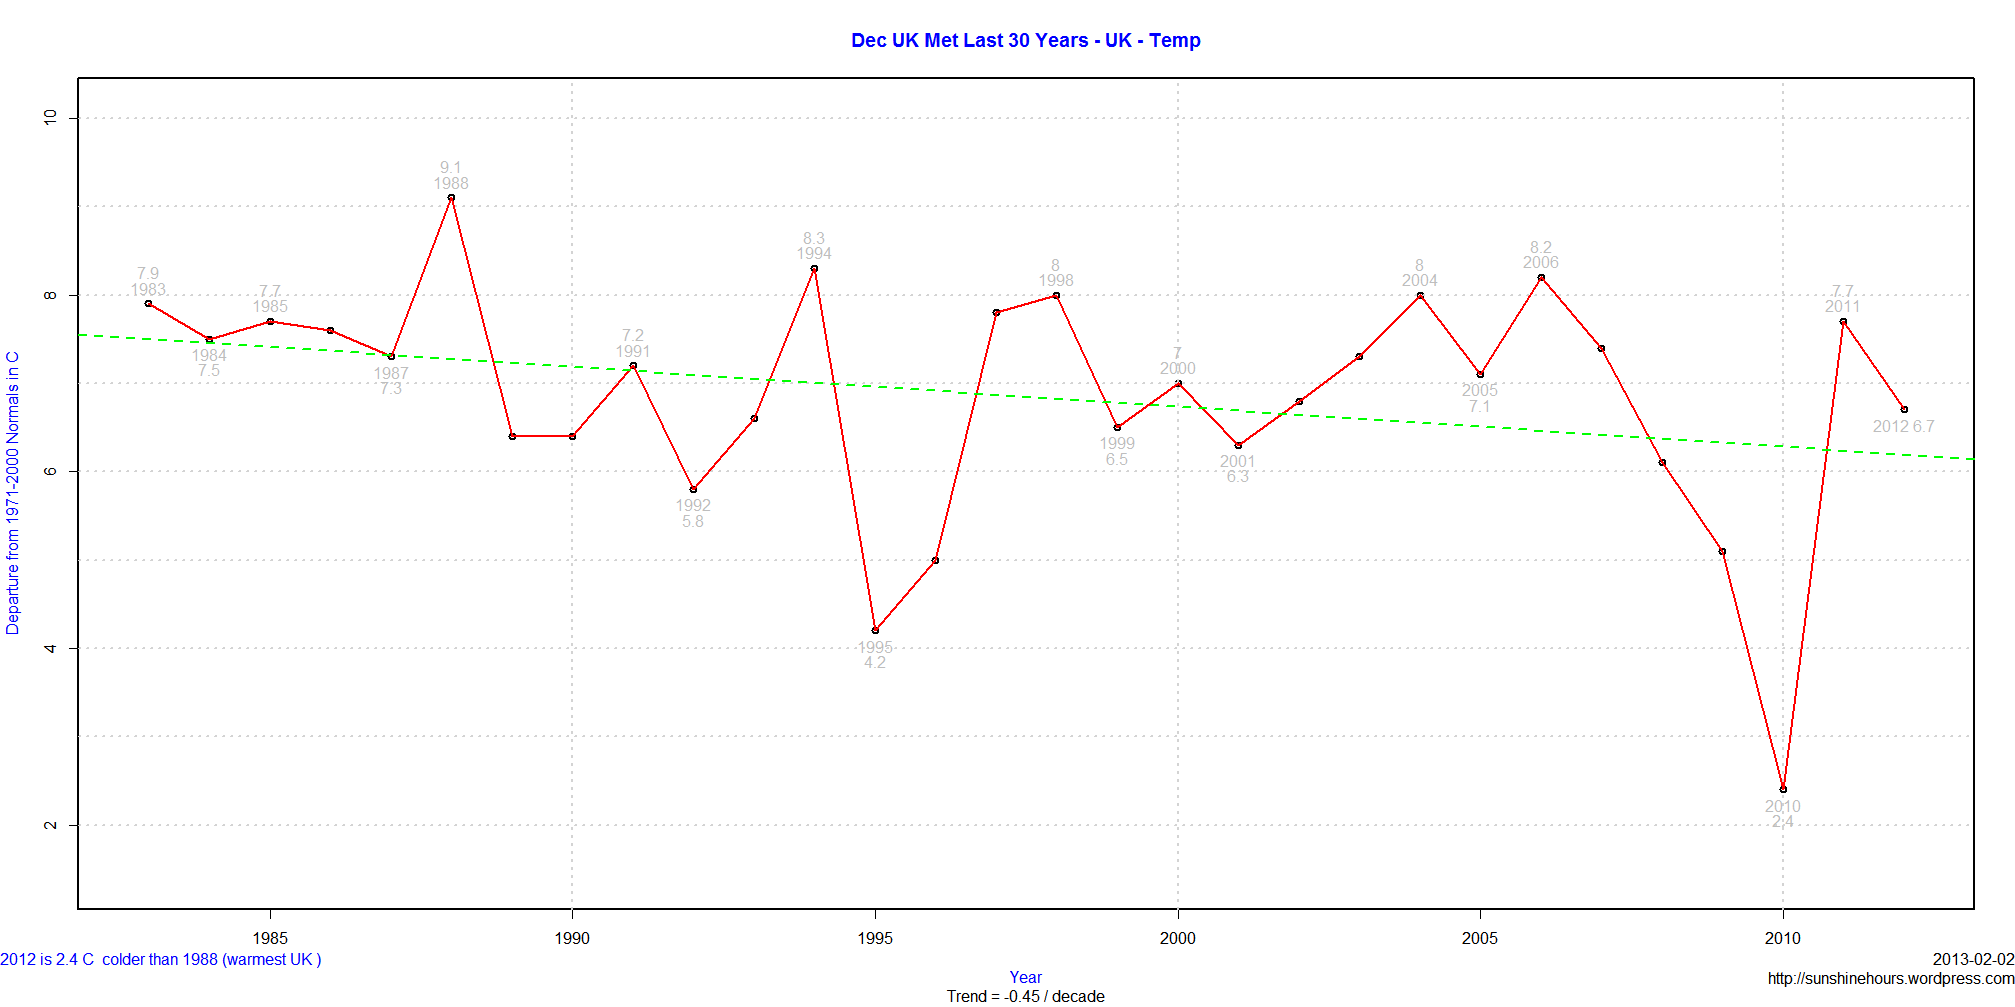
Using UK Met data from here, I noticed that Tmax for Decembers are cooling at -.45C / decade for 30 years.  Thats a lot!

And then I wondered why? A theme I have returned to over and over is that hours of bright sunshine has increased because of cleaner air. Could more sunshine in December lead to cooler Decembers since clear skies can lead to colder temperatures in winter?

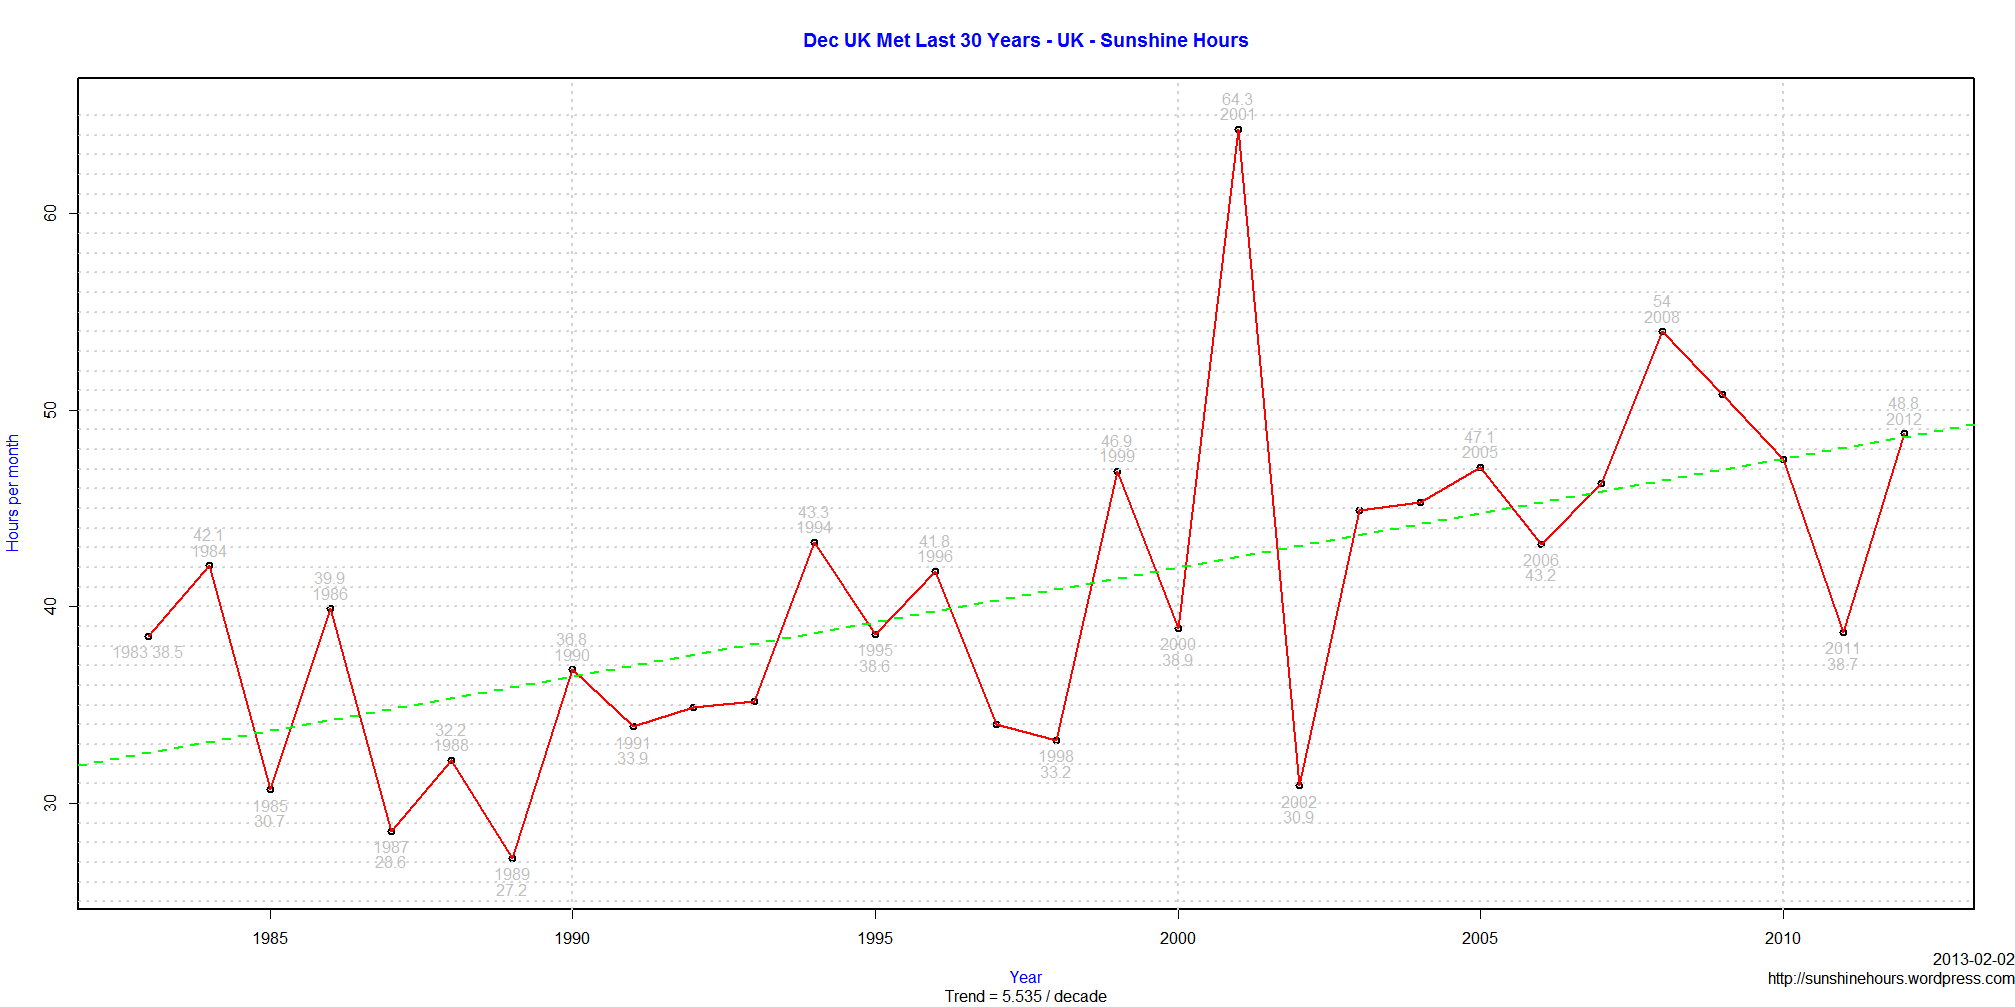
Guess what. Sunshine is up an average of 5.5 hours per year in December for the last 30 years. And compared to 1988 sunshine is up 80% in December. Instead of 28 hours of sunshine in December, the average is closer to 48.

Click on the graphs to enlarge.

Dec UK Met Last 30 Years - UK - Temp


Dec UK Met Last 30 Years - UK - Sunshine Hours


Sunshine Way Up in USA From 1996 to 2011

“A paper published today in the Journal of Geophysical Research – Atmospheres finds that due to a decrease in cloud cover, solar radiation has significantly increased over the US from 1996 to 2011. The authors note the change in longwave (infrared) surface radiation “dwarfs the [alleged contribution] from the increase of CO2 during the analysis period.” According to the paper, the natural variability due to changes in sunshine has had 4.4 times greater effect on surface radiation than increased greenhouse gases since 1996″

Read the rest at The Hockey Schtick.


As I’ve said numerous times, clean air legislation has cleaned the air, meaning less sunshine is reflected back into space, and more sunshine reaches the ground and causes warming.


Nov 2012 Canada – Only 7 Stations Collecting Sunshine Data

Nov 2012 Monthly Summary From Environment Canada is out here.

It is sad to see only 7 stations reporting bright sunshine hours. How can you actually understand climate if sunshine data isn’t collected?

Maybe that is the point.

Stn Name Prov Bright Sunshine Bright Sunshine % of Normal Year Month
VICTORIA INTL A BC 79 105 2012 11
COMOX A BC 71 125 2012 11
VANCOUVER INTL A BC 69 107 2012 11
WIARTON A ONT 60 NA 2012 11
TORONTO LESTER B. PEARSO ONT 94 NA 2012 11
CARTWRIGHT NFLD 70 NA 2012 11
GOOSE A NFLD 62 83 2012 11

Consider November 1970 when 265 stations were collecting sunshine data.

Stn Name Prov Bright Sunshine Bright Sunshine % of Normal Year Month
COWICHAN BAY CHERRY POIN BC 64 NA 1970 11
COWICHAN LAKE FORESTRY BC 51 103 1970 11
SAANICHTON CDA BC 77 115 1970 11
VICTORIA GONZALES HTS BC 94 113 1970 11
VICTORIA INTL A BC 89 118 1970 11
NANAIMO A BC 72 109 1970 11
ALBERNI LUPSI CUPSI BC 51 NA 1970 11
ESTEVAN POINT BC 72 NA 1970 11
SANDSPIT A BC 85 135 1970 11
KITIMAT TOWNSITE BC 61 143 1970 11
KITIMAT 2 BC 53 NA 1970 11
PRINCE RUPERT A BC 98 211 1970 11
WADHAMS CDF BC 48 NA 1970 11
SMITHERS A BC 46 113 1970 11
TOPLEY LANDING BC 41 91 1970 11
PUNTZI MOUNTAIN BC 96 NA 1970 11
BURNS LAKE BC 55 106 1970 11
PRINCE GEORGE A BC 52 91 1970 11
WILLIAMS LAKE A BC 82 128 1970 11
ABBOTSFORD A BC 64 96 1970 11
AGASSIZ CDA BC 52 87 1970 11
HANEY UBC RF SPUR 17 BC 54 NA 1970 11
VANCOUVER BCHPA BC 75 NA 1970 11
VANCOUVER INTL A BC 74 114 1970 11
VANCOUVER UBC BC 68 99 1970 11
LYTTON BC 65 108 1970 11
MCCULLOCH BC 52 79 1970 11
OLIVER STP BC 57 88 1970 11
SUMMERLAND CDA BC 51 79 1970 11
VERNON SOUTHWEST BC 33 NA 1970 11
BEAVERDELL BC 40 NA 1970 11
CASTLEGAR A BC 57 111 1970 11
TRAIL TADANAC BC 45 NA 1970 11
CRANBROOK A BC 96 129 1970 11
KIMBERLEY COMINCO BC 80 NA 1970 11
BLUE RIVER A BC 48 126 1970 11
KAMLOOPS A BC 47 72 1970 11
SALMON ARM BC 14 NA 1970 11
REVELSTOKE AIRPORT RD BC 28 77 1970 11
FORT ST JOHN A BC 55 70 1970 11
GERMANSEN LANDING BC 50 138 1970 11
MCLEOD LAKE BC 31 NA 1970 11
HAINES JUNCTION YT 11 NA 1970 11
PELLY RANCH YT 21 133 1970 11
WATSON LAKE A YT 43 107 1970 11
WHITEHORSE A YT 36 84 1970 11
FORT SIMPSON NWT 50 NA 1970 11
FORT SMITH A NWT 52 144 1970 11
INUVIK A NWT 26 NA 1970 11
YELLOWKNIFE A NWT 42 101 1970 11
BAKER LAKE A NU 89 NA 1970 11
COPPERMINE NU 13 NA 1970 11
CORAL HARBOUR A NU 62 117 1970 11
CAMBRIDGE BAY A NU 20 133 1970 11
CAPE DORSET A NU 3 NA 1970 11
IQALUIT A NU 52 129 1970 11
RESOLUTE CARS NU 0 NA 1970 11
MOULD BAY A NWT 0 NA 1970 11
SACHS HARBOUR A NWT 7 NA 1970 11
EDMONTON INTL A ALTA 77 78 1970 11
EDMONTON CITY CENTRE A ALTA 78 77 1970 11
ELLERSLIE ALTA 67 66 1970 11
RANFURLY ALTA 56 69 1970 11
DRUMHELLER INSTITUTION ALTA 77 NA 1970 11
LACOMBE CDA ALTA 83 86 1970 11
OLDS ALTA 104 113 1970 11
BROOKS AHRC ALTA 74 69 1970 11
CALGARY INTL A ALTA 141 113 1970 11
LETHBRIDGE CDA ALTA 90 82 1970 11
MEDICINE HAT A ALTA 89 76 1970 11
SUFFIELD A ALTA 87 74 1970 11
UNIVERSITY OF CALGARY ALTA 116 NA 1970 11
MANYBERRIES CDA ALTA 94 77 1970 11
KANANASKIS ALTA 39 NA 1970 11
RED DEER RS ALTA 123 NA 1970 11
EDSON A ALTA 65 69 1970 11
WAGNER ALTA 82 NA 1970 11
BEAVERLODGE CDA ALTA 75 89 1970 11
FAIRVIEW ALTA 65 83 1970 11
FORT VERMILION CDA ALTA 75 NA 1970 11
KEG RIVER ALTA 50 NA 1970 11
BROADVIEW SASK 69 65 1970 11
ESTEVAN A SASK 81 72 1970 11
INDIAN HEAD CDA SASK 71 NA 1970 11
INDIAN HEAD PFRA SASK 67 70 1970 11
MOOSE JAW A SASK 90 83 1970 11
ORMISTON SASK 69 75 1970 11
REGINA A SASK 73 71 1970 11
WYNYARD SASK 56 60 1970 11
YORKTON A SASK 62 64 1970 11
SWIFT CURRENT A SASK 86 78 1970 11
SWIFT CURRENT CDA SASK 87 83 1970 11
SCOTT CDA SASK 0 NA 1970 11
MELFORT CDA SASK 66 83 1970 11
OUTLOOK PFRA SASK 67 73 1970 11
PRINCE ALBERT A SASK 64 79 1970 11
SASKATOON SRC SASK 69 70 1970 11
CREE LAKE SASK 61 108 1970 11
BRANDON CDA MAN 67 69 1970 11
RIVERS A MAN 0 NA 1970 11
GLENLEA MAN 72 81 1970 11
MORDEN CDA MAN 86 89 1970 11
WINNIPEG INTL A MAN 70 74 1970 11
BISSETT MAN 58 76 1970 11
GRAND RAPIDS MAN 66 NA 1970 11
INDIAN BAY MAN 68 86 1970 11
DAUPHIN A MAN 88 90 1970 11
DELTA MARSH CS MAN 77 83 1970 11
THE PAS A MAN 62 81 1970 11
CHURCHILL A MAN 62 114 1970 11
LYNN LAKE A MAN 60 114 1970 11
THOMPSON A MAN 56 85 1970 11
ATIKOKAN ONT 66 87 1970 11
RAWSON LAKE ONT 47 81 1970 11
ARMSTRONG (AUT) ONT 57 NA 1970 11
CARIBOU ISLAND ONT 75 NA 1970 11
THUNDER BAY A ONT 92 104 1970 11
SAULT STE MARIE A ONT 79 124 1970 11
WHITE RIVER ONT 57 NA 1970 11
TURBINE ONT 82 130 1970 11
KAPUSKASING CDA ONT 56 105 1970 11
MOOSONEE UA ONT 54 93 1970 11
NEW LISKEARD ONT 78 NA 1970 11
NORTH BAY A ONT 76 113 1970 11
SOUTH BAYMOUTH ONT 89 125 1970 11
CORNWALL ONT HYDRO ONT 67 90 1970 11
KEMPTVILLE ONT 82 92 1970 11
KINGSTON A ONT 60 68 1970 11
OTTAWA CDA ONT 68 81 1970 11
PETAWAWA NAT FORESTRY ONT 58 86 1970 11
DELHI CDA ONT 53 63 1970 11
HARROW CDA ONT 53 59 1970 11
VINELAND STATION ONT 76 92 1970 11
ELORA RESEARCH STN ONT 52 NA 1970 11
GUELPH OAC ONT 56 NA 1970 11
LONDON A ONT 43 61 1970 11
MOUNT FOREST ONT 47 NA 1970 11
ALBION FIELD CENTRE ONT 56 74 1970 11
BURKETON MCLAUGHLIN ONT 62 81 1970 11
CLAREMONT FIELD CENTRE ONT 50 NA 1970 11
HAMILTON RBG ONT 64 74 1970 11
MORVEN IHD ONT 0 NA 1970 11
OAK RIDGES ONT 52 NA 1970 11
SMITHFIELD CDA ONT 66 92 1970 11
TORONTO ONT 60 71 1970 11
BERTHIERVILLE QUE 66 82 1970 11
DUCHESNAY QUE 77 99 1970 11
LASSOMPTION QUE 73 87 1970 11
QUEBEC/JEAN LESAGE INTL QUE 86 105 1970 11
ST AUGUSTIN QUE 78 91 1970 11
LAC AUX SABLES QUE 64 90 1970 11
ARTHABASKA QUE 74 NA 1970 11
DISRAELI QUE 56 96 1970 11
IBERVILLE QUE 65 101 1970 11
LAPRAIRIE QUE 56 NA 1970 11
LENNOXVILLE QUE 57 79 1970 11
MAPLE LEAF EAST QUE 65 NA 1970 11
MONTREAL/PIERRE ELLIOTT QUE 73 85 1970 11
MONTREAL JAR BOT QUE 64 NA 1970 11
MONTREAL JEAN BREBEUF QUE 65 NA 1970 11
MONTREAL MCGILL QUE 67 82 1970 11
STE ANNE DE BELLEVUE QUE 79 95 1970 11
STE CLOTHILDE CDA QUE 72 92 1970 11
ST HYACINTHE 2 QUE 61 96 1970 11
ST ISIDORE DAUCKLAND QUE 71 NA 1970 11
ST LUDGER QUE 57 NA 1970 11
SAWYERVILLE NORD QUE 64 108 1970 11
SHERBROOKE QUE 61 NA 1970 11
SUTTON JONCTION QUE 63 NA 1970 11
VALLEE JONCTION QUE 51 86 1970 11
WEST DITTON QUE 62 92 1970 11
HARRINGTON FOREST FARM QUE 53 105 1970 11
MANIWAKI UA QUE 64 95 1970 11
STE AGATHE DES MONTS QUE 63 86 1970 11
SHAWVILLE QUE 69 103 1970 11
BLANC SABLON QUE 8 NA 1970 11
BAIE COMEAU QUE 76 NA 1970 11
FORESTVILLE QUE 87 101 1970 11
FORET MONTMORENCY QUE 72 99 1970 11
GAGNON A QUE 49 NA 1970 11
GRANDES BERGERONNES QUE 79 95 1970 11
NATASHQUAN A QUE 56 58 1970 11
SEPT-ILES UA QUE 81 NA 1970 11
RIVIERE AU TONNERRE QUE 72 83 1970 11
ST FRANCOIS IO QUE 94 107 1970 11
ARMAGH STATION QUE 70 103 1970 11
BERRY MOUNTAIN QUE 62 NA 1970 11
CAPLAN QUE 93 NA 1970 11
CAP SEIZE QUE 57 117 1970 11
CAUSAPSCAL RECHERCHES QUE 39 NA 1970 11
GRINDSTONE ISLAND QUE 88 NA 1970 11
LA POCATIERE CDA QUE 90 96 1970 11
MONT LOGAN QUE 4 NA 1970 11
NEW RICHMOND QUE 96 NA 1970 11
NOTRE DAME DU LAC QUE 64 100 1970 11
OUIMET QUE 55 97 1970 11
RIMOUSKI QUE 53 90 1970 11
RIVIERE AU RENARD QUE 93 NA 1970 11
ROMIEU SUD QUE 61 NA 1970 11
STE GERMAINE QUE 70 110 1970 11
ALBANEL QUE 63 NA 1970 11
LAC STE CROIX QUE 56 113 1970 11
NORMANDIN CDA QUE 65 92 1970 11
PERIBONCA QUE 51 NA 1970 11
RIVIERE AUX RATS QUE 56 NA 1970 11
ST AMBROISE QUE 50 NA 1970 11
ST COEUR DE MARIE QUE 48 94 1970 11
OSKELANEO QUE 56 NA 1970 11
PARENT QUE 64 NA 1970 11
RAPIDE BLANC QUE 60 NA 1970 11
ST MICHEL DES SAINTS QUE 59 102 1970 11
BARRAGE TEMISCAMINGUE QUE 67 110 1970 11
MANNEVILLE QUE 72 142 1970 11
VILLE MARIE QUE 84 NA 1970 11
AMOS QUE 76 143 1970 11
BARRIERE LOUVICOURT QUE 70 NA 1970 11
EASTMAIN QUE 0 NA 1970 11
LAC CACHE QUE 35 NA 1970 11
MATAGAMI QUE 62 NA 1970 11
NITCHEQUON QUE 37 NA 1970 11
POULARIES QUE 78 158 1970 11
SENNETERRE QUE 60 125 1970 11
VAL-DOR A QUE 76 132 1970 11
INUKJUAK UA QUE 23 73 1970 11
KUUJJUARAPIK A QUE 23 65 1970 11
BORDER A QUE 48 NA 1970 11
DECEPTION BAY QUE 15 NA 1970 11
KUUJJUAQ A QUE 58 121 1970 11
SCHEFFERVILLE A QUE 67 140 1970 11
CHARLO A NB 82 89 1970 11
MIRAMICHI A NB 92 90 1970 11
FREDERICTON CDA NB 98 97 1970 11
MONCTON A NB 92 90 1970 11
ROYAL ROAD NB 90 94 1970 11
SAINT JOHN A NB 103 97 1970 11
ANNAPOLIS ROYAL NS 84 118 1970 11
BACCARO NS 128 NA 1970 11
COPPER LAKE NS 77 NA 1970 11
FRASER BROOK IHD NS 92 NA 1970 11
KENTVILLE CDA NS 106 127 1970 11
NAPPAN CDA NS 94 111 1970 11
RIVER HEBERT NS 101 NA 1970 11
SABLE ISLAND NS 66 86 1970 11
SHARPE BROOK IHD NS 110 NA 1970 11
SHEARWATER A NS 109 96 1970 11
SYDNEY A NS 93 118 1970 11
TRURO NS 90 114 1970 11
YARMOUTH A NS 115 116 1970 11
CHARLOTTETOWN CDA PEI 103 134 1970 11
EAST BALTIC PEI 96 137 1970 11
HUNTER RIVER PEI 93 NA 1970 11
MORELL REAR SITE 305 PEI 102 NA 1970 11
OLEARY PEIDA PEI 89 NA 1970 11
SUMMERSIDE A PEI 105 121 1970 11
TIGNISH PEI 92 97 1970 11
BURGEO NFLD 64 74 1970 11
COLINET PEAT BOG CDA NFLD 0 NA 1970 11
DANIELS HARBOUR NFLD 43 91 1970 11
GANDER INTL A NFLD 65 90 1970 11
PLACENTIA NFLD 68 NA 1970 11
ST JOHNS A NFLD 75 110 1970 11
ST JOHNS WEST CDA NFLD 69 96 1970 11
STEPHENVILLE A NFLD 59 114 1970 11
CHURCHILL FALLS A NFLD 58 103 1970 11
GOOSE A NFLD 74 100 1970 11

UK Tmax versus Sunshine are well correlated. Cleaner Air. More Sunshine.

This graph is Tmax % of normal versus Sunshine% of normal. The curved lines are the Loess curves from [R]. Data retrieved from here.

Why would sunshine be higher? Cleaner air in the UK (until China and India started to burn a lot more coal) thanks to the Clean Air Acts of 1956 and 1968.

The loess curves bottom out around 1968/1972.

UK Tmax vs Sunshine (Annual)_Tmax_Sunshine


Sunshine Up in Spain From 1985 to 2010 by 3.9W/m^2

The Hockey Schtick has found another paper showing sunshine is way up in Spain. And more sunshine means warming.

“The mean annual G series over Spain shows a tendency to increase during the 1985-2010 period, with a significant linear trend of + 3.9 Wm- 2 per decade. Similar significant increases are observed in the mean seasonal series, with the highest rate of change during summer (+ 6.5 Wm- 2 per decade) and secondly in autumn (+ 4.1 W m- 2 per decade) and spring (+ 3.2 Wm- 2 per decade). These results are in line with the widespread increase of G, also known as brightening period, reported at many worldwide observation sites.”

3.9W/m^2 is more than the effect of a doubling of CO2 (which has not happened yet)

The abstract is here.


I have other blog posts on the subject here.


Huge Increase in Sunshine Reaching Earth – 12.5 times the CO2 warming

The Hockey Schtick points to a new paper that finds a large increase in sunshine over the last 26 years.

“According to the authors, “the average increase of [surface solar radiation] from 1982 to 2008 is estimated to be 0.87 W m−2 per decade,” which equates to 2.26 W m-2 over the 26 year period. By way of comparison, this forcing was 12.5 times greater than the surface forcing alleged by the IPCC from increased CO2 over the same period.

The abstract is here. The paper is here.

“since the late 1980’s Rs has brightened over Europe due to decreases in aerosols but dimmed over China due to their increases. We found that variation of cloud cover determines Rs at a monthly scale but that aerosols determine the variability of Rs at a decadal time scale, in particular, over Europe and China.”

The warming since 1980 was caused by clean air legislation in the the US, UK and Europe.

Not by CO2.

I have posted several articles on this theme here , here and here.

Sunshine Up In Switzerland Since the 1980s

I see Martin Wild is still writing papers proving that Surface Solar Radiation (I tend to call it Bright Sunshine)  is higher than in the past. (Thanks HockeySchtick)

Decadal variations in estimated surface solar radiation over Switzerland since the late 19th century – A. Sanchez-Lorenzo and M. Wild

All-sky SSR has been fairly stable with little variations in the first half of the 20th century, unlike the second half of the 20th century that is characterized also in Switzerland by a dimming from the 1950s to the 1980s and a subsequent brightening.

Does this graph of Sunshine changes look like the temperature changes graphs?

The effect of CO2 doubling is supposed to be 3.7W/m^2. In this table, changes in sunshine from 1981 to 2011 produce 5.59W/m^2 in December to 15.25W/m^2 in April.

UK Met Bright Sunshine 5 year averages plotted using all monthly anomalies

An addition to this post on 5 year averages using NOAA data. This time I am using UK Met Bright Sunshine data.

1) The current 5 year period has less bright sunshine than the previous 5 year period.

2) The previous 5 year period had no large negative anomalies, and no unusual positive anomalies, yet it was the most sunshine since 1929.

3) The period from 1988 to 2008 was the longest without a -50 hour anomaly.

4) The large negative anomalies are returning to normal.

UK Sunshine Hours versus Tmax

You can download climate data from the UK Met here.

If you graph the difference between the median sunshine hours against the difference  between the median maximum temperature (Tmax) you see sunshine on the rise and tmax on the rise.

Don’t forget to ask the AGW side whether climate variables other than CO2 have changed recently.

Arkansas NOAA temperatures versus some old Sunshine Data.

Carrick posted a link to some old sunshine data.

There were two entries for Arkansas. Data ends in 1990. There are multiple columns. I chose the first: “Flat-Plate Collector Facing South at Fixed Tilt=0”.

For July the correlation was .629 and .685. Considering that I am comparing local sunshine to the whole states temperature, not bad. Too bad there isn’t more recent data.