According to the UK Met Office 2015 was the 9th highest (since 1929) for sunshine.
Approximate 100 hours higher than the 1981-2010 average.
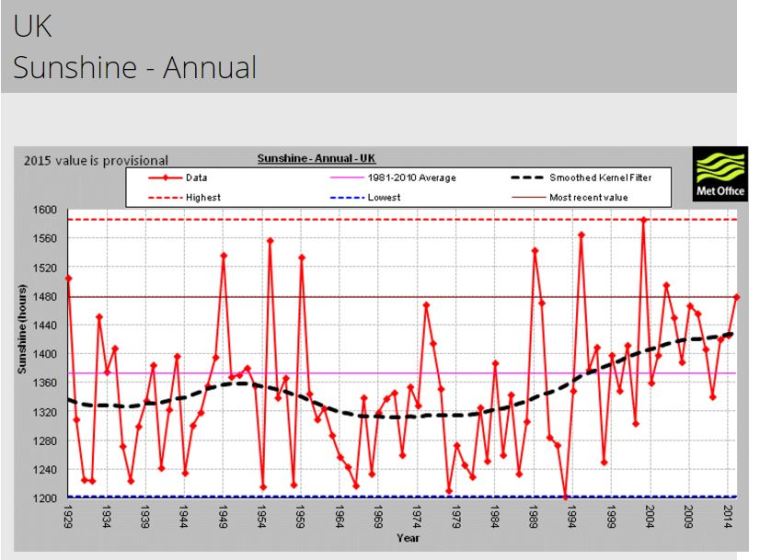
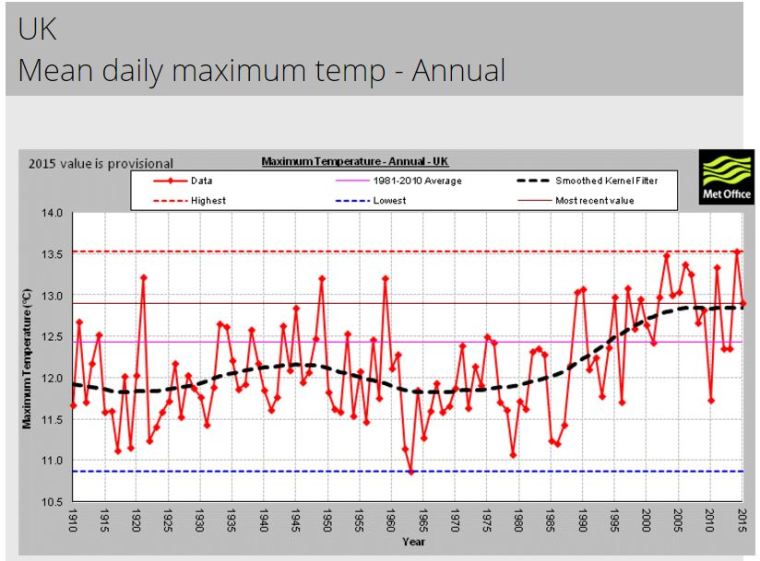
UK Max temperature graph looks similar to the sunshine graph.
According to the UK Met Office 2015 was the 9th highest (since 1929) for sunshine.
Approximate 100 hours higher than the 1981-2010 average.
UK Max temperature graph looks similar to the sunshine graph.
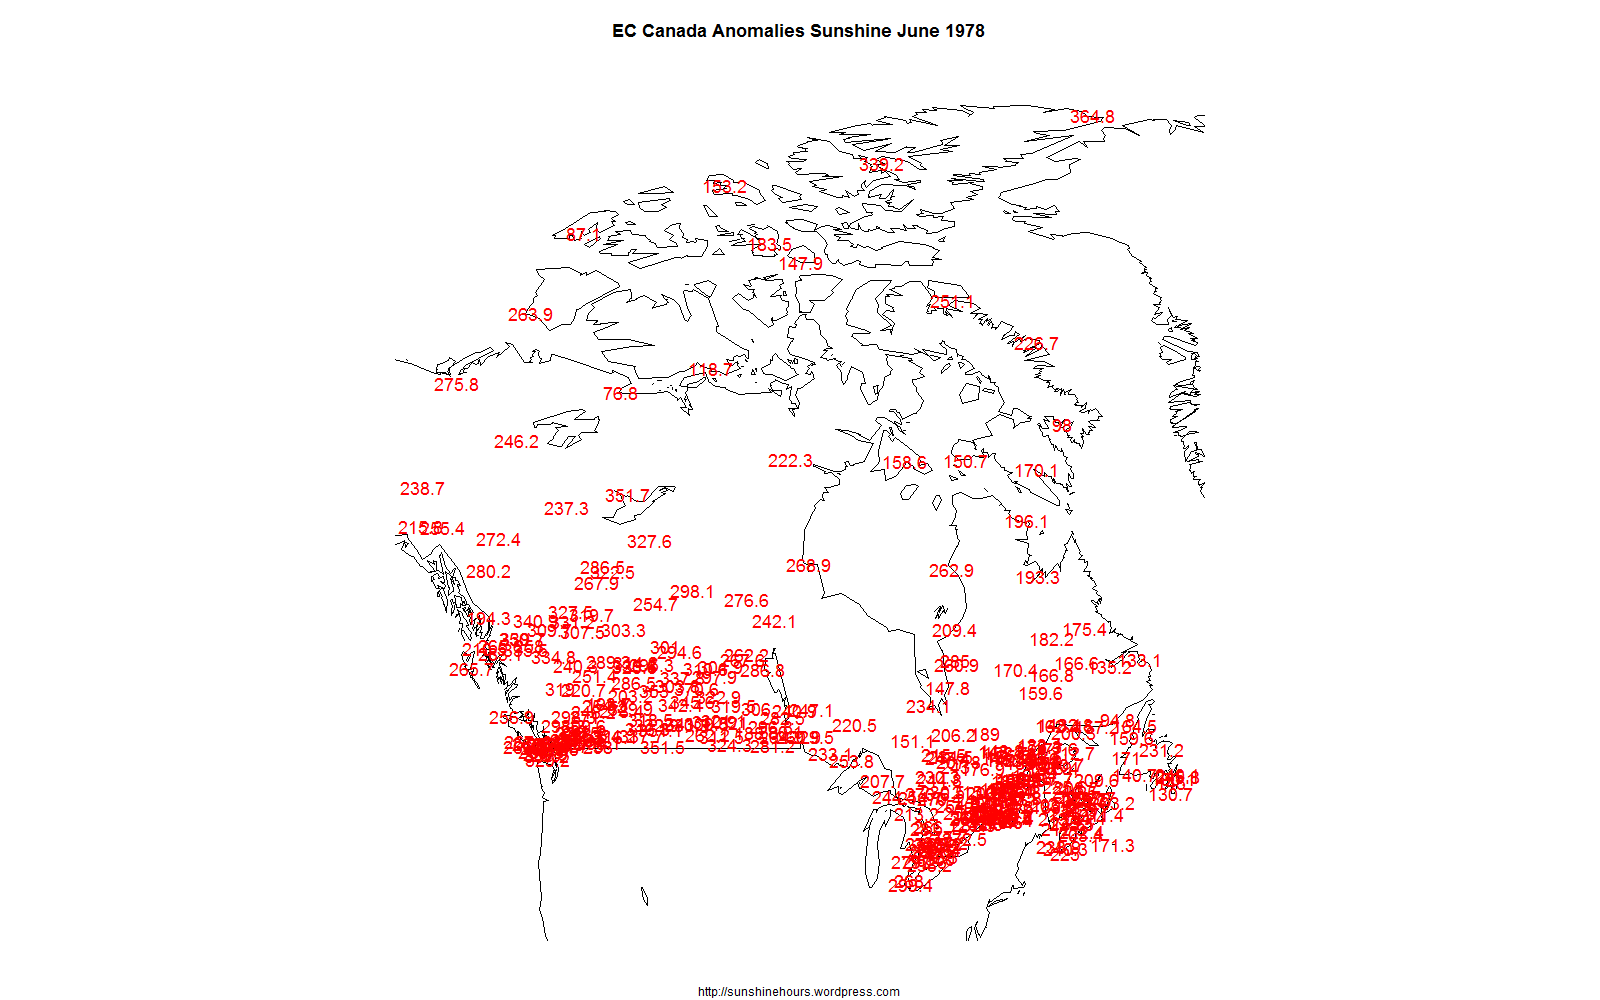
Once up a time (June of 1978 to be precise) if you downloaded Environment Canada’s monthly summaries, you would have found 313 stations with “Bright Sunshine” hours.
Even two years ago, these stations were reporting sunshine data:
TORONTO LESTER B. PEARSON INT’L A
CARTWRIGHT
GOOSE A
VICTORIA INT’L A
COMOX A
VANCOUVER INT’L A
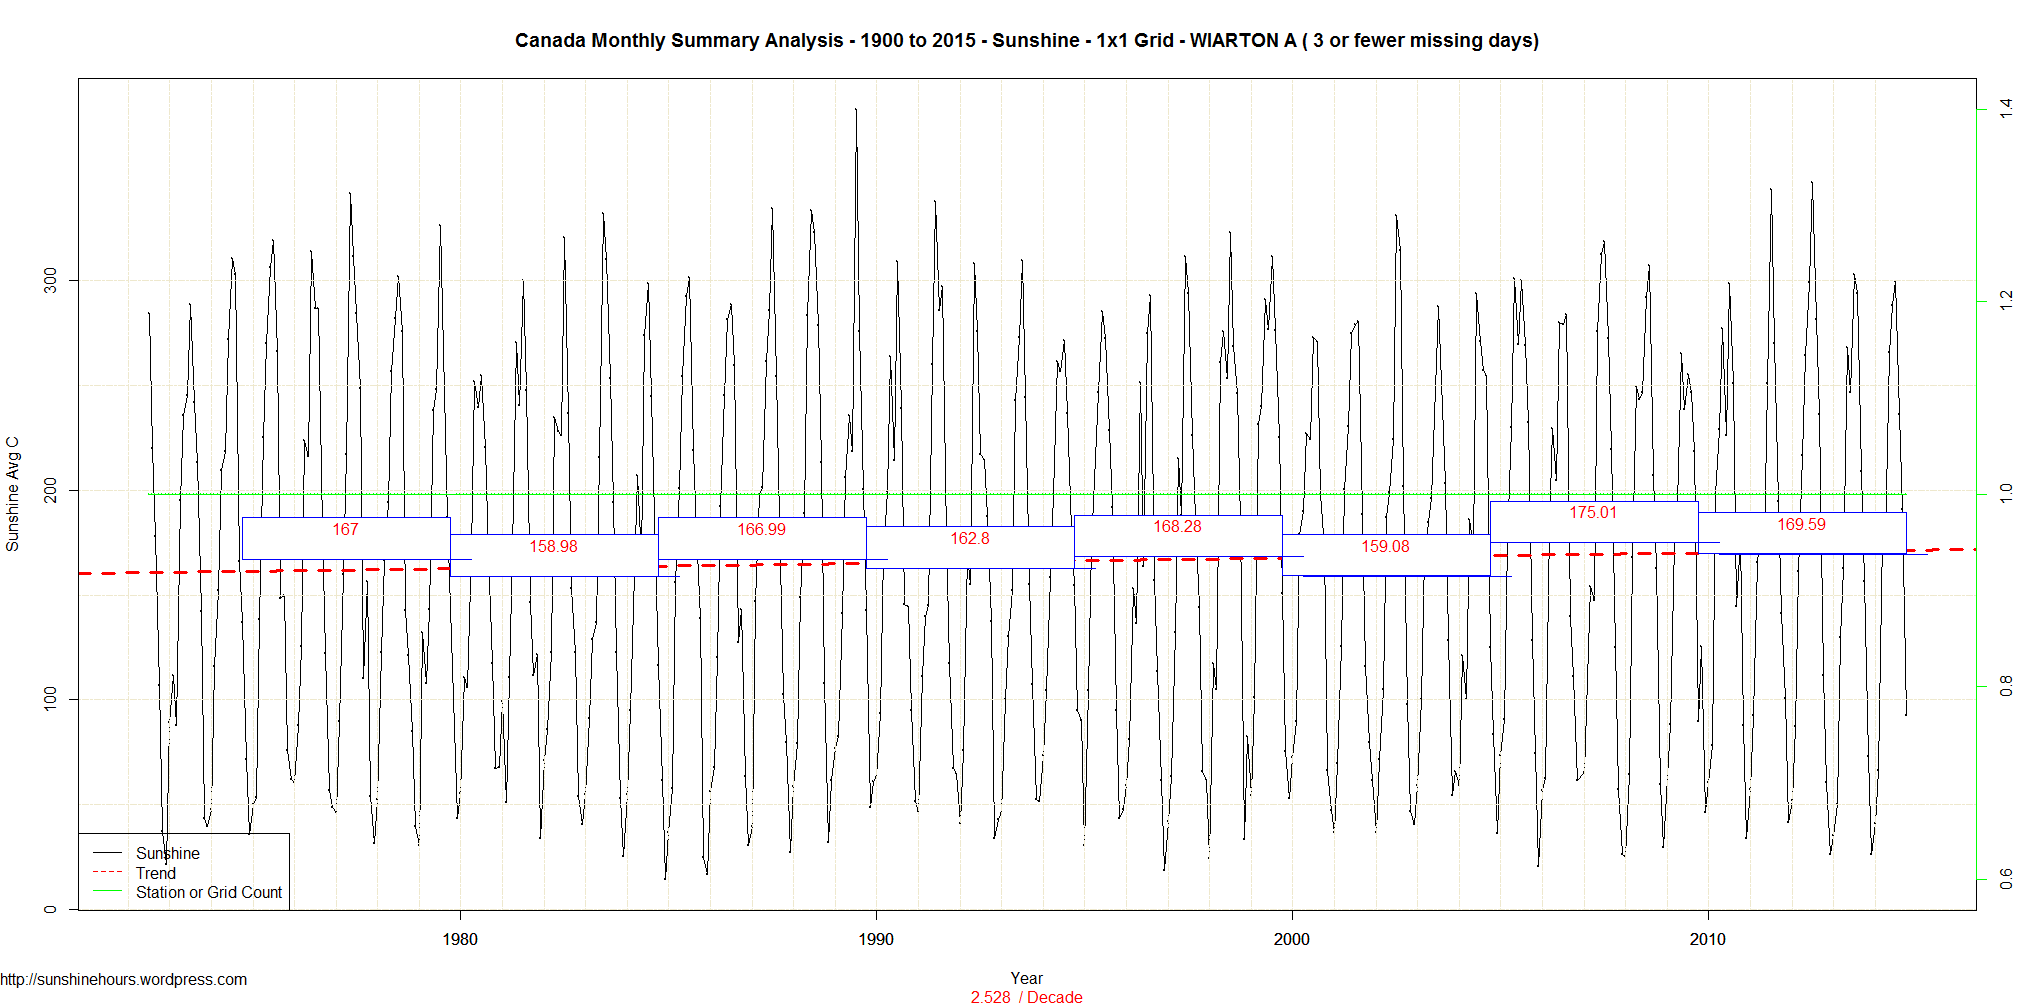
WIARTON A
As of today, only WIARTON A reports sunshine data and for May 2015 25 out of 31 days had no valid measurements.
Cleaner Air = More Sunshine = Warmer
“A paper published today in Geophysical Research Letters finds that clean air laws which greatly reduced sulfur dioxide emissions explain 81% of the “brightening” of sunshine and 23% of the surface warming in Europe since 1980.”
Read about it here.
Well … technically they say 4.2% less clouds. But that does mean more sunshine (except at night).
The emergence of satellite-based cloud records of climate-length and quality hold tremendous potential for climate model development, climate monitoring, and studies on global water cycling and its subsequent energetics. This article examines the more than thirty-year PATMOS-x AVHRR cloudiness record over North America and assesses its suitability as a climate-quality data record. A loss of ~4.2% total cloudiness is observed between 1982 and 2012 over a North American domain centered over the contiguous United States.
http://journals.ametsoc.org/doi/abs/10.1175/JCLI-D-14-00068.1?af=R&
As you know, land base sunshine monitoring is atrocious in North America. Once upon a time Canada had over 300 stations collecting sunshine data. How do we know whether major ups and downs in climate aren’t because of more or less clouds?
(h/t Hockey Schtick)
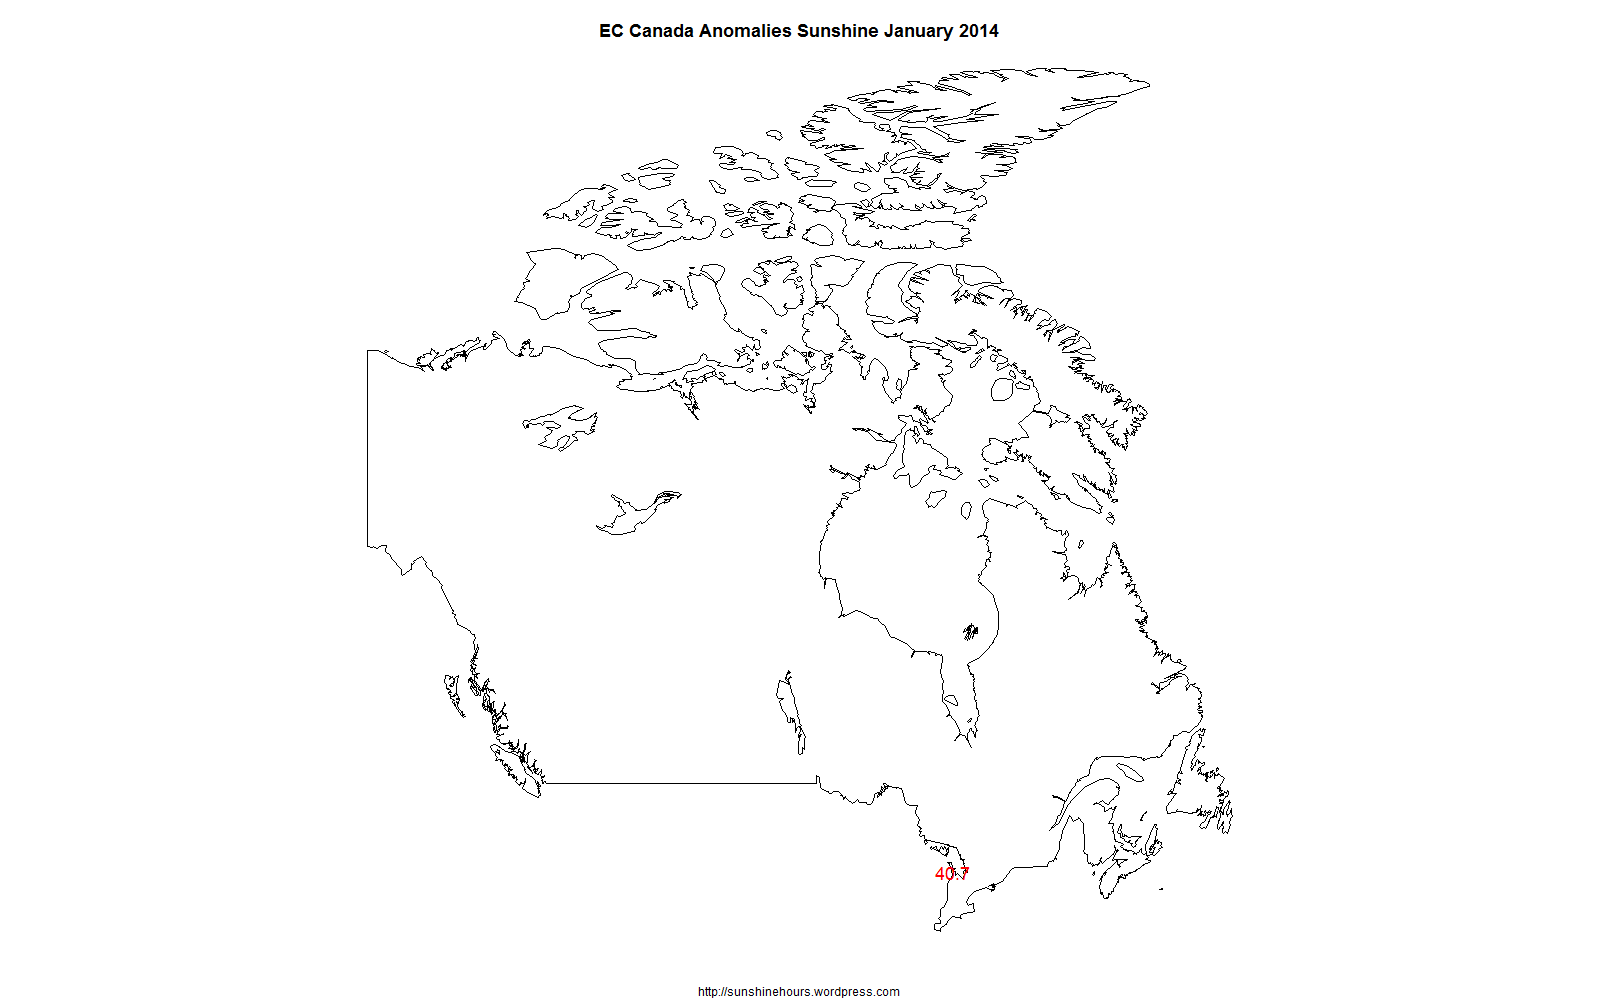
Once up a time (June of 1978 to be precise) if you downloaded Environment Canada’s monthly summaries, you would have found 313 stations with “Bright Sunshine” hours.
As of January 2014, there is only one. (Ignore the title. Those are hours , not anomalies. I’m just depressed about the loss of data. How do we know whats going on if we don’t collect sunshine data???)
"Clean-air policies in developing countries have resulted in reduced levels of anthropogenic atmospheric
aerosol pollution. Reductions in aerosol pollution is thought to result in a reduction in haze and
cloud layers, leading to an increase in the amount of solar radiation reaching the surface, and ultimately,
an increase in surface temperatures. There have been many studies illustrating coherent relationships
between surface solar radiation and temperature however, a direct link between aerosol emissions,
concentrations, and surface radiation has not been demonstrated to date. Here, we illustrate a coherence
between the trends of reducing anthropogenic aerosol emissions and concentrations, at the interface
between the North-East Atlantic and western-Europe, leading to a staggering increase in surface
solar radiation of the order of ∼20% over the last decade."
Clean air legislation really got going in the late 1970s.
Once upon a time, there were over 250 weather stations collecting bright sunshine data in Canada each month.
Alas we are now down to 7 stations. In 3 provinces. And only 5 of the 7 are considered reliable enough or old enough to have “% of Normals” calculated.
March 2013 was pretty sunny in BC (really Vancouver Island / Vancouver) where sunshine was around 115% of normal (the 1971-2000 average).
(I’m not sure why Vancouver has an NA for % of normal as it usually has a value )
I think most of the sunshine arrived the last week of March.
Goose A was pretty gloomy. 61% of normal.
| Province | Station | Year | Month | Bright Sunshine Hours | Bright Sunshine % of Normal |
| BC | VICTORIA INTL A | 2013 | 3 | 160 | 112 |
| BC | COMOX A | 2013 | 3 | 144 | 115 |
| BC | VANCOUVER INTL A | 2013 | 3 | 156 | NA |
| ONT | WIARTON A | 2013 | 3 | 130 | 88 |
| ONT | TORONTO LESTER B. PEARSO | 2013 | 3 | 146 | NA |
| NFLD | CARTWRIGHT | 2013 | 3 | 58 | NA |
| NFLD | GOOSE A | 2013 | 3 | 82 | 61 |
Once upon a time Environment Canada used to collect bright sunshine data for well over 250 weather stations. Now they are down to 7.
One commenter told us about experiencing over 500 hours of sunshine in one month when he was up in Eureka Nunavut (it was NWT when he was there).
I thought I would post the top 50 sunniest months (total hours of bright sunshine) ever in Canada. Of course they are all in the far north of Canada.
The winner is Eureka. 667 hours of bright sunshine in May of 1987. Sadly Eureka no longer collects bright sunshine data (it stopped around May 2005)
The highest sunshine total for a weather station not in the north is VICTORIA GONZALES HTS. 425 hours of bright sunshine for July 1958. See table at bottom for non-northern stations.
| Province | Station | Year | Month | Bright Sunshine Hours | Bright Sunshine % of Normal |
| NU | EUREKA | 1987 | 5 | 667 | 134 |
| NU | EUREKA | 1989 | 5 | 632 | 127 |
| NU | EUREKA | 1973 | 5 | 621 | 125 |
| NU | EUREKA | 1991 | 5 | 593 | 120 |
| NU | EUREKA | 1997 | 6 | 586 | NA |
| NU | ALERT | 2003 | 7 | 576 | 196 |
| NWT | INUVIK UA | 2004 | 6 | 574 | NA |
| NU | EUREKA | 2005 | 5 | 574 | 116 |
| NU | EUREKA | 1976 | 5 | 573 | 115 |
| NU | EUREKA | 2002 | 5 | 567 | 114 |
| NU | EUREKA | 1981 | 6 | 565 | 141 |
| NU | EUREKA | 1998 | 5 | 564 | 114 |
| NU | EUREKA | 1988 | 7 | 563 | 156 |
| NU | EUREKA | 1975 | 5 | 554 | 112 |
| NU | EUREKA | 1981 | 5 | 548 | 111 |
| NU | ALERT | 1981 | 5 | 547 | 131 |
| NU | EUREKA | 1974 | 5 | 544 | 110 |
| NU | EUREKA | 1972 | 5 | 543 | 109 |
| NU | ISACHSEN | 1973 | 5 | 543 | NA |
| NU | EUREKA | 1979 | 5 | 543 | 109 |
| NU | RESOLUTE CARS | 1970 | 5 | 536 | 172 |
| NU | EUREKA | 1988 | 5 | 535 | 108 |
| NU | EUREKA | 1985 | 5 | 532 | 107 |
| NU | EUREKA | 1990 | 6 | 531 | 133 |
| NWT | SACHS HARBOUR A | 1958 | 6 | 529 | 146 |
| NU | ALERT | 1985 | 5 | 529 | 126 |
| NWT | AKLAVIK A | 1959 | 6 | 526 | NA |
| NU | EUREKA | 1980 | 5 | 521 | 105 |
| NU | ALERT | 1972 | 5 | 514 | 123 |
| NU | EUREKA | 2001 | 5 | 512 | 103 |
| NWT | SACHS HARBOUR A | 1984 | 6 | 510 | 141 |
| NWT | INUVIK UA | 2003 | 6 | 508 | NA |
| NU | EUREKA | 2003 | 7 | 506 | 139 |
| NU | EUREKA | 2004 | 4 | 506 | 144 |
| NU | ALERT | 1987 | 4 | 503 | 146 |
| NU | ALERT | 2000 | 5 | 503 | 120 |
| NU | EUREKA | 1978 | 7 | 498 | 138 |
| NU | EUREKA | 1971 | 6 | 495 | 124 |
| NU | EUREKA | 2000 | 6 | 495 | 124 |
| NU | RESOLUTE CARS | 1988 | 7 | 492 | 166 |
| NU | EUREKA | 1970 | 5 | 491 | 99 |
| NU | ALERT | 1971 | 5 | 491 | 117 |
| NU | EUREKA | 1996 | 5 | 490 | 99 |
| NU | EUREKA | 1977 | 6 | 489 | 122 |
| NU | EUREKA | 1995 | 5 | 488 | 98 |
| NU | ALERT | 1974 | 6 | 487 | 151 |
| NU | EUREKA | 1969 | 5 | 486 | 98 |
| NU | EUREKA | 1987 | 7 | 486 | 135 |
| NU | EUREKA | 1983 | 5 | 484 | 98 |
| NU | ALERT | 1979 | 5 | 483 | 115 |
Top 50 Non-Northern Bright Sunshine Stations
| Province | Station | Year | Month | Bright Sunshine Hours | Bright Sunshine % of Normal |
| BC | VICTORIA GONZALES HTS | 1958 | 7 | 425 | 130 |
| BC | VICTORIA INTL A | 1985 | 7 | 422 | 131 |
| ALTA | MANYBERRIES CDA | 1985 | 7 | 414 | 115 |
| BC | CRANBROOK A | 1985 | 7 | 413 | 130 |
| ALTA | MEDICINE HAT A | 1991 | 7 | 413 | 118 |
| BC | VICTORIA GONZALES HTS | 1960 | 7 | 411 | 125 |
| MAN | RIVERS A | 1960 | 7 | 410 | NA |
| BC | SATURNA ISLAND CS | 1985 | 7 | 410 | NA |
| BC | SAANICHTON CDA | 1958 | 7 | 406 | 139 |
| SASK | SWIFT CURRENT CDA | 1967 | 7 | 403 | 130 |
| ALTA | MANYBERRIES CDA | 1988 | 7 | 401 | 111 |
| QUE | INUKJUAK UA | 1996 | 7 | 401 | 177 |
| BC | NANAIMO A | 1958 | 7 | 400 | 137 |
| SASK | MOOSE JAW A | 1967 | 7 | 400 | 121 |
| BC | VICTORIA GONZALES HTS | 1984 | 7 | 400 | 122 |
| BC | COWICHAN BAY CHERRY POIN | 1958 | 7 | 398 | NA |
| BC | PRINCETON A | 1985 | 7 | 398 | 131 |
| MAN | THE PAS A | 1964 | 6 | 397 | 139 |
| SASK | ESTEVAN A | 1967 | 7 | 397 | 119 |
| MAN | DAUPHIN A | 1974 | 6 | 397 | 145 |
| BC | NANAIMO A | 1985 | 7 | 397 | 136 |
| BC | ANAHIM LAKE 5 MILE RANCH | 1985 | 7 | 397 | NA |
| BC | VERNON | 1985 | 7 | 397 | 127 |
| BC | CASTLEGAR A | 1985 | 7 | 397 | 134 |
| ALTA | SUFFIELD A | 1953 | 7 | 396 | 120 |
| SASK | ESTEVAN A | 1964 | 7 | 396 | 118 |
| MAN | DELTA MARSH CS | 1974 | 6 | 396 | 141 |
| SASK | MOOSE JAW A | 1985 | 7 | 396 | 119 |
| ALTA | MEDICINE HAT A | 1953 | 7 | 395 | 112 |
| ALTA | VAUXHALL CDA | 1960 | 7 | 395 | NA |
| ALTA | BROOKS AHRC | 1969 | 8 | 395 | 133 |
| ALTA | LETHBRIDGE CDA | 1973 | 7 | 395 | 118 |
| SASK | BAD LAKE IHD 102 | 1984 | 7 | 395 | NA |
| BC | WILLIAMS LAKE A | 1985 | 7 | 395 | 133 |
| ALTA | MEDICINE HAT A | 1985 | 7 | 395 | 112 |
| SASK | SWIFT CURRENT A | 1994 | 7 | 395 | 116 |
| ALTA | VAUXHALL CDA | 1959 | 7 | 394 | NA |
| SASK | SASKATOON U OF S | 1959 | 7 | 394 | NA |
| ALTA | LETHBRIDGE CDA | 1967 | 7 | 394 | 118 |
| SASK | WEYBURN | 1967 | 7 | 394 | 112 |
| BC | ABBOTSFORD A | 1985 | 7 | 394 | 139 |
| BC | TRAIL TADANAC | 1985 | 7 | 394 | NA |
| BC | KAMLOOPS A | 1985 | 7 | 394 | 127 |
| SASK | REGINA A | 1967 | 7 | 393 | 119 |
| SASK | SASKATOON U OF S | 1960 | 7 | 392 | NA |
| ALTA | LETHBRIDGE CDA | 1969 | 8 | 392 | 134 |
| BC | SAANICHTON CDA | 1985 | 7 | 392 | 134 |
| SASK | WEYBURN | 1985 | 7 | 392 | 111 |
| ALTA | SUFFIELD A | 1963 | 7 | 391 | 119 |
| ALTA | SUFFIELD A | 1967 | 7 | 391 | 119 |
Once upon a time, there were over 250 weather stations collecting bright sunshine data in Canada each month.
Alas we are now down to 7 stations. In 3 provinces. And only 5 of the 7 are considered reliable enough or old enough to have “% of Normals” calculated.
February 2013 was pretty gloomy in BC where sunshine was around 60% of normal (the 1971-2000 average).
Goose Airport in NFLD was 3% sunnier than normal. Wiarton Airport in Ontario was gloomiest at 54% of normal.
| Province | Station | Year | Month | Bright Sunshine Hours | Bright Sunshine % of Normal |
| BC | VICTORIA INTL A | 2013 | 2 | 55 | 61 |
| BC | COMOX A | 2013 | 2 | 53 | 62 |
| BC | VANCOUVER INTL A | 2013 | 2 | 50 | 59 |
| ONT | WIARTON A | 2013 | 2 | 50 | 54 |
| ONT | TORONTO LESTER B. PEARSO | 2013 | 2 | 82 | NA |
| NFLD | CARTWRIGHT | 2013 | 2 | 102 | NA |
| NFLD | GOOSE A | 2013 | 2 | 130 | 103 |
Update: Eureka Top 15 Sunshine Months From the Past (See comment)
| Province | Station | Year | Month | Bright Sunshine Hours | Bright Sunshine % of Normal |
| NU | EUREKA | 1987 | 5 | 667 | 134 |
| NU | EUREKA | 1989 | 5 | 632 | 127 |
| NU | EUREKA | 1973 | 5 | 621 | 125 |
| NU | EUREKA | 1991 | 5 | 593 | 120 |
| NU | EUREKA | 1997 | 6 | 586 | NA |
| NU | EUREKA | 2005 | 5 | 574 | 116 |
| NU | EUREKA | 1976 | 5 | 573 | 115 |
| NU | EUREKA | 2002 | 5 | 567 | 114 |
| NU | EUREKA | 1981 | 6 | 565 | 141 |
| NU | EUREKA | 1998 | 5 | 564 | 114 |
| NU | EUREKA | 1988 | 7 | 563 | 156 |
| NU | EUREKA | 1975 | 5 | 554 | 112 |
| NU | EUREKA | 1981 | 5 | 548 | 111 |
| NU | EUREKA | 1974 | 5 | 544 | 110 |
| NU | EUREKA | 1972 | 5 | 543 | 109 |
| NU | EUREKA | 1979 | 5 | 543 | 109 |
I found this paper on Google Scholar. But I can’t find a direct link anywhere that works.
But it is important so I will put up this post anyway.
Colin O’Dowd, Darius Ceburnis, Aditya Vaishya S. Gerard Jennings & Eoin Moran
School of Physics & Centre for Climate and Air Pollution Studies, National University of Ireland Galway
“This study has demonstrated for the first time, using in-situ PM measurements,
that reducing aerosol pollution is driving the Insolation Brightening phenomenon and
that the trends in aerosol pollution, particularly for sulphate aerosol, is directly linked
to anthropogenic emissions. Ultimately, the analysis demonstrates that clean air
policies in developed regions such as Europe are driving brightening of the
atmosphere and increasing the amount of global radiation reaching the Earth’s surface.
The actual impact of cleaner air and insolation brightening on temperature remains to
be elucidated”
As I’ve said before, cleaner air may have warming the earth after 1975. Dirtier air after 2000 may have stopped the warming.
